Publisher’s version / Version de l'éditeur:
Vous avez des questions? Nous pouvons vous aider. Pour communiquer directement avec un auteur, consultez la première page de la revue dans laquelle son article a été publié afin de trouver ses coordonnées. Si vous n’arrivez pas à les repérer, communiquez avec nous à PublicationsArchive-ArchivesPublications@nrc-cnrc.gc.ca.
Questions? Contact the NRC Publications Archive team at
PublicationsArchive-ArchivesPublications@nrc-cnrc.gc.ca. If you wish to email the authors directly, please see the first page of the publication for their contact information.
https://publications-cnrc.canada.ca/fra/droits
L’accès à ce site Web et l’utilisation de son contenu sont assujettis aux conditions présentées dans le site LISEZ CES CONDITIONS ATTENTIVEMENT AVANT D’UTILISER CE SITE WEB.
Research Report (National Research Council of Canada. Institute for Research in
Construction), 2009-03-18
READ THESE TERMS AND CONDITIONS CAREFULLY BEFORE USING THIS WEBSITE.
https://nrc-publications.canada.ca/eng/copyright
NRC Publications Archive Record / Notice des Archives des publications du CNRC :
https://nrc-publications.canada.ca/eng/view/object/?id=0084ccdc-ed9c-4c67-bcf3-e53b483fc66c https://publications-cnrc.canada.ca/fra/voir/objet/?id=0084ccdc-ed9c-4c67-bcf3-e53b483fc66c
NRC Publications Archive
Archives des publications du CNRC
For the publisher’s version, please access the DOI link below./ Pour consulter la version de l’éditeur, utilisez le lien DOI ci-dessous.
https://doi.org/10.4224/20373934
Access and use of this website and the material on it are subject to the Terms and Conditions set forth at
Design of a single-room heat release rate calorimeter for the
characterization of fires in multi-suite residential dwellings project
http://irc.nrc-cnrc.gc.ca
De sign of a Single -Room H e at Re le a se Rat e
Ca lorim e t e r for t he Cha ra c t e rizat ion of Fire s
in M ult i-Suit e Re side nt ia l Dw e llings Proje c t
I
R C - R R - 2 6 7
B w a l y a , A . C . ; G i b b s , E . ; L o u g h e e d , G . D . ;
K a s h e f , A . ; S a b e r , H . H .
M a r c h 1 8 , 2 0 0 9
The material in this document is covered by the provisions of the Copyright Act, by Canadian laws, policies, regulations and international agreements. Such provisions serve to identify the information source and, in specific instances, to prohibit reproduction of materials without written permission. For more information visit http://laws.justice.gc.ca/en/showtdm/cs/C-42
Les renseignements dans ce document sont protégés par la Loi sur le droit d'auteur, par les lois, les politiques et les règlements du Canada et des accords internationaux. Ces dispositions permettent d'identifier la source de l'information et, dans certains cas, d'interdire la copie de documents sans permission écrite. Pour obtenir de plus amples renseignements : http://lois.justice.gc.ca/fr/showtdm/cs/C-42
i
Preface
This report describes the design of a single-room test facility for measuring the full-scale heat release rate of residential combustible furnishings in the Characterization of Fires in Multi-Suite Residential Dwellings (CFMRD) project. The report focuses on the following aspects of the overall design of the facility: room configuration, instrumentation, calibration of the heat release rate calorimeter, preliminary experiments with propane fires and a commissioning fire experiment to evaluate the performance of the facility. The CFMRD project is a four-year collaborative research undertaking with industry, provincial
governments and city authorities that was initiated by NRC-IRC in 2006 to study fires in low-rise multi-suite residential dwellings of light-frame construction. The CFMRD project focuses on fires in dwellings, such as apartments, semi-detached houses, duplex houses, townhouses or row houses, secondary suites and residential care facilities as these fires have a potentially greater impact on adjacent suites.
The main objectives of the project are:
1. To conduct fire experiments to characterize fires originating in various living spaces within multi-suite dwellings.
2. To conduct numerical simulations of various fire scenarios in order to interpolate and extend the data beyond that obtained in the experimental studies.
3. To produce a set of realistic design fires for multi-suite dwellings from the experimental data. 4. To develop an analytical method that can be used to calculate design fires for multi-suite
dwellings.
The research approach employed by the project utilizes literature reviews, surveys to determine typical configurations and combustibles, computer simulations and fire experiments.
NRC-IRC gratefully acknowledges the financial and technical support of the Project Consortium, which consists of representatives from the following participating organizations:
• Canadian Automatic Sprinkler Association
• Canadian Concrete Masonry Producers Association • Canadian Furniture Manufacturers Association • The Canadian Wood Council
• City of Calgary
• FPInnovations - Forintek Division • Gypsum Association
• Masonry Worx
• Ontario Ministry of Municipal Affairs and Housing • Régie du Bâtiment du Québec
ii
Abstract
A test facility consisting of a heat release rate calorimeter and a 4.2 m deep x 3.8 m wide x 2.38 m high test room simulating a residential bedroom was designed and constructed for conducting fire experiments of short duration with single or limited quantities of combustible residential furnishings and other contents of interest in the Characterization of Fires in Multi-Suite Residential Dwellings (CFMRD) project. The calorimeter was calibrated with a propane burner that produced a maximum fire size of about 4,500 kW, based on the flow rate and heating value of propane. The results of experiments with propane fires using three different sizes of window openings indicated that a 1.5 m wide x 1.5 m high opening, W3, which was the largest window opening tested, was suitable for this phase of the project since it supported the highest measured heat release rate of about 4,700 kW and resulted in the most severe
temperature conditions in the test room. Peak temperatures of 1,050oC and 1,090oC were reached in two sections of the test room, whereas the temperatures did not exceed 1,000oC in the tests with smaller window opening sizes, W1 and W2, measuring 1.0 m x 1.0 m and 1.42 m x 1.2 m, respectively.
The test facility was commissioned by conducting a fire experiment with a fuel package consisting of a mock-up sofa and some wood cribs. The peak heat release rate and temperature measured during the experiment were 3,120 kW (214 s after ignition) and 852o
C for the resulting flashover fire. Numerous temperature and heat flux measurements were taken at various locations for evaluating heat transmission across the room boundaries.
iii
Abbreviations
E East Ext External
H Height (m)
HRR Heat release rate (kW)
N North NE North east NW North west o.c. On centre S South SE South east SW South west TC Thermocouple WD Width (m) W West
Acronyms
CFD Computational Fluid Dynamics
CFMRD Characterization of Fires in Multi-Suite Residential Dwellings
FDS Fire Dynamics Simulator
1
Design of a Single-Room Heat Release Rate Calorimeter for the Characterization
of Fires in Multi-Suite Residential Dwellings Project
By
Alex Bwalya, Eric Gibbs, Gary Lougheed, Ahmed Kashef and Hamed Saber
1 Background
This report describes the design and instrumentation of a test facility for conducting room fire experiments of short duration with single or limited quantities of combustible residential furnishings and other contents of interest in the Characterization of Fires in Multi-Suite
Residential Dwellings (CFMRD) project. Based on survey results for multi-family dwellings [1], a test facility consisting of a medium-sized room with a floor area of 16 m2 was selected to
represent either a bedroom or a living room. The room is referred to in this report as the
“CFMRD test room” or simply as “test room”. A rectangular calorimeter hood and a circular duct system for collecting and exhausting the gaseous products of combustion completed the test facility.
The main objective of the fire experiments in the CFMRD test room is to study the combustion behaviour and properties of individual living room and bedroom furnishings such as mattresses, complete bed systems, upholstered furniture (chairs and sofas), and smaller groups of
combustible contents identified from the survey of multi-family dwellings. A window opening1 was preferred over a door-opening2 since the former is representative of the main source of ventilation that would be available after window panes have broken and fallen out during the growth and initial stages of a fully-involved fire in living rooms and bedrooms. From the onset, it was recognized that the size of the ventilation openings3 (open windows or doors) was an important variable that affects the availability of air required to sustain combustion and, consequently the course of a fire and its intensity with regards to the evolution of heat release rate (HRR) and temperature over time. Therefore, the selection of a suitable size of the window opening was given much consideration in the design of the test facility. To this end, computer modelling of 11 different fire scenarios [2] using the NIST Fire Dynamics Simulator (FDS) [3], which is a public domain fire model, and fire experiments with three opening sizes using propane burners were conducted in order to aid the selection of a suitable size of the window
1
In this work, the term “window opening” refers to an opening in a wall that does not have window panes installed, unlike actual windows (glass-covered openings) found in dwellings.
2
2 opening. Although there were no suitable experimental data against which to verify the results from the computer model, the results were found to be useful in demonstrating trends and identifying suitable positions for some types of instrumentation. The results of the fire experiments and a brief summary of the fire simulations are also presented in this report. The test facility was commissioned by conducting a fire experiment with a fuel package consisting of a mock-up sofa and two wood cribs, which was identical to the fire source assumed in the fire simulations in an effort to provide experimental data for verification of the FDS model. These results are presented in this report.
2 Fire Modelling of Various Ventilation Scenarios
Numerical simulations of 11 different ventilation scenarios (SC1 to SC11), which are listed in Table 1 were conducted using the NIST FDS, a fire model based on computational fluid
dynamics (CFD) solution techniques [3]. The objective of the fire simulations was to gain insight into the effect of the size, number and location of ventilation openings on fire developments, as well as to help identify suitable locations for some types of instrumentation. Table 1 also lists a commonly used correlating parameter, the ventilation factor , which takes into account the existence of multiple openings. It is known that the flow of air into a room is proportional to the ventilation factor.
Figure 1. Illustration of the geometry of the room and fuel package that was modelled with FDS. Detailed discussions of the simulations (assumptions, results and analysis) have been published elsewhere [2, 4, 5]. In Figure 1, the direction of north has been modified from the original
simulations as to align with the way the test facility was actually constructed. This change does
3
The term “ventilation opening” has general usage to refer to any opening to or from a room, which has not been specified as either a door or a window.
3 not affect the interpretation of the results, since there were no wind currents or adjoining
compartments in the simulations. The fuel package was derived from a previous project [6, 7]. In the model, it consisted of a mock-up sofa made out of 8.3 kg of polyurethane foam and two wood cribs weighing a total of 86.7 kg, which were placed underneath the mock-up sofa. Table 1. Ventilations scenarios modelled with FDS.
Opening in South Wall Openings in North Wall Scenario (SC) Ventilation Factor (m5/2) WD (m) x H (m) (centered) WD (m) x H (m) Location SC1 2.76 1.5 x 1.5 None None SC2 5.31 1.5 x 1.5 0.9 x 2.0 (door) Center SC3 / SC9 3.67 2.0 x 1.5 None None SC4 3.59 1 x 1 0.9 x 2.0 (door) Center
SC5 2.55 None 0.9 x 2.0 (door) Center
SC6 4.24 None 1.5 x 2.0 (door) Center
SC7 4.39 None 1.0 x 1.5 (window) 0.9 x 2.0 (door) NW center NE center SC8 3.59 None 1.0 x 1.0 (window) 0.9 x 2.0 (door) NW center NE center SC10 1.00 1.0 x 1.0 None None SC11 1.84 1.4 x 1.2 None None
* All of the openings had 2 m high soffits and the fuel package was centrally located in all of the scenarios except for SC9 in which it was positioned in the northwest (NW) corner
The dimensions of the room (3.8 m wide x 4.2m deep x 2.4 m high) and window openings used in the simulations were derived from survey results for multi-family dwellings [1]. According to the results of the survey, a room with dimensions 3.8 m wide x 4.2 m deep x 2.4 m (a floor area of 16 m2) represented the mean dimensions of either a bedroom or a living room, whereas the typical sizes of living room and bedroom windows were within range of 2.0 m wide x 1.5 m high to 1.0 m x 1.0 m. The mean window size was found to be 1.4 m wide x 1.2 m high, which is reflected in scenario SC11. In the scenarios, ventilation openings were located only in the south and north walls to give the following groups (also listed in Detailed discussions of the simulations
4 (assumptions, results and analysis) have been published elsewhere [2, 4, 5]. In Figure 1, the direction of north has been modified from the original simulations as to align with the way the test facility was actually constructed. This change does not affect the interpretation of the
results, since there were no wind currents or adjoining compartments in the simulations. The fuel package was derived from a previous project [6, 7]. In the model, it consisted of a mock-up sofa made out of 8.3 kg of polyurethane foam and two wood cribs weighing a total of 86.7 kg, which were placed underneath the mock-up sofa.
Table 1):
1) One window opening in the south wall: SC1, SC3, SC9, SC10 and SC11 2) One door-opening in the north wall: SC5 and SC6
3) Two openings - one opening in both the north and south walls: SC2 and SC4 4) Two openings (window and door) in the north wall: SC7 and SC8
Scenarios in groups 1) and 2) evaluated the effect of single ventilation openings of various sizes. Group 3) scenarios dealt with the issue of cross-flow resulting from two openings located in opposite walls, while group 4) addressed the issue of multiple ventilation openings in the same wall. One scenario, SC9, was conducted to study the effect of moving the fuel package to a markedly different location with constrained airflow within the room.
The ignition source specified in all of the simulations was a 3 kW burner (30 s duration) that was placed at the center of the seat area of the mock-up sofa. The boundaries of the room were assumed to be adiabatic (thermally insulated) and inert (non-combustible). All the ventilation openings (windows and doors) opened directly to the outside.
Results and Conclusions
The results of peak HRR and temperatures predicted by the FDS simulations are summarized in Table 2 together with values of HRR that were calculated using theoretical considerations for each ventilation scenario. The results in Table 2 are listed in descending order of the theoretical peak HRR values. The predicted HRRs are significantly greater than theoretical expectations in all of the scenarios where the fuel source was centrally located, except for scenario SC2 where the predicted HRR is lower. The general trend that larger ventilation opening sizes (high
ventilation factor) result in higher HRRs is consistent with theoretical expectations. Perhaps one of the most interesting observations from the simulations is the fact that two of the four scenarios (SC7 and SC8) with peak HRRs exceeding 7,000 kW had multiple openings in the same wall. Scenarios SC3 and SC9 reveal another interesting result that the HRR was significantly reduced in SC3 because of moving the fuel package into a corner position away from the
5 ventilation opening. The result for SC8 (two openings in the same wall) is particularly interesting considering that it was ranked in seventh position based on theoretical considerations, but had the highest HRR (ranked in first position) in the FDS simulations. A detailed analysis of the simulation results suggests that this is likely because the smaller window in SC8, which was at a higher elevation, largely behaved like an exhaust vent.
Since the FDS simulations had some limitations, such as the lack of validation under the assumptions made [2, 4, 5], it was determined that actual fire experiments with a limited set of window opening sizes were a necessary final step in selecting the final size of the window opening. Nevertheless, the results of the computer simulations revealed interesting flow patterns across the window openings, which highlighted the need to install velocity probes at these locations to better determine the location of the neutral plane, for instance. The neutral plane is an interface of zero pressure that demarcates the out-flowing fire effluent and in-flowing fresh air at the window plane. The lack of information on the heat transfer characteristics of the room boundaries highlighted the need to quantify heat losses through the walls by incorporating heat flux gauges in the instrumentation plan of the CFMRD test room.
Table 2. Ventilations scenarios modelled with FDS (shaded scenarios had a single opening). Scenario Ventilation Factor (m5/2) Theoretical Peak HRR4 (kW) Rank FDS Predicted Peak HRR (kW) Rank FDS Predicted Average Temperature (oC) SC2 5.31 8,000 1 7,292 3 579 SC7 4.39 6,600 2 7,431 2 923 SC6 4.24 6,300 3 7,069 4 852 SC3 / SC9 3.67 / 3.67 5,500 / 5,500 4 / 5 6,940 / 4,760 5 / 9 885 / 715 SC4 3.59 5,400 6 6,816 6 896 SC8 3.59 5,400 7 7,450 1 903 SC1 2.76 4,100 8 6,092 7 740 SC3 2.55 3,900 9 4,983 8 836 4
Calculated assuming a combustion efficiency of 90%, the ventilation controlled HRR is given as: 1.518 x ventilation factor (
F =A
v oH
o ) x efficiency[18]6
SC11 1.84 2,800 10 4,620 10 675
SC10 1.00 1,700 11 4,400 11 577
* All of the openings had 2 m high soffits and the fuel package was centrally located in all of the scenarios except for SC9 in which it was positioned in the northwest (NW) corner
3 The CFMRD Test Room and Heat Release Rate Calorimeter
Figure 2 shows the layout of the test facility (CFMRD test room and HRR calorimeter). The structure of the HRR calorimeter consists of a 6 m x 6 m square sheet-metal hood with a vertical exhaust duct having a diameter of 1.4 m. Measurements of mass flow rate, gas temperature and concentrations of oxygen, carbon dioxide and carbon monoxide taken in the vertical section of the hood exhaust duct facilitate the calculation of the HRR by using an oxygen consumption method [8].
The test room was erected on a 152 mm thick poured concrete slab using non-combustible materials except for the roof, which was constructed with plywood sheathing. Lightweight steel framing was used for the walls and roof; the walls were lined with cement board and the ceiling was lined with two layers of gypsum board, which were attached to resilient channels. Fastening two steel joists back-to-back, as illustrated in Figure 3, strengthened the roof structure. Further details of the framing members and sheathing (lining) materials, which were used in constructing the room, are given in Table 3.
7 Figure 2. Model illustration of the CFMRD test room and heat release rate calorimeter test facility
Figure 3. Construction details of the roof
Table 3. Framing and lining materials Framing
Members
Interior lining Exterior lining
Walls 152.4 mm 14 gauge steel studs @ 406.4 mm o.c.
12.7 mm cement board (one layer)
12.7 mm cement board (one layer)
Ceiling / Roof 152.4 mm steel joists* 14 gauge @ 406.4 mm o.c.
Gypsum board (two layers)5
15.9 mm plywood (one layer)
Floor none 12.7 mm cement
board (one layer)
Concrete slab
* Two joists were fastened back-to-back to strengthen the ceiling and gypsum boards were fastened to resilient channels spaced 406.4 mm o.c., which were installed perpendicular to the joists.
5
Initially, a 12.7 mm layer of regular gypsum board was attached to a 15.9 mm layer of Type-X gypsum board. The 12.7 mm layer of regular gypsum board was later replaced with a 15.9 mm layer of Type-X gypsum board, as will be explained in due course.
8 The interior dimensions of the test room, which were derived from survey results [1], are 3.80 m wide x 4.20 m deep by 2.38 m high, giving a floor area of 16 m2. The height of the room was intended to be 2.4 m, but it ended up being 2.38 m after the resilient channels were installed. These dimensions were achieved with an accuracy of at least ±1%. The dimensions were selected to represent the average area of a primary (master) bedroom or a living room found in the survey. A 2.0 m x 0.9 m doorway was provided in the north wall for accessing the room. The doorway was covered with a removal panel (not hinged) that was constructed out of steel studs, cement board (interior side) and plywood on the outside. Since the size of the window opening in the south-side wall of the test room was not decided at the time of construction, a 2 m x 2 m rough opening was provided in this section to allow the size of the actual window
opening(s) to be changed at a later stage. The room was constructed so that the entire width of the rough opening was directly under the hood, as shown in Figure 2.
3.1 Instrumentation
3.1.1 Heat Release Rate Calorimeter
Measurements of mass flow rate, gas temperature and concentrations of oxygen, carbon dioxide and carbon monoxide were taken in the hood exhaust duct to facilitate calculation of the HRR by using an oxygen consumption method [8]. A pulsed white light smoke meter, which was
described by Crampton and Lougheed [9], was installed in the exhaust duct for measuring smoke density.
3.1.2 CFMRD Test Room
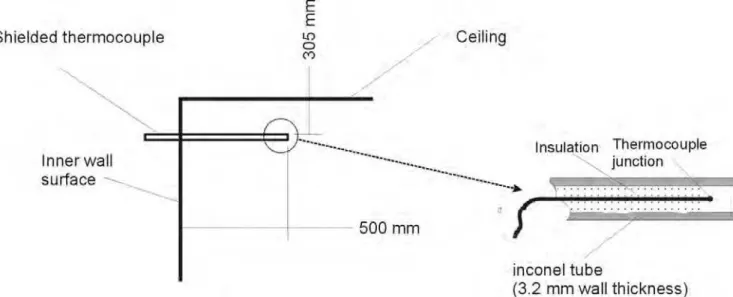
The test room was instrumented with load cells, Gardon heat flux gauges, thermocouples (TCs) and velocity probes in order to take the following measurements: mass loss, radiant heat flux on all of the internal surfaces (walls and ceiling), temperatures at numerous locations and gas velocities at the window opening. Temperature measurements were made using various types of Chromel-Alumel (Type-K) TCs: TC trees , single TCs attached to wall surfaces, single TCs installed in the window opening, single TC installed in a shielded Inconel tube, as shown in Figure 4, in the same manner as the furnace control TCs used in a standard fire resistance wall furnace [10]. These types of TCs (referred to as the “ASTM E119 TC” in this work) was
manufactured to meet the ASTM E119 [10] or CAN/ULC S101 [11] specifications and are
required to have a time constant of between 5 to 7.2 min. For all other installations, two types of exposed TCs were used: bare and fast-response prefabricated sheathed types. The bare TCs were manufactured in-house by fusion-welding the twisted ends of Chromel-Alumel wires to form the TC bead. A TC tree consisted of a vertical array of five TCs suspended from the ceiling at the following heights above the floor: 0.40 m, 0.90 m, 1.40 m, 1.90 m and 2.38 m (~ 2.4 m). The TC located at the 2.38 m height on the tree was actually attached to the ceiling. When
9 rounded off to one decimal place, the height of the ceiling will be shown as 2.4 m in subsequent graphs, which will show the temperature measurements from the TC trees. Table 4 shows the types of TC arrangements and heat flux gauge installations used in the test room. Two heat flux gauges (ExTC-H in Table 4) were mounted on a movable steel post outside the test room to measure the radiant heat flux from the window opening during fire experiments.
Table 4. Installation of TCs and heat flux meters on wall cross-sections and external target Abbreviation Symbol Installation type Installation details
XTC Wall and ceiling*
cross-section with four TCs
XTC-H
Wall and ceiling cross-section with four TCs and one heat flux meter
XTC-HF
Floor installation of heat flux meter with adjacent TC
ExTC-H
Heat flux and temperature measurement at an external target
* For a ceiling installation with two layers of gypsum board, TC no. 1 was between the two layers and TC no. 2 was always attached to the cavity-side.
10 Figure 4. Installation of ASTM E119 TCs (F-TC)
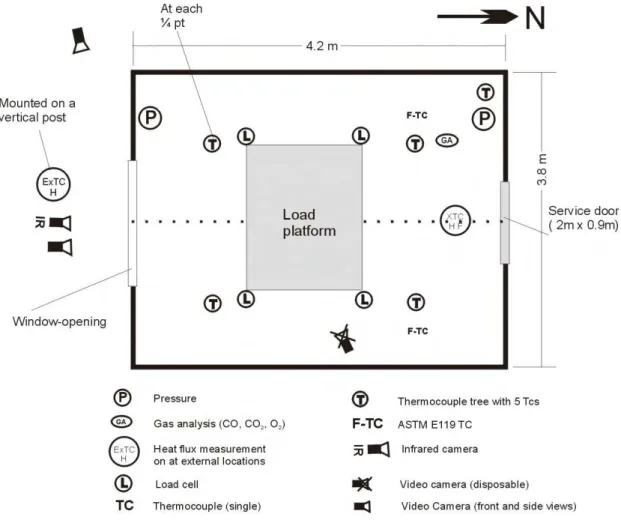
Figure 5 shows a plan view of the instrumentation in the CFMRD room. Five TC trees were installed, four at the “quarter points” and one in the northwest corner. Two ASTM E119 TCs were installed, one of each in the northwest and northeast quadrants of the room. A weighing platform was suspended at a distance of 10 mm above the floor using four steel cables that were attached to load cells (transducers) positioned on the roof. Figures 6 to 9 show the instrumentation to measure heat flux and temperatures on the west wall, east wall, north wall and the ceiling, respectively, as seen from inside the room. The drawings are not to scale. Figure 10 shows the instrumentation of the south wall. The planned instrumentation of the window opening, consisting of 13 TCs and four bi-directional velocity probes, is shown in Figure 11. The bi-directional velocity probes conformed to the specifications documented by McCaffrey and Heskestad [12].
Stainless steel probes for sampling gases at 0.5 m and 1.5 m above the floor were inserted through the north wall as shown in Figure 8.
11 Figure 5. Floor plan of the CFMRD test room
Figure 6. Interior layout of instrumentation on the west wall.
Figure 7. Interior layout of instrumentation on the east wall
12 Figure 8. Interior layout of instrumentation on the
north wall (north only has XTC-H)
Figure 9. Interior layout of instrumentation on the ceiling
Figure 10. Interior layout of instrumentation on the south wall
Figure 11. Planned instrumentation in the window opening (spacing to be determined after
selection of the final size of window opening)
The thermographic system used was a JENOPTIK VarioCAM( HiRes infrared (IR) camera incorporating a 16 bit micro bolometer (an uncooled thermal detector) with 384 x 288 pixels. Additional technical data for the IR camera are given in Table 5.
13 Table 5. Technical data for the VarioCAM® IR camera
Spectral sensitivity
Temperature range Measurement accuracy Thermal resolution ( at 30oC) 7.5 – 14 µm -40oC - 2,000oC 0oC - 120oC: ± 1.5 K >120oC: ±2% <60 - 80 mK
3.1.3 Data Acquisition System
A 16 bit Solartron (Schlumberger) Instruments distributed data acquisition system with
3595 series isolated measurement pods (each having 100 channels) and a personal computer interface was used to record all measurements directly to a hard disk drive at specified intervals. All temperature data were instantly processed by the data acquisition system and recorded as temperature values with an accuracy of better than 1oC. Outputs from heat flux gauges, load cells, pressure transducers, gas analyzers and the smoke meter were recorded as either direct current (DC) voltage or current values and were converted by applying the appropriate
calibration constants after each experiment. The sensitivity of the data acquisition system for voltage and current measurements is 1 µV and 10 nA, respectively.
4 Fire Experiments, Results and Discussion
4.1 Calibration of the Heat Release CalorimeterThe calorimeter was calibrated by using a propane burner with an adjustable HRR output of up to 5,000 kW, which was placed directly under the hood of the calorimeter. The target fire size (propane HRR) was achieved by setting the flow rate of propane to a specific value that was calculated using a calorific value of 46.5 MJ/kg for propane [13]. The propane HRR is taken as the reference value since the calorific value is more accurately known and the flow rate of propane was measured using a volumetric flow meter. The flow rate of propane was either increased or decreased to achieve a desired (target) fire size and maintained at each setting for at least 600 s. The experiments were conducted at exhaust fan speeds of 75% and 50% (or lower) of the maximum setting. Figure 12 shows results for target fire sizes of 1,500 kW, 2,000 kW and 3,500 kW during the first experiment. Figure 13 shows the results for target fire sizes 1,000 kW, 2,500 kW, 4,000 kW and 4,500 kW during the second experiment. Additional experiments were conducted with fire sizes of less than 1,000 kW at fan speeds of 75% and 50%.
14 Time (s) 0 480 960 1440 1920 2400 2880 HRR ( k W) 0 500 1000 1500 2000 2500 3000 3500 4000 Calorimeter HRR Propane HRR Time (s) 0 480 960 1440 1920 2400 2880 HRR ( k W) 0 500 1000 1500 2000 2500 3000 3500 4000 4500 5000 5500 Calorimeter HRR Propane HRR
Figure 12. Calorimeter HRR for propane flow rates to give 1,500 kW, 2,000 kW and 3,500 kW fire sizes, at 75% fan speed
Figure 13. Calorimeter HRR for propane flow rates to give 1,000 kW, 2,500 kW, 4,000 kW and 4,500 kW fire sizes, at 75% fan speed. Figure 14 shows the comparison of the heat release rate measured with the calorimeter (calorimeter HRR) using the oxygen consumption principle and the propane HRR. The results show that the accuracy of the calorimeter HRR was within 10% for fire sizes of greater than 1,000 kW when the fan speed was set at 75%, whereas the accuracy diminished to be worse than +/- 10% for sizes of less than 1,000 kW. However, Figure 15 shows that the accuracy of the HRR measurements for fire sizes less than 1,000 kW was improved to better than +/- 10% by reducing the fan speed to 50% or lower.
Propane HRR (kW) 0 1000 2000 3000 4000 5000 Ca lo ri met e r H RR ( k W ) 0 1000 2000 3000 4000 5000 +10% -10% Propane HRR (kW) 0 200 400 600 800 1000 Ca lo ri met e r H RR ( k W ) 0 200 400 600 800 1000 +10% -10%
Figure 14. Comparison of the calorimeter HRR and the propane HRR at 75% fan speed for fire sizes about to 4,500 kW.
Figure 15. Comparison of the calorimeter HRR and the propane HRR at 50% (or lower) fan speed for fire sizes under 1,000 kW Table 6. Estimated uncertainly of HRR measurement
15 Fan Speed Estimated uncertainty of the calorimeter HRR in each range
0-1,000 kW 1,000–2,000 kW 2,000–3,000 kW 3,000–4,500 kW
50% -5% NA NA NA
75% -19.2% -7.7% -2.2% -1.3%
These results proved that the calorimeter could measure HRRs up to about 4,500 kW with good accuracy. The calorimeter can likely measure higher values of HRRs with reasonable accuracy given that the exhaust fans were only used at 75% of the full speed and the oxygen
concentration did not fall below 18%, as shown in Figure 16. However, a higher capacity propane burner was not available to facilitate a calibration at HRRs above 5,000 kW.
Time (s) 0 240 480 720 960 1200 1440 1680 1920 2160 2400 2640 2880 H RR ( k W) 0 1000 2000 3000 4000 5000 Oxygen c oncent rat ion (% V ol) 18.0 18.5 19.0 19.5 20.0 20.5 21.0 21.5 HRR (kW) O2 (% Vol)
Figure 16. Oxygen concentration in the calorimeter’s exhaust stream at various HRRs.
The associated lag of the HRR measurements was not determined at this stage. It is known that there is a lag in HRR measurements taken with any calorimeter due to the time it takes for the combustion gases to reach the sampling point (calorimeter lag) and, subsequently, to the gas analyzers (analyzer lag). Hence, the HRR measurements essentially lag behind other fast-response measurements, such as temperature and heat flux, by a certain time period. Bryant et al. [14] conducted a detailed uncertainty analysis for a 3,000 kW calorimeter and estimated the calorimeter and oxygen analyzer lags to in the order of 25s and 9s, respectively, giving a total lag of about 34s.
16 4.2 Propane Tests with Three Different Window Openings
Although multiple openings were considered in the computer simulations, it was not practical to design a test facility that would be able to collect all of the smoke from multiple openings for heat release measurements, particularly when the openings are located in opposite walls. Therefore, only one window opening was considered in the final design of the CFMRD test room. Table 7 lists the three window opening sizes, which were selected for the experiments using propane fires. The maximum size of the window opening, W3 (1.5 m x 1.5 m), was selected partly because it was closer to the mean size, W2, of window sizes found in the survey and was expected to result in fires sizes that the calorimeter could handle without the fire effluent overflowing the hood. The three window opening sizes were to be evaluated primarily on the basis of room temperature as a measure of fire intensity.
Table 7. Sizes of window openings used in the propane tests Test no. Window
opening label
Window opening dimensions ( W x H)*
FDS Scenario Theoretical Peak HRR (kW)
P1 W1 1.0 m x 1.0 m SC10 1,700
P2 W2 1.4 m x 1.2 m SC11 2,800
P3 W3 1.5 m x 1.5 m SC2 4,100
*The soffit was maintained at a height of 2 m in all of the experiments. 4.2.1 Test Setup and Instrumentation
The rough opening in the south wall of the test room was fitted with a 2 m x 2 m panel with the desired window opening size and the propane burner system was placed in the room (on the floor) as show in Figure 17. The panel was constructed with the same materials (cement boards and steel studs) and a wall thickness consistent with the rest of the test room. Regular 12.7 mm gypsum board was used for the first ceiling layer, which was exposed to the fire. The burner system consisted of an array of 16 individual burners that were evenly placed in two rows that were spaced 1.3 m apart. Propane was fed to burners through a single pipe and manifold arrangement and combustion air was drawn through the window opening by natural aspiration. At this stage the test room was not fully instrumented. The following instrumentation was omitted: 1) load cell; 2) velocity probes in the windows (along with their accompanying TCs); 3) heat flux gauge at floor level; 4) smoke obscuration meter (in the exhaust duct); 5) gas analysis in the room at 0.5 m and 1.5 m. However, each window opening was instrumented with nine
17 evenly distributed TCs as shown in Figure 11 in Section 3.1.
Figure 17. Positioning of the propane burner system before Test P1 (viewed through the service door)
4.2.2 Test Procedure
With the burners lit, each test was started by rapidly increasing (manually) the flow rate of propane to achieve a target HRR as shown in Table 8 (steps 1, 2, 3 or 4). Once the target HRR was achieved, the dwell time at each step was kept to about 120s before the next step increase. The dwell time at the last step increase was usually limited to 60s or the propane flow turned off completely if visual observations indicated there was insufficient airflow through the window opening to support efficient combustion of the propane fuel (characterized by darkening flames in the room with excessive flames issuing out of the window opening, in some cases).
18 Table 8. Sizes of propane fires and HRR increments used during the tests.
Window opening Target propane HRR (kW) and duration at each setting
Test No. Test
Duration (s)
Step 1 Step 2 Step 3 Step 4
P1 W1 ( 1.0 m x 1.0 m) ~ 300 1,500 (120s)* 2,500 (120s) N/A N/A P2 W2 (1.4 m x 1.2 m) ~ 400 1,500 (120s) 3,000 (120s) 4,000 (60s) N/A P3 W3 (1.5 m x 1.5 m) ~ 600 1,500 (120s) 3,000 (120s) 4,000 (120s) 4,500 (60s) N/A – Not tested since severely vitiated combustion conditions were either anticipated or observed. * Time in brackets indicates the approximate duration of each HRR setting
4.2.3 Results and Discussion
4.2.3.1 Heat Release Rate Time Lag
Since the lag in HRR measurements was unknown at the start of the experiments, the results of the propane tests were initially used to estimate the lag. The difference in the response times of the oxygen and carbon dioxide analyzers, which are the key measurements used in calculating the HRR [8], was assessed by plotting the measured values on the same graph as shown in Figures 18 and 19 for Tests P2 and P3, respectively. The vertical lines marked L1 to L4 indicate the transition times between different target HRR settings. L1 corresponds to the time the first target HRR was achieved. L2 indicates the start of the next HRR increment, and so on. The final vertical line (L3 for Test P2 and L4 for test P3) marks the time the propane burner was turned off. As CO2 is one of the main products of combustion that accounts for the O2 consumed, an inverse relationship between the two gases is to be expected; that is, the
concentration of CO2 in the exhaust stream should increase proportionately to the reduction of O2. Both Figures 18 and 19 do not show any indication of there being a lag between the response times of the two gas analyzers. Therefore, the lag between the analyzers was considered to be negligible in the current test setup.
The overall HRR time lag was estimated by using measurements from heat flux gauges as a reference since heat flux gauges have fast response times in the order of 1 s to 2 s, which were reported for Schmidt-Boelter type [14].
19 Time (s) 0 120 240 360 480 600 O2 (% vol) 19.0 19.5 20.0 20.5 21.0 CO 2 (% V ol) 0.0 0.2 0.4 0.6 0.8 1.0 1.2 1.4 O2 (% vol) CO2 (% vol) L1 L2 L3 Time (s) 0 120 240 360 480 600 720 840 O2 (% vol) 19.0 19.5 20.0 20.5 21.0 CO 2 (% V ol) 0.0 0.2 0.4 0.6 0.8 1.0 1.2 1.4 O2 (% vol) CO2 (% vol) L1 L2 L3 L4
Figure 18. O2 and CO2 gas concentrations at the sampling point in the exhaust duct during test P2
Figure 19. O2 and CO2 gas concentrations at the sampling point in the exhaust duct during test P3 Figure 20 shows the time delay of the HRR profile in Test P2 compared with the profiles from five heat flux gauges that were installed in the test room before any correction was made. It was found that a time delay of about 30 s was required to bring the HRR profile in alignment with the heat flux profiles as shown in Figure 21 where the correction has been applied to the HRR time base. The same time delay was found to be applicable to the results of Test P3 as shown in Figures 22 and 23, before and after the correction, respectively. Figures 24 and 25 compare the temperature and heat flux responses at the location of the heat flux gauge on the west wall. The temperature response of the surface-mounted TC at that location was consistent with the heat flux response. This supports the use of either heat flux or temperature response as a means of estimating the HRR time lag.
Time (s) 0 200 400 600 800 1000 1200 H e at R e lease R a te ( k W ) 0 1000 2000 3000 4000 5000 H eat fl ux ( k W /m 2) 0 20 40 60 80 100 120 HRR
Heat flux (north wall) Heat flux (south wall) Heat flux (west wall) Heat flux (ceiling SW) Heat flux (ceiling NE)
Time (s) 0 200 400 600 800 1000 1200 H e at R e le a s e R a te ( k W ) 0 1000 2000 3000 4000 5000 H e at f lux ( k W /m 2) 0 20 40 60 80 100 120 HRR
Heat flux (north wall) Heat flux (south wall) Heat flux (west wall) Heat flux (ceiling SW) Heat flux (ceiling NE)
Figure 20. HRR time lag for Test P2 Figure 21. Alignment of HRR and heat flux
profiles after incorporating a 30 s HRR time lag for Test P2
20 Figure 22. HRR time lag for Test P3 Figure 23. Alignment of HRR and heat flux
profiles after incorporating a 30s HRR time lag for Test P3 Time (s) 0 240 480 720 960 1200 T em per atur e ( oC) 0 200 400 600 800 1000 H e at f lux ( k W /m 2) 0 20 40 60 80 100 120 Temperature Heat flux Time (s) 0 240 480 720 960 1200 T em per atur e ( oC) 0 200 400 600 800 1000 H e at f lux ( k W /m 2) 0 20 40 60 80 100 120 140 160 Temperature Heat flux
Figure 24. Test P2: Wall temperature and heat flux profiles at the location of the heat flux gauge (XTC-H) on the west wall
Figure 25. Test P3: Wall temperature and heat flux profiles at the location of the heat flux gauge (XTC-H) on the west wall
4.2.3.2 HRR and Temperature Profiles
Figure 26 shows the HRR profiles for the three tests measured using the calorimeter and the corresponding average maximum temperature profile are shown in Figure 27. Specific maximum temperatures measured by the TC trees in the four quadrants of the room are given in Table 9. The results show that Test P3, using the largest window opening size (W3 – 1.5 m x 1.5 m), clearly produced the highest temperatures with values exceeding 1,000oC in the southern section of the room where the opening was located.
Time (s) 0 200 400 600 800 1000 1200 He at Re lease Rate (kW ) 0 1000 2000 3000 4000 5000 He at flux (kW /m 2) 0 20 40 60 80 100 120 140 160 180 HRR Heat flux (north wall) Heat flux (south wall) Heat flux (west wall) Heat flux (ceiling SW) Heat flux (ceiling NE)
Time (s) 0 200 400 600 800 1000 1200 He at Re lease Rate (kW ) 0 1000 2000 3000 4000 5000 He at flux (kW /m 2) 0 20 40 60 80 100 120 140 160 180 HRR Heat flux (north wall) Heat flux (south wall) Heat flux (west wall) Heat flux (ceiling SW) Heat flux (ceiling NE)
21 Time (s) 0 120 240 360 480 600 720 840 960 H eat R e lease Ra te (kW ) 0 1000 2000 3000 4000 5000 P1 P2 P3
Figure 26. Measured HRRs for tests P1, P2 and P3
Time (s) 0 120 240 360 480 600 720 840 960 Te mp erat ure ( o C) 0 200 400 600 800 1000 P1 P2 P3
22 Table 9. Peak HRR and maximum temperatures measured by the TC trees for each test. Test No. Window
opening
Test Duration
Peak HRR (kW)
Peak temperature in each quadrant
SW SE NW NE
P1 W1 ~ 300 2,581 671 785 553 608
P2 W2 ~ 400 4,446 912 992 941 883
P3 W3 ~ 600 4,732 1,043 1,090 901 926
Figures 28 and 29 and show the average temperature variations across the height of the room for Tests P2 and P3, respectively. Both graphs show a narrowing temperature difference between the highest (2.38 m) and lowest (0.4 m) measurement points. The maximum average temperature for the TCs located at 0.4 m (lowest point) was 810oC in the case of Test P3, whereas the corresponding maximum temperature was only 680oC in test P2.
Time (s) 0 120 240 360 480 600 720 840 960 T em p er at ur e ( oC) 0 200 400 600 800 1000 2.4 m 1.9 m 1.4 m 0.9 m 0.4 m
Figure 28. Temperature stratification in Test P2 (average of four TC trees)
Time (s) 0 120 240 360 480 600 720 840 960 T em per a tur e ( oC) 0 200 400 600 800 1000 2.4 m 1.9 m 1.4 m 0.9 m 0.4 m
Figure 29. Temperature stratification in Test P3 (average of four TC trees)
Table 10 summarizes the observations made regarding the passage of flames out of the window opening. In all of the experiments there were no flames issuing out of the window opening at the target HRR setting of 1,500 kW. In test P1, flames began issuing out of the window opening when the target HRR setting was increased to 2,500 kW. However, the resulting combustion environment appeared to have been oxygen vitiated and the flames became less luminous with a further increase in the propane flow rates as shown by the photographs in Figure 31.
23 Figure 30 shows that during this period, the temperatures in the room began to decline despite an increased HRR that was measured by the calorimeter indicating diminishing combustion efficiency in the fuel-rich environment and increased combustion outside of the room where there was an abundance of oxygen. Likewise, Figure 32 and Figure 34 show the heat release rate and temperature profiles for Tests P2 and P3, respectively. The photographs of the flames inside the room are shown in Figure 33 and Figure 35. Test P2 exhibited a slight decrease in room temperatures when the propane flow rate was increased to a HRR setting of 4,000 kW as the combustion environment became oxygen vitiated. In Test P3, there were no signs of oxygen vitiation and its associated temperature decrease; room temperatures increased gradually as the propane flow rate was increased to 4,500 kW and until the test was terminated.
Table 10. Observation of flames issuing out of the window-opening at each target HRR setting Test No. Window
opening
Test Duration (s)
Flames issuing out of the window opening?
1,500 kW 2,500 kW 3,000 kW 4,000 kW 4,500 kW
P1 W1 ~ 300 NO Yes N/A N/A N/A
P2 W2 ~ 400 NO N/A Yes Yes N/A
P3 W3 ~ 600 NO N/A Yes Yes Yes
Time (s) 0 120 240 360 480 600 720 840 960 H e a t Re le as e Ra te ( k W ) 0 500 1000 1500 2000 2500 3000 Te m p er a tur e ( o C) 0 200 400 600 800 1000 P1 - HRR P1 - Avg temp
24
(a) 1,000 kW to 1,500 kW (b) 1,500 kW (c) 2, 000 kW
Figure 31. Test P1 - Photographs of the propane flames at target HRRs of 1,000 kW, 1,500 kW and 2, 000 kW
Time (s)
0 120 240 360 480 600 720 840 960Heat
Releas
e
Rat
e (kW)
0 1000 2000 3000 4000 5000T
e
m
perature (
o
C)
0 200 400 600 800 1000 P2 - HRR P2 - Avg temp25
(a) 1,500 kW (b) 3,000 kW (c) 4, 000 kW
Figure 33. Test P2 - Photographs of the propane flames at target HRRs of 1,500 kW, 3,000 kW and 4, 000 kW
Time (s)
0 120 240 360 480 600 720 840 960Heat
Rel
e
as
e
Rat
e
(k
W)
0 1000 2000 3000 4000 5000Tempe
rat
ure
(
o
C)
0 200 400 600 800 1000 P3 - HRR P3 - Avg temp26
(a) 3,000 kW (b) 4,000 kW () 4, 500 kW
Figure 35. Test P3 - Photographs of the propane flames at target HRRs of 3,000 kW, 4,000 kW and 4,500 kW
4.2.3.3 Selected Size of the Window Opening
Based on the results of the propane tests the window opening size W3 (1.5 m x 1.5 m), which was used in Test P3, was chosen to be used in future tests since it resulted in the most severe temperature conditions in the test room. An additional benefit of using window opening W3 is that it supported the highest HRR in the test room without showing signs of oxygen vitiation, which is desirable for the planned experiments.
4.3 Commissioning of the Test Facility (Test C1)
The test facility was commissioned by conducting a test with a fuel package consisting of a mock-up sofa and two wood cribs, which was identical to the fire source assumed in the fire simulations, in an effort to provide experimental data for verification of the FDS model. The mock-up sofa was constructed with six blocks of flexible polyurethane foam (PUF) placed on a metal frame, with each block measuring 610 mm long x 610 mm wide and 100 mm or 150 mm thick. The total mass of PUF was 9.34 kg and its density was about 32.8 kg/m3 The 150 mm thick foam blocks were used for the backrest and the 100 mm thick foam blocks for the seat cushions. The wood cribs were made with spruce lumber pieces, each measuring 38 mm x 89 mm x 800 mm and had a total mass of 47.5 kg. The lumber pieces were evenly spaced in rows of six and stacked to a height of 356 mm. The ambient temperature (in the burn hall) on the day of the test was around 2oC.
The first ceiling layer of 12.7 mm regular gypsum board was replaced with a 15.9 mm Type-X gypsum board to improve the fire resistance of the ceiling. Therefore, the ceiling was now composed of two layers of 15.9 mm Type-X gypsum board.
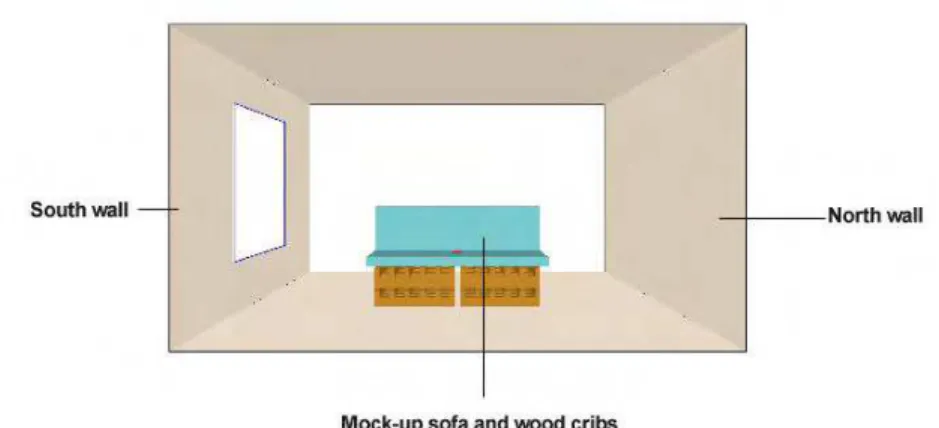
27 Figure 36. Illustration of the layout of the fuel
package in the test room
Figure 37. Fire experiment in progress in the test room with window opening W3
4.3.1 Instrumentation
The test room was instrumented as described in Section 3.1 “Instrumentation” except that the following instrumentation was not installed: 1) Load cell; 2) Bi-directional velocity probes in the window opening and the four adjacent TCs; and 3) Smoke meter in the calorimeter’s exhaust duct.
The external heat flux gauges were positioned at a distance of 2.44 m from the horizontal centerline of window opening.
4.3.2 Test Procedure
The fuel package was centrally located in the test room and ignited with a 250 mm by 250 mm square burner with a propane flow rate of 13 L/min (HRR of about 19 kW) for 80 s, positioned on the south-side seat cushion in accordance with the ASTM 1537 test protocol [15]. The data acquisition system was started 60 s before ignition in order to collect background reference data. The data acquisition rate was set at 2 s intervals throughout the test.
4.3.3 Results
Figure 38 shows a graph of the measured HRR versus time. The peak HRR of 3,120 kW occurred at 214 s from ignition. After ignition, the fire developed at a fast rate, comparable to a fast-t2 fire growth curve[16], as shown in Figure 39. After 90 s the fire growth increased
dramatically to align with an ultra-fast t2 fire growth curve likely due to an increase in the burning area due to the combined effect of the formation of a pool fire (by the dripping PUF) and ignition of the wood crib that was located under the left side of the mock-up sofa. Table 11 summarizes some observations about the fire events based on video records.
28 Following attainment of the peak HRR value, there was a rapid decay as much of the
polyurethane foam had been consumed. This was followed by a period of fairly steady
combustion of the wood cribs (lasting about 200 s) during which the HRR was around 900 kW.
Time (s)
0 240 480 720 960 1200 1440 1680 1920 2160 2400Heat
Rel
e
as
e R
a
te (k
W)
0 500 1000 1500 2000 2500 3000 3500 4000Figure 38. Heat release rate versus time profile for Test C1
Time (s) 0 30 60 90 120 150 180 210 240 270 300 Heat R e le ase Rat e ( k W) 0 500 1000 1500 2000 2500 3000 3500 4000 Ultra-fast t2 fire Fast t2 fire Test C1
29 Table 11. Test log during Test C1.
Time [min:sec]
Fire events
0:00 Ignition
0:30 Left hand side backrest cushion covered with flames, flame height ~ 900 mm 0:40 Molten PUF began dripping at a fast rate from the interface of the seat and back 1:20 Left hand side cushion completely covered with flames with large pool fire
developing beneath; only half of the left hand side crib is burning.
1:45 First signs of flames issuing out of the window opening (initially intermittent and then became more continuous).
2:10 More vigorous burning of the wood cribs; smoke layer descended to below half of the room height.
3:20 More extensive flame extension out of the window opening; Mock-up sofa appear completely consumed shortly afterwards leading to a fire fuelled by the wood cribs.
3:50 Flames ceased to extend out of the window opening
4:10 Steady burning of wood cribs, supplemented by a PUF pool fire. 13:00 Slowly decaying fire
31:00 Flames ceased and only smouldering embers remained.
Figure 40 shows the average temperature profiles of the four TC trees that were located at the quarter points of the floor area. Figures 41 to Figure 44 show the temperatures measured by each of the four TC trees. TCs located at 2.38 m and 1.9 m recorded an average maximum temperature of about 800oC, and that of the TC located at 0.4 m reach peaked of about 450oC. The temperature profiles for the TC tree that was installed in a corner location are shown in Figure 45 and the temperature values are lower than those recorded by the other four TC trees, which is likely due to the limited movement of gases in the corner section. Flashover likely occurred at around 145s from ignition, which is the time when flames started issuing out of the window opening. The HRR at this time was about 2,200 kW, the heat flux at the floor level was 22 kW/m2 and the average temperatures at 2.38 m and 1.9 m were 686oC and 638oC,
respectively. Figure 40 also shows the temperature profile for the shielded ATSM E119 TC. There is a substantial time lag in the temperature measured by this type of TC due to its slow time response time and the thermal inertia of the metal casing, especially during the
30 first 300 s. This is also reflected by its slow decay response since the hot metal casing continues to transfer heat (by radiation and convection) to the TC junction (bead), resulting in higher temperature measurement than the room environment.
Time (s)
0 240 480 720 960 1200 1440 1680 1920 2160 2400Mean T
emper
ature
(o
C)
0 200 400 600 800 1000 ASTM E119 TC (2.1m) 2.4 m 1.9 m 1.4 m 0.9 m 0.4 mFigure 40. Average temperate versus time profiles measured by the four TC trees and the ASTM E119 TC
Theoretically, flashover would be expected to occur at a HRR of about 1,700 kW [17], which value was achieved at about 120 s from ignition. However, there was no sign of flames issuing out of the window at this time, although the average temperature at 1.9 m height was 602oC. Heat flux profiles at various locations in the test room are shown in Figure 46 and Table 12 gives the peak values recorded by each heat flux gauge.
31 Time (s) 0 240 480 720 960 1200 1440 1680 1920 2160 2400 T e mp er at u re (ºC ) 0 200 400 600 800 1000 2.4 m 1.9 m 1.4 m 0.9 m 0.4 m
Figure 41. SE TC tree (peak temperature 830oC)
Time (s) 0 240 480 720 960 1200 1440 1680 1920 2160 2400 T e mp er atur e ( ºC) 0 200 400 600 800 1000 2.4 m 1.9 m 1.4 m 0.9 m 0.4 m
Figure 42. SW TC tree (peak temperature 852oC)
Time (s) 0 240 480 720 960 1200 1440 1680 1920 2160 2400 T em per atur e ( ºC ) 0 200 400 600 800 1000 2.4 m 1.9 m 1.4 m 0.9 m 0.4 m
Figure 43. NE TC tree (peak temperature 797oC)
Time (s) 0 500 1000 1500 2000 2500 T e m per atur e ( ºC) 0 200 400 600 800 1000 2.4 m 1.9 m 1.4 m 0.9 m 0.4 m
Figure 44. NW TC tree (peak temperature 765oC)
Time (s) 0 240 480 720 960 1200 1440 1680 1920 2160 2400 T em per atur e ( ºC ) 0 200 400 600 800 1000 2.4 m 1.9 m 1.4 m 0.9 m 0.4 m
Figure 45. Temperature profile recorded by the corner TC tree Col 163 vs Col 170 Time (s) 0 240 480 720 960 1200 1440 1680 1920 2160 2400 He at f lux (k W /m 2 ) 0 20 40 60 80 100 Floor North wall South wall West wall East wall Ceiling SW Ceiling NE
Figure 46. Heat flux readings in the test room Table 12. Peak heat flux values
32 Peak Heat Flux (kW/m2)
Floor Walls Ceiling External*
N S W E SW NE Ext 1 Ext 2
31.3 52.5 71.5 85.3 92.7 76.4 57.6 33.2 6.5 *Ext 1: Upper gauge; Ext 2: Lower gauge
4.3.4 Temperature Profiles of Cross-Sections of the Walls and Ceiling
Figures 47 to 51 show the graphs of temperature changes and transient effects between various surfaces across the walls and ceiling. Table 13 lists the notations used for various surfaces in accordance with the TC installation detailed in Table 4. The results shown in Figures 47 to 51 are average values at all TC locations corresponding to a specific section and do not necessarily indicate the condition of the entire surface, particularly for the walls. However, the results show important heat transfer trends across the various sections and can be useful in estimating heat transfer parameters.
Table 13. Numbering of TCs installed at wall and ceiling cross-sections.
TC No.
Surface 0 1 2 3 4
Walls N/a Internal Cavity Cavity External
Ceiling Internal Between two layers of gypsum board Cavity (ceiling side) Cavity (roof side) External (roof)
The results for the ceiling / roof are more representative of the entire section since the TC probes were installed symmetrically. The external surface of roof experienced the lowest
temperature rise (maximum of 27 K) in comparison to the surfaces on the north, south, west and east walls, which had values of 45 K, 77 K, 47 K and 68 K, respectively. These results show that the walls accounted for a larger proportion of the heat losses due to conduction through the walls. This is largely because the total thickness of the ceiling (two layers of gypsum board) was more than twice that of the inner wall sheathing (one layer of cement board). In addition, the
33 cement board wall had already had most of its moisture driven out during previous propane tests, whereas the interior ceiling layer was freshly lined for the test.
Time (s) 0 240 480 720 960 1200 1440 1680 1920 2160 2400 Δ T (K) 0 200 400 600 800 1000 ΔT 0-1 ΔT 1-2 ΔT 0-4 ΔT ceiling surface Ceiling Heat Transfer
Figure 47. Mean temperature differences across the ceiling / roof section
Time (s) 0 240 480 720 960 1200 1440 1680 1920 2160 2400 Δ T (K) 0 200 400 600 800 1000 ΔT 1-2 ΔT 2-3 ΔT 1-4 ΔT outside surface South Wall Heat Transfer
Figure 48. Mean temperature differences across the south wall
Time (s) 0 240 480 720 960 1200 1440 1680 1920 2160 2400 Δ T ( K ) 0 200 400 600 800 1000 ΔT 1-2 ΔT 2-3 ΔT 1-4 ΔT outside surface North Wall Heat Transfer
Figure 49. Mean temperature differences across the north wall Time (s) 0 240 480 720 960 1200 1440 1680 1920 2160 2400 Δ T (K ) 0 200 400 600 800 1000 ΔT 1-2 ΔT 2-3 ΔT 1-4 ΔT outside surface West Wall Heat Transfer
Figure 50. Mean temperature differences across the west wall
34 Time (s) 0 240 480 720 960 1200 1440 1680 1920 2160 2400 Δ T (K) 0 200 400 600 800 1000 ΔT 1-2 ΔT 2-3 ΔT 1-4 ΔT outside surface East Wall Heat Transfer
Figure 51. Mean temperature differences across the east wall
Figure 52 shows the temperatures measured by the nine TCs that were installed in the window opening. The direction of flow, whether in-flow or out-flow, can be inferred by assessing the temperature levels. Higher temperatures are indicative of out-flow of combustion gases whereas lower temperatures indicate in-flow of ambient air.
Time (S) 0 240 480 720 960 1200 1440 1680 1920 2160 2400 Tem per at ur e ( o C) 0 100 200 300 400 500 600 700 Top left Top Center Top right Center left Center Center right Bottom left Bottom center Bottom right
Figure 52. Temperature measurements in the window opening plane
Figure 53 shows the O2 and CO2 concentrations in the room at two different heights (0.5 m and 1.5 m). The results show a severe depletion of O2 at a height of 1.5 m and a reciprocal increase in CO2 concentration to almost 17% by volume near the time the peak HRR occurred. There was little oxygen depletion at a height of 0.5 m, which indicated that the hot layer of combustion gases did not descend to this level. Figure 54 shows the concentration of CO at both
35 heights. There is a sharp spike in the concentration of CO at the height of 1.5 m, corresponding with the rapid decline in O2 concentration, which is attributed to incomplete combustion under low oxygen conditions.
Time (s) 0 240 480 720 960 1200 1440 1680 1920 2160 2400 O2 C oncen tr ati o n s ( % V o l) 0 5 10 15 20 25 CO 2 C once n tr at io ns ( % Vo l) 0 2 4 6 8 10 12 14 16 18 20 O2 @ 1.5 m O2 @ 0.5 m CO2 @ 1.5 m CO2 @ 0.5 m
Figure 53. O2 and CO2 concentrations in the room
Time (s) 0 240 480 720 960 1200 1440 1680 1920 2160 2400 O2 C oncen tr ati o n s ( % V o l) 0 5 10 15 20 25 C O Co nc en tr a ti o n s (% V o l) 0.0 0.1 0.2 0.3 0.4 0.5 0.6 0.7 O2 @ 1.5 m O2 @ 0.5 m CO @ 1.5 m CO @ 0.5 m
36
5 Conclusion
A test facility consisting of a heat release rate calorimeter and a 4.2 m deep x 3.8 m wide x 2.38 m high test room simulating a residential bedroom was designed and constructed for conducting fire experiments of short duration with single or limited quantities of combustible residential furnishings and other contents of interest in the Characterization of Fires in Multi-Suite Residential Dwellings (CFMRD) project. The calorimeter was calibrated with a propane burner that produced a maximum fire size of about 4,500 kW, based on the flow rate and heating value of propane. The results of experiments with propane fires using three different sizes of window openings indicated that W3, a 1.5 m x 1.5 m opening, which was the largest window opening tested, was suitable for this phase of the project since it supported the highest measured heat release rate of about 4,700 kW and resulted in the most severe temperature conditions in the test room. Peak temperatures of 1,050oC and 1,090oC were reached in two sections of the test room, whereas the temperature did not exceed 1,000oC in the tests with smaller window opening sizes, W1 and W2, measuring 1.0 m x 1.0 m and 1.42 m x 1.2 m, respectively.
The test facility was commissioned by conducting a fire experiment with a fuel package consisting of a mock-up sofa and some wood cribs. The peak heat release rate and
temperature measured during the experiment were 3,120 kW (214 s after ignition) and 852oC for the resulting flashover fire. Numerous temperature and heat flux measurements were taken at various locations for evaluating heat transmission across the room boundaries.
6 Acknowledgments
The authors are very grateful to all of the staff at the NRC-IRC Fire Research Program who contributed to the accomplishment of this work by either providing valuable technical assistance or advice.
7 References
1. Bwalya, A., Lougheed, G., Kashef, A. and Saber, H., 2008, "Survey Results of
Combustible Contents and Floor Areas in Canadian Multi-Family Dwellings", Institute for
Research in Construction, National Research Council Canada, Research Report, IRC-RR-253, Ottawa, Canada.
2. Saber, H., Kashef, A., Bwalya, A., Lougheed, G., and Sultan, M. A., 2008, "A Numerical Study on the Effect of Ventilation on Fire Development in a Medium-Sized Residential Room ", Institute for Research in Construction, National Research Council Canada, Research Report, IRC-RR-241, 12, Ottawa, Canada.
37 3. McGrattan, K., Baum, H., Rehm, R., Hostikka, S., and Floyd, J., “Fire Dynamics Simulator
(Version 5) Technical Reference Guide”, NIST Special Publication 1018-5, October 2007. 4. Saber, H. H., Kashef, A., Bwalya, A., and Lougheed, G. D., 2008, "Analyses of
Post-Flashover Fires in a Medium-Sized Residential Room Under Different Ventilation Conditions", Institute for Research in Construction, National Research Council Canada,
Research Report, IRC-RR-264, Ottawa, Canada.
5. Saber, H., Kashef, A., and Bwalya, A., 2008, "Post-Flashover Compartment Fire For Different Fire Ventilation Settings In A Medium-Sized Residential Room", 2008 ASME International Mechanical Engineering Congress and Exposition - Proceedings of IMECE2008, November 2-6, ASME.
6. Bwalya, A., Carpenter, D., Kanabus-Kaminska, M., Lougheed, G., Su, J., Taber, B., Benichou, N., Kashef, A., McCartney, C., Bounagui, A., and Thomas, R., 2006, "Development of a Fuel Package for use in the Fire Performance of Houses Project", National Research Council Canada, Institute for Research in Construction, Research Report, IRC-RR-207 , Ottawa, Canada.
7. Taber, B., Bwalya, A., McCartney, C., Bénichou, N. , Bounagui, A., Carpenter, D., Crampton, G., Kanabus-Kaminska, J., Kashef, A., Leroux, P., Lougheed, G., Su, J., and Thomas, R., 2006, "Fire Scenario Tests in Fire Performance of Houses Test Facility - Data Compilation", National Research Council Canada, Institute for Research in Construction, Research Report IRC-RR-208, Ottawa, Canada.
8. Janssen, M., 1991, "Measuring Rate of Heat Release by Oxygen Consumption", Fire Technology, Vol. 27, p.234-249.
9. Crampton, G. and Lougheed, G., 2004, "Comparison Of Smoke Measurements With Standard And Nonstandard Systems", National Research Council Canada, Institute for Research in Construction, Research Report # 183, November, Ottawa, Canada. 10. American Society for Testing and Materials, 2000, " ASTM E119-00a: Standard Test
Method for Fire Tests of Building Construction and Materials", ASTM International, West Conshohocken, PA, USA.
11. CAN/ULC-S101-M89, 1989, "Standard Methods of Fire Endurance Tests of Building Construction and Materials", Canadian General Standards Board, Ottawa, Ontario, Canada.
12. McCaffrey, B. J. and Heskestad, G., 1976, "A Robust Bidirectional Low-Velocity Probe for Flame and Fire Application", Combustion And Flame, Vol.26, p.125-127.
38 13. Society of Fire Protection Engineers, 2000, "The SFPE Engineering Guide to
Performance-Based Fire Protection Analysis and Design of Buildings", National Fire Protection Association, Quincy, MA, USA.
14. Bryant, Rodney A., Ohlemiller, Thomas J., Johnsson, Erik L., Hamins, Anthony, Grove, Brian S., Guthrie, William F., Maranghides, A., and Mulholland, George W., 2003, "The NIST 3 Megawatt Quantitative Heat Release Rate Facility", NIST Special Publication 1007, National Institute of Standards and Technology, U.S. Department of Commerce, USA. 15. American Society for Testing and Materials, 2002, "ASTM E1537-02a: Standard Test
Method for Fire Testing of Upholstered Furniture", ASTM International, West Conshohocken, PA, USA.
16. National Fire Protection Association, 2000, "NFPA 92B: Smoke Management Systems in Malls, Atria, and Large Areas", Quincy, MA, USA.
17. Scot Deal, 1995, "Technical Reference Guide for FPEtool Version 3.2", NISTIR 5486, National Institute of Standards and Technology, U.S. Department of Commerce, USA. 18. Karlsson, Bjorn and Quintiere, James G., 2000, Enclosure Fire Dynamics, CRC Press,