Publisher’s version / Version de l'éditeur:
Soil Science and Society of American Journal, 73, 5, pp. 1479-1487, 2009-09
READ THESE TERMS AND CONDITIONS CAREFULLY BEFORE USING THIS WEBSITE. https://nrc-publications.canada.ca/eng/copyright
Vous avez des questions? Nous pouvons vous aider. Pour communiquer directement avec un auteur, consultez la première page de la revue dans laquelle son article a été publié afin de trouver ses coordonnées. Si vous n’arrivez pas à les repérer, communiquez avec nous à PublicationsArchive-ArchivesPublications@nrc-cnrc.gc.ca.
Questions? Contact the NRC Publications Archive team at
PublicationsArchive-ArchivesPublications@nrc-cnrc.gc.ca. If you wish to email the authors directly, please see the first page of the publication for their contact information.
NRC Publications Archive
Archives des publications du CNRC
This publication could be one of several versions: author’s original, accepted manuscript or the publisher’s version. / La version de cette publication peut être l’une des suivantes : la version prépublication de l’auteur, la version acceptée du manuscrit ou la version de l’éditeur.
For the publisher’s version, please access the DOI link below./ Pour consulter la version de l’éditeur, utilisez le lien DOI ci-dessous.
https://doi.org/10.2136/sssaj2008.0161
Access and use of this website and the material on it are subject to the Terms and Conditions set forth at
Diversity and dynamics of methanotrophs within an experimental
landfill cover soil
Jugnia, Louis-B.; Aït-Benichou, Samah; Fortin, Nathalie; Cabral, Alexandre
R.; Greer, Charles W.
https://publications-cnrc.canada.ca/fra/droits
L’accès à ce site Web et l’utilisation de son contenu sont assujettis aux conditions présentées dans le site LISEZ CES CONDITIONS ATTENTIVEMENT AVANT D’UTILISER CE SITE WEB.
NRC Publications Record / Notice d'Archives des publications de CNRC:
https://nrc-publications.canada.ca/eng/view/object/?id=8ee63802-417e-4db8-b995-f6dffa5ba3f1 https://publications-cnrc.canada.ca/fra/voir/objet/?id=8ee63802-417e-4db8-b995-f6dffa5ba3f1Soil Sci. Soc. Am. J. 73:1479-1487 doi:10.2136/sssaj2008.0161 Received 9 May 2008.
*Corresponding author (louis.jugnia@cnrc-nrc.gc.ca). © Soil Science Society of America
677 S. Segoe Rd. Madison WI 53711 USA
All rights reserved. No part of this periodical may be reproduced or transmitted in any form or by any means, electronic or mechanical, including photocopying, recording, or any information storage and retrieval system, without permission in writing from the publisher. Permission for printing and for reprinting the material contained herein has been obtained by the publisher.
M
ethane (CH4) is a potent greenhouse gas. It absorbs infra-red radiation more ef ectively than CO2 and has a global warming potential 25 times higher than that of CO2 (IPCC, 2007). Methane is the product of the anaerobic degradation of organic matter by methanogenic Archeae (Zinder, 1993). In the presence of oxygen, a substantial part of the CH4 produced can be oxidized by methane-oxidizing bacteria (methanotrophs). Carbon can thus be retained in the system as biomass or emitted as CO2 (Roslev et al., 1997).Among the in situ sources of CH4 contributing to the at-mospheric CH4 budget, emissions from landi lls may represent
as much as 17% (Wuebbles and Hayhoe, 2002) of the about 70% of CH4 emissions due to human activities (IPCC, 2007). h erefore, management practices that could help in reducing emissions from landi lls are of great importance in connection with the atmospheric CH4 budget. To date, gas extraction sys-tems have been the principal means of reducing CH4 emissions from landi lls. However, the high cost associated with this tech-nical approach renders it feasible only for landi ll sites in the de-veloped world. Even in sites equipped with gas collection systems, signii cant amounts of CH4 can still escape as fugitive emissions (Börjesson et al., 2007; Spokas et al., 2006).
It has been shown that when a landi ll site is full and capped with soil, vertical migration brings the gas from the anaerobic region of the landi ll, where it is formed, into an aerobic envi-ronment near the surface, where it may be subjected to micro-biological oxidation by methanotrophs (Humer and Lechner, 2001; Jones and Nedwell, 1993; Whalen et al., 1990). Methane oxidation by methanotrophs is catalyzed by methane monooxy-genase (MMO), an enzyme that may be either membrane bound, ‘‘particulate’’ MMO (pMMO) or cytoplasmic, ‘‘soluble’’ MMO (sMMO) (Hanson and Hanson, 1996). h e sMMO is restricted to Type II methanotrophs (Methylocystis and Methylosinus) and some Type I representatives from the Methylomonas and
Louis-B. Jugnia*
National Research Council Biotechnology Research Institute 6100 Royalmount Ave. Montreal, QC Canada H4P 2R2Samah Aït-Benichou
Dep. of Civil Engineering Université de Sherbrooke 2500, boul. de l’Université Sherbrooke, QC, Canada J1K 2R1Nathalie Fortin
National Research Council Biotechnology Research Institute 6100 Royalmount Ave. Montreal, QC Canada H4P 2R2
Alexandre R. Cabral
Dep. of Civil Engineering Université de Sherbrooke 2500, boul. de l’Université Sherbrooke, QC, Canada J1K 2R1Charles W. Greer
National Research Council Biotechnology Research Institute 6100 Royalmount Ave. Montreal, QC Canada H4P 2R2SOIL BIOLOGY & BIOCHEMISTR
Y
Diversity and Dynamics of Methanotrophs
within an Experimental Landfi ll Cover Soil
h ree experimental biocovers were installed during the summer of 2006 at the St-Nicéphore landi ll in Québec (Canada). h e main objectives of the experimental program were
to assess the ei ciency of these biocovers in reducing CH4 emissions and to monitor the
evolution in space and time of the dynamics and diversity of methanotrophic bacteria that
may be responsible for CH4 abatement. Dynamics of methanotroph populations derived
from most probable number (MPN) counts exhibited dif erent steps (lag, growth, and collapse phases), with mean abundances decreasing somewhat with depth. Methanotroph diversity, as assessed by denaturing gradient gel electrophoresis showed changes over time in the community structure. h ese changes were dependent on the sampling depth and only Type I methanotrophs belonging essentially to the genus Methylobacter were retrieved from our samples. Given the youthful character of the system under study, together with the reported behavior of this functional group of methanotrophs, it was concluded that Type I methanotrophs forming the community structure might rel ect pioneer species with a potentially high growth rate (r-strategists) that become numerically dominant reducing the evenness of species distribution. h ese results contribute to the generally limited body of knowledge on methanotroph diversity in landi ll cover soils.
Abbreviations: CCA, canonical correspondence analysis; DDGE, denaturing gradient gel electrophoresis; MDS, multidimensional scaling; MMO, methane monooxygenase; MPN, most probable number; pMMO, particulate MMO; PMOBio, passive methane oxidation biocover; sMMO, soluble MMO.
1480 SSSAJ: Volume 73: Number 5 • September–October 2009
Methylococcus genera. h e pMMO is present in all Type I and II methanotrophs and has been used as a gene target for the identi-i catidenti-ion of non-culturable methanotrophs identi-in envidenti-ironmental sam-ples (Murrell et al., 1998), with the exception of all members of the genus Methylocella (M. palustris, M. tundrae and M. silvestris) (Dedysh et al., 2004; Duni eld et al., 2003). Methanotrophs have been isolated and characterized from a variety of soils (Hanson and Hanson, 1996). Soil-mediated CH4 oxidation provides an important biological sink for both atmospheric and in situ pro-duced CH4 (Amaral et al., 1998).
Optimization of CH4 oxidation by methanotrophs in land-i ll cover soland-il may provland-ide an land-inexpensland-ive management strategy to minimize the emission of CH4 from landi lls to the atmo-sphere. h is prospect prompted an ongoing multidisciplinary project that considered dif erent aspects in assessing the ei cien-cy of landi ll cover materials that would act as a passive methane oxidation biocover (PMOBio) to reduce CH4 emissions from landi lls. h is type of cover might provide an alternative way to reduce emissions from landi lls having lower amounts of CH4 generation where l aring or energy recovery is uneconomical, or employed as a complementary strategy for gas collection systems to reduce emissions that escape the collection system.
h e present study was designed to examine the extent to which methanotrophic microbial communities would thrive in a designed landi ll biocover, in response to the presence of CH4 and hence contribute to CH4 attenuation. More specii cally, our objectives were to examine the temporal and spatial dynamics in methanotrophic activity and community composition to ac-quire a better understanding of the indigenous microorganisms involved in the observed CH4 abatement within the experimen-tal landi ll cover material. Moreover, since little is known about methanotroph diversity in landi ll cover soils, results reported here would contribute to increase knowledge on the relatively unexplored area of the relationship between methanotroph di-versity and function.
MATERIALS AND METHODS
Description of the Experimental Field Plot
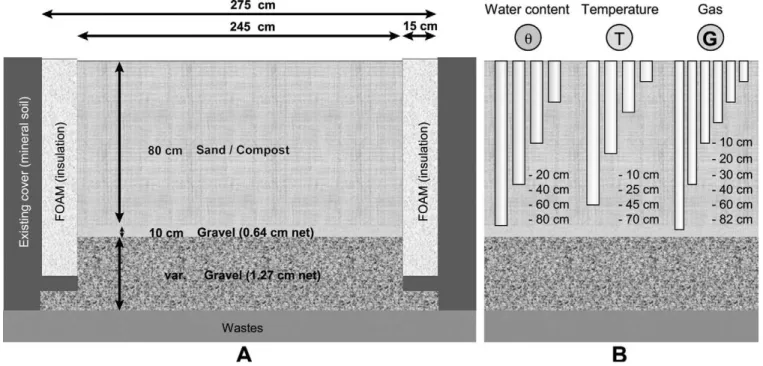
h e experimental plot used in the present study measured 2.75 m (W) by 9.75 m (L) and was constructed during the summer of 2006, at the St-Nicéphore landi ll, Quebec, Canada, a waste disposal facility cov-ering approximately 65 ha that receives mainly domestic waste. h e ma-jority of this area is already capped with a i nal cover, mostly constituted of a minimum of 1.2 m of i ne-grained soils (usually silt). h is studied plot included an 80-cm thick layer of sand-compost mixture underlain by a 10-cm thick transitional layer consisting of 6.4-mm net gravel and a 20-cm thick gas distribution layer (GDL) consisting of 12.7-mm net gravel. Additional details on the design and characteristics of the original sand and compost mixture that were used as well as the construction of this plot (Fig. 1A) can be found in Jugnia et al. (2008).
Soil Environment, Physicochemical Variables, and Methanotroph Counts
Probes for the measurement of temperature and gas concentration were installed at four separate points along the downhill longitudinal axis of the experimental plot and at four dif erent depths (six in the case of gas probes) in each proi le (Fig. 1B). Meteorological data, including precipitation and atmospheric pressure, were recorded continuously by a weather station installed near the experimental plot. h e tempera-ture probes (HOBO U12, from Onset) were connected to data loggers (HOBO U12, from Onset) and set to record values every 30 min.
Substrate samples were collected at three dif erent points from the uppermost part of the PMOBio (0–10, 10–20, 20–30, and 30–40 cm) using PVC coring tubes (inner diameter = 5 cm). h ereat er, sub-samples for physicochemical analyses and methanotroph counts were placed in air-tight plastic bags and kept at 4°C until analyzed in the laboratory, which was done within 24 h. For molecular biology analyses, 30-g samples were collected in 50-mL polypropylene conical tubes (BD Falcon, BD Sciences, San Jose, CA) and stored at −20°C.
h e physicochemical analyses (Page et al., 1982) included gravi-metric water content (by overnight drying at 105°C), organic matter
content (by loss-on-ignition at 550°C for 2 h), pH (determined in dis-tilled water 1:3 v/v).
Counts of methanotrophic bacteria were performed following the most probable number method, with soil slurries that were serially dilut-ed in 96-well microtiter plates. In brief, fresh soil (5 g) was suspenddilut-ed in 45 mL of a mineral salts medium (Heyer et al., 2002) and shaken for 1 h. Two hundred microliters of this suspension were placed in the i rst well of a 96-well microtiter plate. Serial 10-fold dilutions were performed from the second well to the eleventh well by transferring 20 μL to the next well, which contained 180 μL of mineral medium, using a multi-channel pipettor. h e 12th well contained only mineral medium and was used as the control. h e plates were incubated for 4 wk at 25°C in
gastight jars with air containing 3% CO2 and 18% CH4. At er
incuba-tion, all plates were read using a microplate reader to determine positive or negative growth of bacteria. h e MPN was corrected for the positive bias that is characteristic of published MPN tables (Salama et al., 1978) and calculated from the dilution factor and dry weight of the soil.
DNA Extraction from Soil Samples and PCR Amplifi cation
Total DNA was extracted directly from samples using mechani-cal shaking and an enzymatic lysis procedure as outlined in Fortin et al. (2004). h e crude DNA extracts were purii ed using Sephacryl/PVPP spin columns. h e PVPP resin was prepared as described by Holben et al. (1988). h e Sephacryl S-400 HR (GE Healthcare Bio-Sciences, Piscataway, NJ) was equilibrated in TE pH 7.6 as follows: batches of 25 mL of resin were washed with 25 mL TE (10 mM Tris-HCl pH 7.6;
1 mM Na2EDTA), then centrifuged for 1 min at 524 × g. h e
superna-tant was removed and the resin was washed again with fresh TE, pH 7.6. h e resin was subjected to a total of i ve washes as described above. h e crude DNA was prewarmed at 37°C for 10 min before the purii cation step. h e spin columns were layered with 400 μL of PVPP, then 400 μL of Sephacryl S-400 HR, and were centrifuged for 2 min at 799 × g be-fore and at er the addition of 50 μL of crude DNA.
Primers complementary to conserved regions of the particulate methane monooxygenase (pmoA) gene were used to amplify a 500 bp fragment. h e forward primer sequence contained a GC-clamp, to sta-bilize the melting behavior of the amplii ed fragments during denatur-ing gradient gel electrophoresis (Shei eld et al., 1989). h e sequence of the GC-clamp was 5’-GCG-GGC-GGG-GCG-GGG-GCA-CGG-GGG-GCG-CGG-CGG-GCG-GGG-CGG-GGG. h e primer se-quences were as follows: A189f: 5´-GGNGACTGGGACTTCTGG and mb661r: 5’-CCGGMGCAACGTCYTTAC, with non specii c bases (N, M, Y) replaced by I (for inosin). h e PCR mixture (50 μL) contained 10 μL of total DNA (undiluted, 1:10 or 1:50, initial DNA
concentrations ranging from 5 to 45 ng μL−1), 25 pmol of each primer,
8 μL of 1.25 mM of dNTP, 5 μL of 25 mM MgCl2, 0.13 μg μL−1
bo-vine serum albumin (BSA) and 2.5 units of Taq polymerase (Invitrogen, Burlington, ON). h e samples were denatured for 5 min at 96°C before the addition of the Taq polymerase. A touchdown PCR was performed in which the annealing temperature was set at 60°C and decreased by 0.5°C every cycle until it reached 50°C. Denaturation was performed at 94°C for 1 min followed by an annealing time of 1 min and primer extension at 72°C for 3 min. Fourteen additional cycles were performed at 50°C, for a total of 35 cycles. An aliquot of the PCR product was electrophoresed on a 1.4% agarose gel, with several dilutions of the 100-bp DNA marker from MBI Fermentas (Amherst, NY). h e prod-ucts were quantii ed by SYBR Safe staining and spot densitometry using a ChemiImager (Alpha Innotech Corp., San Leandro, CA).
Denaturing Gradient Gel Electrophoresis Analysis
Denaturing gradient gel electrophoresis was performed with a Bio Rad DCode Universal Mutation Detection system. Electrophoresis was performed on 0.75 mm thick 8% polyacrylamide gels (ratio of acrylam-ide to bisacrylamacrylam-ide, 37.5:1) in 1X TAE buf er (40 mM Tris, 40 mM acetic acid, 1 mM EDTA; pH 7.4) at 60°C. Approximately 450 ng of PCR product (pmoA gene) was applied to individual lanes of the gel. Electrophoresis conditions were 16 h at 80V in a linear 30 to 60% de-naturant gradient (100% dede-naturant was 7 M urea and 40% deionized formamide). h e gel was stained for 30 min in Vistra Green nucleic acid stain (GE Healthcare Bio-Sciences) and visualized with a l uorImager system model 595 (Molecular Dynamic, Sunnyvale, CA). h e gel image was processed using Adobe Photoshop 5.0.
Denaturing Gradient Gel Electrophoresis Fragment Isolation and Sequencing
Taxonomic identii cation was performed by excising and sequenc-ing the DGGE bands. Briel y, selected bands were excised from the gel and eluted in 60 μL of MilliQ water at 4°C overnight. Fit y microliters of the eluted DNA was purii ed with the QIAquick PCR purii cation kit (QIAGEN Inc. Mississauga, ON). One microliter of purii ed DNA was used as template for the reamplii cation of the DGGE fragment us-ing the same primers without the GC clamp. h e reaction mixture was the same as mentioned above. For PCR cycling, an initial denaturation of 5 min at 96°C was followed by twenty-i ve cycles at 94°C for 1 min, 55°C for 1 min, and 72°C for 1 min. h e PCR products were combined
and concentrated by ethanol precipitation. h e precipitated product was run on a 1.4% agarose gel. h e appropriate band was cut, purii ed with the Illustra GFX purii cation kit (GE Healthcare Bio-Sciences) and quanti-i ed by spot densquanti-itometry, as outlquanti-ined above. Sequencquanti-ing was performed by the “Laboratoire de Synthèse et d’Analyse d’Acide Nucleiques” of Laval University (Ste-Foy, QC) with a capillary ABI Prism 3100 sequencer.
Statistics
h e DGGE gel photographs were screened for the presence (1) or absence (0) of pmoA bands. A similarity matrix was generated with this binary data using the Jaccard coei cient and analyzed with non-metric multi-dimensional scaling (MDS) using XLSTAT sot ware. h e distance measure used for the MDS ordination was the Bray–Curtis coei cient. To determine the coni guration that produced the lowest stress solution, which measures the goodness-of-i t of the ordination, non-metric MDS analysis was run 100 times, completing 41 random restarts of the iteration to determine the minimum stress level.
Canonical correspondence analysis (CCA) was further used for revealing relationships between community structure, as determined by DGGE proi les, and environmental variables. h e purpose of this ap-proach was to i nd the combination of explanatory variables that best explained the variation of the DGGE matrix. h e signii cance of the constrained ordination process was tested with the Monte Carlo per-mutation test (999 perper-mutations). h e CCA was performed with the sot ware CANOCO for Windows 4.53 (Biometris, the Netherlands).
h e pmoA gene sequences were aligned using MacVector 7.2 sot -ware and compared with the EMBL Nucleotide Sequence Database using the FASTA search program (Pearson and Lipman, 1988). h e Phylogenetic tree (neighbor-joining algorithm with Jukes-Cantor) was constructed using the MacVector 7.2 sot ware package. h e robustness of inferred topologies was later tested by 1000 bootstrap resamplings of the neighbor-joining data.
1482 SSSAJ: Volume 73: Number 5 • September–October 2009
Accession Numbers
Sequences from this study have been deposited in the GenBank database under Accession Numbers EU292151-EU292168.
RESULTS
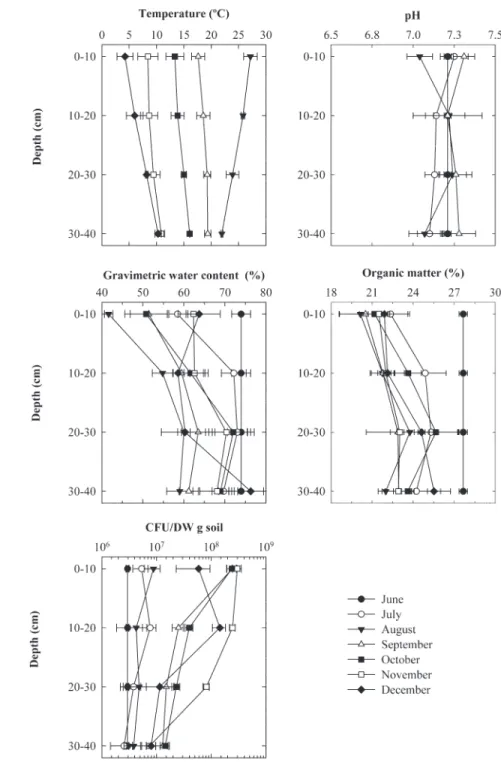
Depth proi les of temperature, pH, gravimetric water con-tent, organic matter concon-tent, and methanotroph counts within the cover soil are presented in Fig. 2. Temperature varied from 4.2 to 27.2°C (mean ± SD = 14.9 ± 6.7°C) and exhibited varia-tions with depth and time, the highest thermal amplitude being
associated with the uppermost part of the cover. Until August 2006, the temperature generally decreased with depth through-out the cover. In September it remained almost constant and, from October, the temperature started to increase with depth until the end of the study.
A dif erent trend was observed for the pH of the soil; it ranged from 7.0 to 7.3 (Mean ± SD = 7.2 ± 0.1) and varied only slightly with time and depth throughout the study period. For all the samples analyzed, the water content ranged from 41.7 to 76.3% (Mean ± SD = 67.1 ± 8.5%), while the organic matter
content l uctuated between 20.1 and 27.7% (Mean ± SD = 23.6 ± 2.2%). h e values for these two variables increased slightly with depth, whereas with time, only l uctuations in gravimetric water content near the surface (0–10 cm) appeared signii cant.
Counts of methanotrophic bac-teria varied from 1.50 × 10⁶ to 1.83 × 10⁸ CFU gdw−1 (per gram of dry weight soil), with a mean ± SD across all sam-pling dates of 3.40 ± 2.68 × 10⁷ CFU gdw−1. On average, the number of methanotrophic bacteria decreased somewhat with depth from 7.83 ± 5.42 107 CFU gdw−1 near the surface (0–10 cm) to 4.12 ± 2.68 × 10⁷ CFU gdw−1 at the 10- to 20-cm depth and 1.21 ± 1.03 × 10⁷ CFU gdw−1 be-tween 20 and 30 cm and reached a minimum of 4.49 ± 2.93 × 10⁶ CFU gdw−1 at 30 to 40 cm. Temporal evolution of depth profiles of counts of methanotrophs could be divided into three phases (Fig. 2): The lag phase in-cluded the first three sampling campaigns ( June to August), when the abundance pro-files were essentially identical. During the second phase (August to November), counts of methanotrophic bacteria increased with time, particularly at the surface, to reach the maximum values observed during this study. In the third phase that started in December, a drop in methanotroph counts was observed, particularly in the 0- to 10-cm depth.
Figure 3 presents the results of the DGGE analyses. Visual inspection of the i ngerprint— where banding patterns represent changes in microbial diversity—suggested substantial spe-cies variability over time and depth in the CH4 oxidizing bacterial community. More precisely, the DGGE patterns indicated that although a few dominant bands (such as Bands D, E, and V) were detected in almost every sample, the number of bands as well as their intensities in-creased considerably over time near the surface (0–10 cm; Fig. 3). At this depth, the intensity of several bands increased steadily from the third sampling campaign onward with appear-ance in some cases of new bands such as F, K, M, and R. On the other hand, changes in in-tensity and banding pattern observed within
Fig. 2. Temporal evolution of temperature, pH, gravimetric water content, organic matter content and colony forming unit (CFU) of methanotrophs within the passive methane oxidation biocover (PMOBio). No data was available for the temperature in June. Also, the constancy of the pH, soil moisture, organic matter, and counts with depth in June was due to the fact that data were from the original sand and compost mixture that we used during the construction of the experimental plot. Data are averages of triplicates with error bars equivalent to 1 S.D.
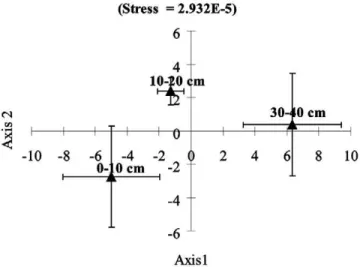
and between the 10- to 20- and 30- to 40-cm sampling depths were less signii cant, with no clear trend over time, as compared to the 0- to 10-cm sampling depth. h is ob-servation was substantiated by the multidimensional scaling (MDS) statistical analysis, which indicated that time-related dif erences in community structure varied from one another between the 0- to 10-cm, 10- to 20-10-cm, and 30- to 40-cm sampling depths (Fig. 4).
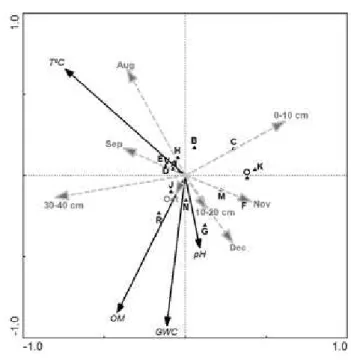
h e relationship between the community composition and soil environmental variables was tested by CCA (Fig. 5). h e i rst canonical axis (eigen value = 0.113, F = 3.078, p = 0.018) and all canonical axes (sum of all canonical eigen values = 0.219, F = 2.11, p = 0.003) were sta-tistically signii cant in this analysis. Phylotype-environmental correla-tions were high, especially for Axes 1 and 2 (0.937 and 0.665), indicat-ing a relationship between species and environmental variables. h e i rst two axes accounted for 66% of the total variance and the i rst axis alone explained 45%.
From the biplot of the CCA result with interspecies distances
(Fig. 5), signii cant correlation to the species variation was ob-served by three parameters, namely temperature, organic mat-ter, and gravimetric water content. h e latter two variables were placed in the same quadrant, showing a strong correlation among them. A group made of Bands A, B, D, E, H and V had a strong correlation with temperature, while Bands G, J, N, and R were associated with high organic matter and gravimetric water con-tent. Several bands including C, K, O, M, F, which could not be grouped with the other bands, showed little inl uence of the above mentioned three factors and appeared to be derived principally from the 0- to 10-cm sampling depth.
An examination of the CCA plot rel ected dif erences men-tioned above between the investigated sampling depths. h e 0- to 10-cm and 30- to 40-cm depths were opposed, while the 10- to 20-cm sampling depth was placed in the middle of the plot forming a dif erent group (Fig. 5). Also, samples collected during relatively warm periods (August and September) grouped oppo-site to those collected during relatively cold periods (November and December)
All of the major bands in the DGGE gel that were excised and sequenced (indicated by arrows, Fig. 3) were related to the pmoA gene from Type I methanotrophs in the Gamma-subdivision of the Proteobacteria (Fig. 6). More precisely, sequences from Bands J, K, L M, N and R grouped among the Type I metha-notrophs, closest to previously described uncultured bacterium (EF212356; 90–93%) from landi ll cover soil. With the excep-tion of Bands V (PMOB-V) and O (PMOB-O) that grouped with
landi ll cover soil uncultured Methylocaldum sp. (AY195659; 99%) and Methylomonas sp ML64 (AF510080; 92%), respectively, se-quence analysis revealed that most DGGE bands showed similarity with the pmoA gene from Methylobacter strain isolated from diverse habitats including landi ll cover soil (Fig. 6).
Fig. 3. Negative image of denaturing gradient gel electrophoresis (DGGE) patterns obtained from samples from 0–10 cm, 10–20 cm and 30–40 cm sampling depths. The fi rst lane (Original) represent the community structure of methanotrophs in the mixture of sand and compost used as substrate during the construction of the passive methane oxidation biocover (PMOBio). The arrows show the position of the bands that were excised and sequenced.
Fig. 4. Non-metric multidimensional scaling (MDS) analysis of pmoA derived DGGE patterns. All symbols represent mean values ± SE calculated using sampling dates as replicates.
1484 SSSAJ: Volume 73: Number 5 • September–October 2009
DISCUSSION
Preliminary results with the sand-compost substrate mix-ture used in this study demonstrated the ef ectiveness of this material for CH4 abatement, and more details on this during the study period are presented in Jugnia et al. (2008). Our objectives here were to examine the spatiotemporal dynamics and diversity of the indigenous methanotrophs involved in the observed CH4 abatement within the experimental landi ll cover material.
Gas Profi les and Methane Abatement
h e dif erent patterns of representative O2 and CH4 con-centration proi les showed that CH4 abatement does occur and was more pronounced within the uppermost part of the bio-cover (0–10 cm). However, the zone of optimum CH4 abate-ment moved during the study period and was sometimes found at lower depths ( Jugnia et al., 2008). h is is a common and well known feature in landi ll cover soil (Berger et al., 2005; Humer and Lechner, 2001; Visvanathan et al., 1999; Whalen et al., 1990) that has been linked to factors such as temperature,
wa-ter content of the soil, dif erential pressure between the waste mass, the atmosphere and the concentrations of O2, and CH4. Temperature and water content (which directly af ect O2 avail-ability) of the substrate have been identii ed as the two variables inl uencing CH4 abatement within this PMOBio ( Jugnia et al., 2008), in agreement with the results of a recent study by Einola et al. (2007).
Soil and Environmental
Variables in Relation to Methane Abatement and Methanotrophs
Since there was a sui cient supply of CH4 throughout the study, pH, O2 availability and temperature are the other factors that could have af ected CH4 oxidation. However, the l uctua-tion in soil pH throughout the study remained within a narrow range of val-ues generally reported as optimal for the growth of methanotrophs ( Jugnia et al., 2008). In contrast, temperature exhib-ited variations with depth throughout the monitoring period, the highest ther-mal amplitude being associated with the uppermost part of the cover where most of the CH4 oxidation occurred. h is suggests a relationship between CH4 oxidation and temperature in this part of the cover. It has been shown that CH4 consumption by methanotrophs changes with temperature (Börjesson et al., 2004; Einola et al., 2007; Kettunen et al., 2006; Park et al., 2005) when the water content, among other factors, is not limiting (Einola et al., 2007).
Signii cant l uctuations in the gra-vimetric water content observed near the surface (0–10 cm) was related to the variations in temperature and CH4 oxi-dation activity, and the water content
Fig. 5. Canonical correspondence analysis (CCA) ordination biplot of DGGE bands (black triangle) and environmental variables (represented by bold arrows). GWC = gravimetric water content, T°C = temperature, OM = organic matter. Dashed arrows represent supplementary variables from sampling month and depth data (not involved in calculation) and that were included in the graph to show the relative partition by month and depth with respect to bands from the denaturing gradient gel electrophoresis (DGGE) fi ngerprints.
Fig. 6. Phylogenetic analysis of the deduced sequence of pmoA genes from methanotrophs. Total community DNA from samples was amplifi ed with the primer set A189/mb661. The tree was constructed with the pmoA sequence of Methylosinus sporium 8 as outgroup. Bootstrap probability (%) values are represented at the nodes (when more than 50%). The bar represents a 5% sequence divergence, as determined by measuring the length of the horizontal line connecting any two species.
of the cover soil identii ed as a key factor contributing to limit deep CH4 oxidation by preventing O2 from reaching deeper zones within the cover ( Jugnia et al., 2008). On the other hand, throughout the study period, it is within the i rst 30 cm from the surface that the organic matter content exhibited its highest vari-ability. A signii cant decrease over time in organic matter con-tent near the surface, as compared with deeper layers was due to more active aerobic respiration within this zone. It appears that the development of an active heterotrophic community, includ-ing methanotrophs, in the substrate within the uppermost zone of the cover, contributed to higher rates of O2 consumption and limited its penetration into the PMOBio.
h ere is a possibility that non-methanotrophic bacteria contributed to the results of our MPN counts. h erefore, metha-notroph counts presented here may have overestimated the actu-al number of culturable methanotrophic bacteria in our samples. However, spatiotemporal variations in these counts might rel ect dynamics of methanotrophs that occurred during our study. Methanotrophic bacterial populations developed well within the PMOBio and a similarly high population of methanotrophs was detected by Jäckel et al. (2005) in the upper layer of a mature compost material (1.8 × 10⁶ to 3.2 × 10⁷cells per g). Population sizes of 106 cells g−1 soil were detected previously in wetland and landi ll soils using the MPN method ( Jones and Nedwell, 1993; Kallistova et al., 2007; Svenning et al., 2003). As for the
temporal evolution of depth proi les of methanotroph counts, the lag phase followed the construction of the experimental cell and included the i rst three sampling campaigns, during which abundance proi les were essentially identical (Fig. 2). Kightley et al. (1995) reported that under laboratory conditions (19°C), it took 1 month to establish the steady-state conditions needed for growing methanotrophs in a soil column. Our results indicated that the establishment of methanotrophs probably takes much longer under i eld conditions. h is observation corroborates a report from a previous study in a landi ll cover soil by Börjesson et al. (1998). During the second phase, which extended from August to October 2006, counts of methanotrophs increased with time, particularly at the surface, to reach the maximum val-ues observed during this study. h e low number of methanotro-phs determined by MPN in December within the cover soil layer above 40 cm was probably due to the lower temperatures associ-ated with the onset of winter.
Denaturing Gradient Gel Electrophoresis Analysis and Sequencing: Methanotrophs Diversity
Molecular techniques represent a signii cant step forward in studies of soil microorganisms, as they allow the assessment of the total population, independent of culturing. h eoretically, culture-independent analysis provides improved coverage of community richness, however, factors such as DNA extraction bias, PCR bias, and relative abundance of target genes may af ect the i ngerprints obtained. While DGGE i ngerprinting does not provide complete coverage of soil bacterial diversity, since only the most dominant microbial populations (approximately the top 10%) can be resolved in any i ngerprint (Muyzer and Smalla, 1998; Nikolausz et al., 2005), it is a suitable approach in com-parative analyses of the dominant members of communities. As in previous studies (Bodelier et al., 2005; DeJournett et al., 2007; Henckel et al., 2001; Wartiainen et al., 2003), we used the
pres-ence and pattern of dif erent bands in the DGGE to elucidate diversity in the community of methanotrophs among the three sampling depths considered in this study.
Changes observed over time in the number of bands, par-ticularly between the original sample (the sand and compost mixture used during the construction of the experimental plot) and those collected following the construction, rel ected chang-es in specichang-es to those more adapted to the conditions prevailing at the time for each of the dif erent sampling depths considered. Multidimensional scaling statistical analysis revealed that time-related dif erences in community structure occurred at all sam-pling depths (0–10, 10–20, and 30–40 cm) in this study. h is can be interpreted as depth-related factor(s) shaping the metha-notroph community structure, and/or dif erent responses of the methanotrophs present at these depths to changing environmen-tal conditions. At the 0- to 10-cm depth, signii cant dif erences in band intensities and numbers occurred, paralleling the great-est l uctuations in temperature and gravimetric water content at this depth where CH4 oxidation was reported to be more signii -cant ( Jugnia et al., 2008). h is emphasizes the importance of this layer, which contains the highest methanotrophic population density and diversity, as being the most susceptible to environ-mental changes that can have the greatest impact on methane ox-idation activity. Previous studies (Eller and Frenzel, 2001; Horz et al., 2002; Stralis-Pavese et al., 2004) reported that changes in the methanotrophic community structure had an impact on the level of CH4 oxidation activity.
Although the DGGE banding patterns suggested that there were changes in the methanotrophic community, all the sequences from the major DGGE bands shared similar-ity to Type I methanotrophs. Phylogenetic analyses showed that these changes occurred principally with species related to Methylobacter, as most of the sequences related to the metha-notrophs clustered within this genus. h is indicates that mem-bers of the genus Methylobacter might be dominant in the system studied, in addition to the other members of Type I methanotro-phs, Methylocaldum and Methylomonas that were identii ed. h e dominance of Type I methanotrophs in this study is consistent with a recent observation by Chen et al. (2007) who reported the prevalence of Type I methanotrophs in landi ll cover soil using A189/mb661 primers. Stralis-Pavese et al. (2006) also noted the dominance of Type I methanotrophs in landi ll cover soil, where landi ll gas had a positive ef ect on the presence of Methylobacter. However, our inability to detect Type II methanotrophs in this study may not rule out their presence. Type II methanotrophs Methylosinus and Methylocystis have been detected in other land-i lls usland-ing dland-if erent molecular methods, such as 16S RNA gene libraries (Chen et al., 2007; Uz et al., 2003), catalyzed reporter deposition-FISH (CARD-FISH) (Kallistova et al., 2007) or indirect immunol uorescence (Kallistova et al., 2005). Type II methanotrophs were probably much less abundant in our sam-ples than those from these other sites.
Results from previous environmental studies and continu-ous culture experiments (Hanson and Hanson, 1996; Henckel et al., 2000; Macalady et al., 2002; Stralis-Pavese et al., 2004) have led to the commonly cited hypothesis that Type II methanotro-phs predominate in high CH4 concentration environments, while Type I methanotrophs dominate in environments with low CH4 concentrations. Given that methanotrophs in landi ll
1486 SSSAJ: Volume 73: Number 5 • September–October 2009
cover soil are expected to encounter high CH4 concentrations, similar to those recorded (?550,000 ppmv) at the bottom of our experimental plot, we anticipated the prevalence of Type II methanotrophs. Yet, only Type I methanotrophs were retrieved from our samples, although the primer pair (A189/mb661) we used has been shown to amplify the majority of both Type I and Type II methanotrophs (Bourne et al., 2001).
h e above discrepancy supports the growing body of evi-dence suggesting that there is no clear prevalence of Type I or Type II populations at dif erent regimes of CH4 concentration (DeJournett et al., 2007; Duni eld et al., 1999; Henckel et al., 2000; Knief et al., 2006; Singh et al., 2007), and that no clear delineations can be made about the niches occupied by Type I vs. Type II species: these groupings may be too broad for such gen-eralization, and any observed trends may be ecosystem-specii c (Knief and Duni eld, 2005; Knief et al., 2006).
Previous studies reported that Type I methanotrophs dominate at rapidly changing growth conditions (Graham et al., 1993; Macalady et al., 2002). According to Torsvik et al. (2002), stable conditions are generally associated with increased diver-sity, while unpredictable or disturbed environments lead to the outgrowth of dominant, adapted populations. In ecology, both unpredictable environments and/or rapidly changing growth conditions are generally among other characteristics of newly formed systems, where changes in the community structure is shaped by species with a high growth rate (r-strategists). Given that the experimental PMOBio investigated in the present study was relatively young (less than 1-yr old), it can be hypothesized that the system had not yet reached maturity, and a climax com-munity, typical of established environmental conditions had probably not yet been attained. Accordingly, our results can be interpreted as changes in methanotroph community structure within an immature PMOBio, and Type I methanotrophs in this study can be viewed as pioneer species with a potentially high growth rate that become numerically dominant and reduced the evenness of species distribution.
ACKNOWLEDGMENTS
h e Authors thank numerous students and technicians involved in the project, namely K. Arteaga, D. Rannaud, M-A. Askri, A. Santos, J. Moreira, and J-G. Lemelin for their devoted work in the i eld. h is work was i nancially supported by the Natural Sciences and Engineering Research Council of Canada (NSERC), BIOCAP Canada, the Biotechnology Research Institute (NRC) and Waste Management Inc. under a strategic grant.
REFERENCES
Amaral, J., T. Ren, and R. Knowles. 1998. Atmospheric methane consumption by forest soils and extracted bacteria at dif erent pH values. Appl. Environ. Microbiol. 64:2397–2402.
Berger, J., L. Fornés, B. Wawra, U. Zanke, and J. Jager. 2005. Methane oxidation in a landi ll cover with capillary barrier. Waste Manag. 25:369–373. Bodelier, P.L.E., M. Meima-Franke, G. Zwart, and H.J. Laanbroek. 2005.
New DGGE strategies for the analyses of methanotrophic microbial communities using dif erent combinations of existing 16S rRNA-based primers. FEMS Microbiol. Ecol. 52:163–174.
Börjesson, G., I. Sundh, and B.H. Svensson. 2004. Microbial oxidation of CH4
at dif erent temperatures in landi ll cover soils. FEMS Microbiol. Ecol. 48:305–312.
Börjesson, G., J. Samuelsson, and J. Chanton. 2007. Methane oxidation in Swedish landi lls quantii ed with the stable carbon isotope technique in
combination with an optical method for emitted methane. Environ. Sci. Technol. 41:6684–6690.
Börjesson, G., I. Sundh, A. Tunlid, and B.H. Svensson. 1998. Methane oxidation in landi ll cover soils, as revealed by potential oxidation measurements and phospholipid fatty acid analyses. Soil Biol. Biochem. 30:1423–1433. Bourne, D.G., I.R. McDonald, and J.C. Murrell. 2001. Comparison of pmoA
PCR primer sets as tools for investigating methanotroph diversity in three Danish soils. Appl. Environ. Microbiol. 67:3802–3809.
Chen, Y., M.G. Dumont, A. Cébron, and J.C. Murrell. 2007. Identii cation of active methanotrophs in a landi ll cover soil through detection of expression of 16S rRNA and functional genes. Environ. Microbiol. 9:2855–2869. Dedysh, S.N., Y.Y. Berestovskaya, L.V. Vasylieva, S.E. Belova, V.N. Khmelenina,
N.E. Suzina, Y.A. Trotsenko, W. Liesack, and G.A. Zavarzin. 2004. Methylocella tundrae sp. nov., a novel methanotrophic bacterium from acidic tundra peatlands. Int. J. Syst. Evol. Microbiol. 54:151–156. DeJournett, T.D., W.A. Arnold, and T.M. LaPara. 2007. h e characterization
and quantii cation of methanotrophic bacterial populations in constructed wetland sediments using PCR targeting 16S rRNA gene fragments. Appl. Soil Ecol. 35:648–659.
Duni eld, P.F., W. Liesack, T. Henckel, R. Knowles, and R. Conrad. 1999. High-ai nity methane oxidation by a soil enrichment culture contHigh-aining a type II methanotroph. Appl. Environ. Microbiol. 65:1009–1014.
Duni eld, P.F., V.N. Khmelenina, N.E. Suzina, Y.A. Trotsenko, and S.N. Dedysh. 2003. Methylocella silvestris sp. nov., a novel methanotroph isolated from an acidic forest cambisol. Int. J. Syst. Evol. Microbiol. 53:1231–1239. Einola, J.-K.M., R.H. Kettunena, and J.A. Rintala. 2007. Responses of methane
oxidation to temperature and water content in cover soil of a boreal landi ll. Soil Biol. Biochem. 39:1156–1164.
Eller, G., and P. Frenzel. 2001. Changes in activity and community structure of methane-oxidizing bacteria over the growth period of rice. Appl. Environ. Microbiol. 67:2395–2403.
Fortin, N., D. Beaumier, K. Lee, and C.W. Greer. 2004. Soil washing improves the recovery of total community DNA from polluted and high organic content sediments. J. Microbiol. Methods 56:181–191.
Graham, D.W., J.A. Chaudhary, R.S. Hanson, and R.G. Arnold. 1993. Factors af ecting competition between type I and type II methanotrophs in two-organism, continuous-l ow reactors. Microb. Ecol. 25:1–17.
Hanson, R.S., and T.E. Hanson. 1996. Methanotrophic bacteria. Microbiol. Rev. 60:439–471.
Henckel, T., P. Roslev, and R. Conrad. 2000. Ef ects of O2 and CH4 on the presence and activity of the indigenous methanotrophic community in rice i eld soil. Environ. Microbiol. 2:666–679.
Henckel, T., U. Jäckel, and R. Conrad. 2001. Vertical distribution of the methanotrophic community at er drainage of rice i eld soil. FEMS Microbiol. Ecol. 34:279–291.
Heyer, J., V.F. Galchenko, and P.F. Duni eld. 2002. Molecular phylogeny of type II methane oxidizing bacteria isolated from various environments. Microbiology 148:2831–2846.
Holben, W.E., J.K. Jansson, B.K. Chelm, and J.M. Tiede. 1988. DNA probe method for the detection of specii c microorganisms in the soil bacterial community. Appl. Environ. Microbiol. 54:703–711.
Horz, H.-P., A.S. Raghubanshi, J. Heyer, C. Kammann, R. Conrad, and P. Duni eld. 2002. Activity and community structure of methane-oxidizing bacteria in a wet meadow soil. FEMS Microbiol. Ecol. 41:247–257. Humer, M., and P. Lechner. 2001. Microbial methane oxidation for the reduction
of landi ll gas emissions. J. Solid Waste Technol. Manage. 27:146–151. IPCC. 2007. Climate change 2007: h e physical science basis. Cambridge Univ.
Press, Cambridge, UK.
Jäckel, U., K. h ummes, and P. Kämpfer. 2005. h ermophilic methane production and oxidation in compost. FEMS Microbiol. Ecol. 52:175–184.
Jones, H.A., and D.B. Nedwell. 1993. Methane emission and methane oxidation in landi ll cover soil. FEMS Microbiol. Ecol. 102:185–195.
Jugnia, L.-B., A.R. Cabral, and C.W. Greer. 2008. Biotic methane oxidation within an instrumented experimental landi ll cover. Ecol. Eng. 33:102–109. Kallistova, A.Y., M.V. Kevbrina, V.K. Nekrasova, M.V. Glagolev, M.I. Serebryanaya,
and A.N. Nozhevnikova. 2005. Methane oxidation in landi ll cover soil. Microbiology 74:608–614.
Kallistova, A.Y., M.V. Kevbrina, V.K. Nekrasova, N.A. Shnyrev, J.-K.M. Einola, M.S. Kulomaa, J.A. Rintala, and A.N. Nozhevnikova. 2007. Enumeration of methanotrophic bacteria in the cover soil of an aged municipal landi ll.
Microb. Ecol. 54:637–645.
Kettunen, R.H., J.-K.M. Einola, and J.A. Rintala. 2006. Landi ll methane oxidation in engineered soil columns at low temperature. Water Air Soil Pollut. 177:313–334.
Kightley, D., D.B. Nedwell, and M. Cooper. 1995. Capacity for methane oxidation in landi ll cover soils measured in laboratory-scale soil microcosms. Appl. Environ. Microbiol. 61:592–601.
Knief, C., and P. Duni eld. 2005. Response and adaptation of dif erent methanotrophic bacteria to low methane mixing ratios. Environ. Microbiol. 9:1307–1317.
Knief, C., S. Kolb, P.L.E. Bodelier, A. Lipski, and P.F. Duni eld. 2006. h e active methanotrophic community in hydromorphic soils changes in response to changing methane concentration. Environ. Microbiol. 8:321–333. Macalady, J.L., A.M.S. McMillan, A.F. Dickens, S.C. Tyler, and K.M. Scow. 2002.
Population dynamics of type I and type II methanotrophic bacteria in rice soils. Environ. Microbiol. 4:148–157.
Murrell, J.C., I.R. McDonald, and D.G. Bourne. 1998. Molecular methods for the study of methanotroph ecology. FEMS Microbiol. Ecol. 27:103–114. Muyzer, G., and K. Smalla. 1998. Application of denaturing gradient gel
electrophoresis (DGGE) and temperature gradient gel electrophoresis (TGGE) in microbial ecology. Anto. Van Leeu. Int. J. Gen. Mol. Microbiol. 73:127–141.
Nikolausz, M., R. Sipos, S. Revesz, A. Szekely, and K. Marialigeti. 2005. Observation of bias associated with re-amplii cation of DNA isolated from denaturing gradient gels. FEMS Microbiol. Lett. 244:385–390.
Page, A.L., R.H. Miller, and D.R. Keeney. 1982. Methods of soil analysis. 2nd ed. SSSA and ASA, Madison, WI.
Park, J.R., S. Moon, Y.M. Ahn, J.Y. Kim, and K. Nam. 2005. Determination of environmental factors inl uencing methane oxidation in a sandy landi ll cover soil. Environ. Technol. 26:93–102.
Pearson, W.R., and D.J. Lipman. 1988. Improved tools for biological sequence comparison. Proc. Natl. Acad. Sci. USA 85:2444–2448.
Roslev, P., N. Iversen, and K. Henriksen. 1997. Oxidation and assimilation of atmospheric methane by soil methane oxidizers. Appl. Environ. Microbiol. 65:4064–4070.
Salama, l.A., G.G. Koch, and H.D. Tolley. 1978. On the estimation of the most probable number in a serial dilution technique. Commun. Stat. h eor. Methodol. A7:1267–1282.
Shei eld, V.C., D.R. Cox, L.S. Lerman, and R.M. Myers. 1989. Attachment of a 40-base-pair G+C-rich sequence (GC-clamp) to genomic DNA fragments
by the polymerase chain reaction results in improved detection of single-base changes. Proc. Natl. Acad. Sci. USA 86:232–236.
Singh, B.K., K.R. Tate, G. Kolipaka, C.B. Hedley, C.A. Macdonald, P. Millard, and J.C. Murrell. 2007. Ef ect of af orestation and reforestation of pastures on the activity and population dynamics of methanotrophic bacteria. Appl. Environ. Microbiol. 73:5153–5161.
Spokas, K., J. Bogner, J.P. Chanton, M. Morcet, C. Aran, C. Graf , Y. Moreau-Le Golvan, and I. Hebe. 2006. Methane mass balance at three landi ll sites: What is the ei ciency of capture by gas collection systems? Waste Manag. 26:516–525.
Stralis-Pavese, N., L. Bodrossy, T.G. Reichenauer, A. Weilharter, and A. Sessitsch. 2006. 16S rRNA based T-RFLP analysis of methane oxidizing bacteria—Assessment, critical evaluation of methodology performance and application for landi ll site cover soils. Appl. Soil Ecol. 31:251–266. Stralis-Pavese, N., A. Sessitsch, A. Weilharter, T. Reichenauer, J. Reising, J. Csontos,
J.C. Murrell, and L. Bodrossy. 2004. Optimization of diagnostic microarray for application in analyzing landi ll methanotroph communities under dif erent plant covers. Environ. Microbiol. 6:347–363.
Svenning, M.M., I. Wartiainen, A.G. Hestnes, and S.J. Binnerup. 2003. Isolation of methane oxidizing bacteria from soil by use of a soil substrate membrane system. FEMS Microbiol. Ecol. 44:347–354.
Torsvik, V., L. Øverås, and T.F. h ingstad. 2002. Prokaryotic diversity- magnitude, dynamics and controling factors. Science 296:1064–1066.
Uz, I., M.E. Rasche, T. Townsend, A.V. Ogram, and A.S. Lindner. 2003. Characterization of methanogenic and methanotrophic assemblages in landi ll samples. Proc. R. Soc. Lond. B. Biol. Sci. 270:S202–S205. Visvanathan, C., D. Pokhrel, W. Cheimchaisri, J.P. Hettiaratchi, and J.S. Wu. 1999.
Methanothropic activities in tropical landi ll cover soils: Ef ects of temperature, moisture content and methane concentration. Waste Manage. Res. 17:313–323. Wartiainen, I., A.G. Hestnes, and M.M. Svenning. 2003. Methanotrophic diversity in high arctic wetlands on the islands of Svalbard (Norway)—denaturing gradient gel electrophoresis analysis of soil DNA and enrichment cultures. Can. J. Microbiol. 49:602–612.
Whalen, S.C., W.S. Reeburgh, and K.A. Sandbeck. 1990. Rapid methane oxidation in a landi ll cover soil. Appl. Environ. Microbiol. 56:3405–3411.
Wuebbles, D.J., and K. Hayhoe. 2002. Atmospheric methane and global change. Earth Sci. Rev. 57:177–210.
Zinder, S.H. 1993. Physiology ecology of methanogens. p. 35–80. In J.G. Ferry (ed.) Methanogenesis. Chapman & Hall, London.