Publisher’s version / Version de l'éditeur:
Journal of the Electrochemical Society, 160, 3, pp. F235-F243, 2013-01-01
READ THESE TERMS AND CONDITIONS CAREFULLY BEFORE USING THIS WEBSITE.
https://nrc-publications.canada.ca/eng/copyright
Vous avez des questions? Nous pouvons vous aider. Pour communiquer directement avec un auteur, consultez la Questions? Contact the NRC Publications Archive team at
PublicationsArchive-ArchivesPublications@nrc-cnrc.gc.ca. If you wish to email the authors directly, please see the first page of the publication for their contact information.
This publication could be one of several versions: author’s original, accepted manuscript or the publisher’s version. / La version de cette publication peut être l’une des suivantes : la version prépublication de l’auteur, la version acceptée du manuscrit ou la version de l’éditeur.
For the publisher’s version, please access the DOI link below./ Pour consulter la version de l’éditeur, utilisez le lien DOI ci-dessous.
https://doi.org/10.1149/2.026303jes
Access and use of this website and the material on it are subject to the Terms and Conditions set forth at
The electrochemistry of metallic nickel: oxides, hydroxides, hydrides
and alkaline hydrogen evolution
Hall, David S.; Bock, Christina; Macdougall, Barry R.
https://publications-cnrc.canada.ca/fra/droits
L’accès à ce site Web et l’utilisation de son contenu sont assujettis aux conditions présentées dans le site LISEZ CES CONDITIONS ATTENTIVEMENT AVANT D’UTILISER CE SITE WEB.
NRC Publications Record / Notice d'Archives des publications de CNRC:
https://nrc-publications.canada.ca/eng/view/object/?id=3f006742-0870-44ba-b328-0e7dd15cfb1f https://publications-cnrc.canada.ca/fra/voir/objet/?id=3f006742-0870-44ba-b328-0e7dd15cfb1f
The Electrochemistry of Metallic Nickel:
Oxides, Hydroxides, Hydrides and Alkaline Hydrogen Evolution
David S. Hall
†‡, Christina Bock
‡, Barry R. MacDougall
†‡*†Department of Chemistry, University of Ottawa, D’Iorio Hall, 10 Marie Curie, Ottawa ON,
Canada, K1N 6N5
‡Energy, Mining and Environment, National Research Council Canada, M-12, 1200 Montreal
Rd, Ottawa ON, Canada, K1A 0R6
*Corresponding Author: email: barry.macdougall@nrc-cnrc.gc.ca, Tel: 991-0914, Fax:
Abstract
Ni-based catalysts in aqueous alkaline media are low-cost electrode materials for electrolytic hydrogen generation, a renewable method of producing fuel and industrial feedstock. However, Ni cathodes show a significant decrease in their hydrogen evolution reaction (HER) activity after several hours of electrolysis. Further, industrial electrolysers are often subjected to transient anodic currents, the effects of which on Ni-based catalysts are not well-known. We consider the source of electrode deactivation and the effects of temporary anodic currents on smooth metallic Ni electrodes in alkaline solutions by cyclic voltammetry (CV), galvanostatic and potentiostatic polarization, X-ray diffraction (XRD) and X-ray photoelectron spectroscopy (XPS). Polished surfaces are covered by a bilayer composed of α-Ni(OH)2 underlaid by
non-stoichiometric NiOx. Below the reversible hydrogen electrode (RHE) potential, the air-formed
layer mostly reduces to Ni metal and H atoms incorporate deep into the electrode material. Under industrial conditions, i.e., concentrated NaOH/KOH solutions and large cathodic current densities, α-NiHxand β-NiHxcan form at the electrode surface. Above the RHE potential, NiOx,
α-Ni(OH)2, β-Ni(OH)2 and β-NiOOH form reversibly and mostly reduce back to Ni on
subsequent cathodic polarization. However, repeated oxidation and reduction will introduce strain on a catalyst material, which may lead to its mechanical failure.
1. Introduction
Hydrogen generation by water electrolysis is a renewable method of producing high purity fuel and industrial chemical feedstock (e.g., for float glass manufacturing, petroleum refining and ammonia production), where large-scale stationary production can be integrated into the existing electrical distribution infrastructure.1, 2 Approximately 65 million metric tonnes of
H2 are produced and used annually,2 of which electrolysis accounts for ~4 %.2, 3 Polymer
electrolyte membrane (PEM) cells, which use noble-metal-based electrode materials in acidic media, offer high energy efficiency and are commonly used for small-scale H2 production.
However, these units are too expensive to compete as large-scale sources of H2. H2-evolution
catalysts based on high surface area Ni electrodes in alkaline media are low-cost alternatives that are better suited for large-scale H2 generation.1-4 A problem these electrodes face is that the
hydrogen evolution reaction (HER) activity of Ni cathodes is significantly greater on fresh electrodes than after several hours of electrolysis.5-10
The gradual decrease of the HER activity with time has been suggested to arise from the formation of a nickel hydride surface or bulk phase,8-11 similar to what is observed in acidic
media.12The formation of a hydride phase would change the electronic band structure, lower the
density of states near the electrode surface and, hence, would explain the lower HER activity.9, 10
Soares et al. detected small amounts of β-NiHx by X-ray diffraction (XRD) after they applied
large cathodic currents (-0.3 A cm-2) to nickel in concentrated electrolyte solutions [30 % (w/w)
KOH].10 To date, this is the only published report that provides direct evidence of
electrochemically formed nickel hydride in alkaline media. As such, Baranowski argues that only small amounts of nickel hydride can be formed in alkaline media, which further requires the use of high currents and very high pH electrolytes.13The uncertainty around nickel hydrides and Ni
cathode deactivation need to be determined due to the importance of large-scale water electrolysis.
To investigate the decrease in HER activity during alkaline electrolysis, this work examines the electrochemistry of smooth metallic Ni electrodes in basic solutions near the reversible hydrogen electrode (RHE) potential. By using smooth electrodes, we establish the electrode processes that are also expected to occur on high surface area Ni catalysts. We also avoid the instrumental complications that arise due to very large currents, which are typical for high surface area electrodes.
Furthermore, industrial electrolysers are often subject to transient current reversal, especially during initiation and shut-down. It is important to evaluate whether temporary anodic currents at a Ni catalyst will have adverse short- or long-term effects on its HER activity. Hence, this study also considers the electrode processes on smooth Ni electrodes up to 1.6 VRHE, which
is well into the oxygen evolution reaction (OER) region, and probes whether the Ni catalyst can be returned back to its original state.
Years of investigation have provided many clues to the identification of the electrochemical reactions on metallic Ni in basic media and yet these electrode processes have remained uncertain. The voltammetric features in these conditions have been attributed to the oxidation and reduction of nickel hydrides,10, 14-16nickel oxides and nickel hydroxides.17-23In this
work, we intend to present a clarified interpretation of the electrode processes on Ni in alkaline media that is supported by voltammetric, XRD and X-ray photoelectron spectroscopy (XPS) experiments as well as the published literature. The identification of the electrochemical reactions that occur at high currents and in strong alkaline media is believed to provide the basis for the consideration of methods that will improve the activity and stability of the electrodes.
2. Experimental Methods
2.1 Electrode Preparation
All voltammetric experiments used electrodes prepared from a metallic Ni rod (Alfa Aesar, ≥ 99 %, 3.2 mm diameter) embedded in epoxy resin so that only one flat, circular face was exposed to the electrolyte solution. All XPS experiments used metallic Ni foil (Alfa Aesar, 99.5 %, 0.787 mm thick) electrodes (1 cm × 2 cm). Electrodes were mechanically polished using 320 grit SiC paper followed by 9 μm polycrystalline diamond, 3 μm polycrystalline diamond (Buehler MetaDi Supreme) and 0.05 μm Al2O3 (Buehler MasterPrep) suspensions. XPS
electrodes were then attached to Ni wire (Alfa Aesar, 99.9 %, 0.065 mm diameter) by electric arc welding. Electrodes were rinsed and sonicated in high purity water (Millipore Milli-Q, 18.2 MΩ cm).
All X-ray diffraction (XRD) measurements used metallic Ni foil (Alfa Aesar, ≥ 99 %, 0.127 mm) electrodes (1 cm × 0.5 cm) that were attached to Ni wire by electric arc welding. The electrodes were washed with acetone, washed with ethyl alcohol and then sonicated in high purity water (Millipore Milli-Q, 18.2 MΩ cm). Immediately after, the substrates were cleaned in an acid bath [50 % (v/v) acetic acid, 30 % phosphoric acid, 10 % sulfuric acid, 10 % nitric acid, 85 °C] for 30 s and then rinsed again using excessive amounts of high purity water.
2.2 Electrochemical Experiments
For the 0.1 M KOH and 1 M NaOH solutions, a standard three-compartment glass cell was used while for the 30 % (w/w) KOH solution, a three-compartment Teflon cell was utilized. The working compartment was air-tight and purged with Ar gas (grade 5.0) or electrolytically
generated H2gas (Parker Hannifin H2PEM-165L, 99.9999 %). A Pt foil (≥ 3 cm2) served as the
counter electrode. For the galvanostatic experiments, a saturated calomel electrode (SCE) served as the reference electrode [E = -1.158 VRHE (30 % KOH)/E = -1.064 VRHE(1 M NaOH)] and for
the voltammetric experiments, a Hg/HgO reference was prepared with the same solution as the bulk electrolyte (E = -0.926 VRHE). The RE was separated from the working compartment by a
Luggin capillary. In the glass cell, the CE and RE compartments were separated from the working compartment by glass frits.
Voltammetric measurements were performed using a Solartron Analytical 1470E multistat controlled with MultiStat software (v. 1.5a, Scribner Associates Inc.). Galvanostatic treatments were performed using a Solartron Analytical 1287 potentiostat with CorrWare software (v. 3.3c, Scribner Associates Inc.).
Electrochemical impedance spectroscopy (EIS) measurements were performed using a Solatron 1260 controlled with ZPlot (v. 3.3c, Scribner Associates Inc.). Data was fit to an equivalent circuit consisting of solution resistance (Rs) in series with parallel charge transfer
resistance and double layer elements to estimate the Ohmic loss (IR drop). A constant-phase element was used for the double layer to account for the expected frequency dispersion.24 The
data fit the published generalized model well and the Rswas in the range 2 – 3 Ω.
2.3 X-ray Diffraction (XRD)
Following electrochemical treatments, samples were rinsed with high purity water and immediately transferred to a Bruker AXS low background, air-tight sample holder (A100B138-B141) that was purged with Ar. Samples were analyzed using a Bruker AXS D8 DISCOVER
diffractometer. Fixed incidence (5°) measurements were taken at 0.02° point-1 and 3 s point-1
using a Cu Kα X-ray source [λ(Kα1) = 1.541 Å; λ(Kα2) = 1.544 Å].
2.4 X-ray Photoelectron Spectroscopy (XPS)
Samples were analyzed with a Kratos Analytical Axis Ultra DLD equipped with a mono Al Kα X-ray source. High-resolution spectra of the Ni 2p and the C 1s regions were collected at 20 eV pass energy. All spectra were collected at a 54° take-off angle. Spectra were processed with CasaXPS (v. 2.3.16dev95, Casa Software Ltd.) using Shirley background corrections and the Ni 2p peak positions and widths for Ni metal, NiO, β-Ni(OH)2 and for the β-NiOOH
decomposition product, Ni3(OH)4O2, reported by Biesinger et al.25 The qualitative differences
between the Ni 2p peaks for α and β-Ni(OH)2 reported by Hall et al. were considered.26
Measured binding energies were adjusted to compensate for the shift that arises from a buildup of electrostatic charge by setting the adventitious hydrocarbon C 1s peak to a binding energy of 284.8 eV.25
3. Results and Discussion
3.1 Nickel Absorption and Nickel Hydrides
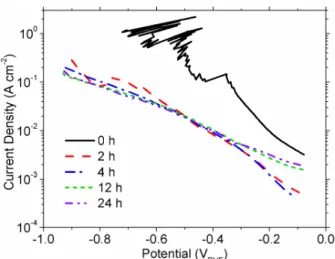
The HER activity was measured on a freshly polished Ni electrode and on Ni that was held for 2-4 h at -1 VRHE (uncorrected for Ohmic loss) to establish that electrode deactivation
occurs (Figure 1). Freshly polished electrodes show a large degree of variability, possibly introduced by the rapid blocking of the electrode surface by H2 gas bubbles and by the rapid
HER deactivation process. Near the RHE potential, the slope of the overpotential against logarithmic current density for a slow potential sweep [1 mV s-1 starting at -1 V
uncorrected)] is ~200 mV dec-1and the exchange current density is ~10-3A cm-2. After 2 – 4 h of
H2evolution at -1 VRHE(IR uncorrected), the slope near the RHE potential is largely unaffected.
However, the intercept decreases by an order of magnitude to ~10-4A cm-2. At potentials below
-0.5 VRHE, the slope is ~400 mV dec-1. The presence of two slopes may indicate different reaction
pathways in each potential range or it may indicate different rate-determining steps for a single, multi-step reaction pathway. After 12 – 24 h of H2 evolution, the slope is about 400 mV dec-1
over the entire potential range and the intercept is ~10-3 A cm-1. This indicates that the surface
state is completely changed and it may be possible that only one reaction pathway occurs. It is noteworthy that the results below -0.4 VRHEare very similar after 2 – 24 h of H2evolution, which
may indicate that the reaction pathways and rate-determining steps are the same in this potential range. The results from these measurements cannot be considered true Tafel parameters, because they were measured by a slow scan rather than steady-state polarization. Furthermore, slopes greater than 120 mV dec-1 at room temperature are anomalously high, rather than true Tafel,
slopes. However, these results demonstrate that electrode deactivation can negatively affect the HER on Ni cathodes by an order of magnitude or more after just one day of electrolysis. The transition between reaction pathways confirms that the chemical state of the electrode surface changes in the HER region. To determine the source of electrode deactivation, we discuss voltammetric and ex situ surface characterization results and consider the possible electrode processes within the HER region.
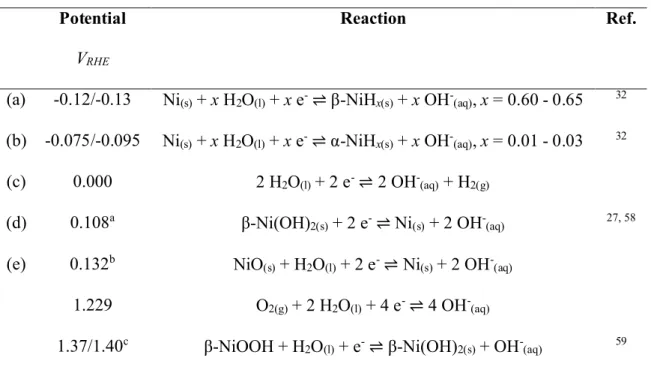
We determined the standard reduction potentials for several possible electrode processes near and below the RHE potential to consider the source of the electrode deactivation (Table 1, Figure 2). We do not include a potential for α-Ni(OH)2because its value has not been reported.
ageing process is spontaneous, the free energy must decrease, i.e., ΔG < 0, and it is concluded that the reduction potential of α-Ni(OH)2is positive to that of β-Ni(OH)2.
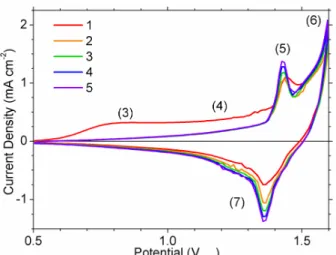
We have established several regions of interest during voltammetry, indicated
numerically in Figure 3, which will be referenced throughout the remainder of this work. Cyclic voltammetry (CV) on Ni in 0.1 M to 30 % (w/w) KOH and in 0.1 M to 1 M NaOH solutions are nearly identical when using a pH-independent reference electrode, although minor shifts in peak positions have been reported for different concentrations.20The cathodic peak (9) in Figure 3b is
highly-dependent on the upper potential limit, hence it is not observed in Figure 3a, as further discussed in section 3.2.
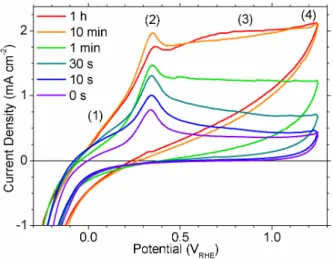
The anodic processes in regions (1) and (3) are found to be affected by the cathodic pre-treatment of the electrode prior to potential cycling. If the electrode is held at a potential negative to that of the RHE, the anodic current densities at regions (1) and (3) increase with longer holding times whereas the actual charge associated with peak (2) appears largely unaffected (Figure 4). For initial holding times longer than ~10 min, at -300 mVRHE, the change in anodic
current density of region (3) is less pronounced, although a very diffuse peak is observed at ~0.8 VRHE. At such long holding times, the anodic charge at peak (2) appears to decrease slightly.
However, this decrease may arise from the changing shape of the large background current that spans regions (1) and (3).
Furthermore, the anodic current densities in regions (1) and (3) also depend on the initial potential chosen for the CVs (Figure 5). For initial potentials below -0.1 VRHE, the charge
associated with peak (2) reaches a maximum. In contrast, the current densities in regions (1) and (3) increase as the starting potential decreases. For starting potentials positive to 0.2 VRHE, the
holding times on the voltammetry of Ni electrodes have been reported using 1 M KOH22and 0.5
M NaOH solutions.11
The anodic currents in the regions (1), (2) and (3) are sometimes attributed to the formation of a nickel oxide or hydroxide film of limited thickness.5, 18-21, 23, 27, 28The observed
properties of voltammetric peak (2) are consistent with this argument (see section 3.2), but this explains neither the dependence of the current density of regions (1) and (3) on the cathodic pre-treatment time and potential nor the breadth of these anodic features. Thus, we consider an alternate explanation, namely, the incorporation of hydrogen into the Ni metal.6, 10, 16, 29 The
amount of hydrogen incorporated into the material depends on the time and rate of its absorption, the latter of which depends on the cathodic overpotential. Upon scanning the potential to more positive values, the incorporated hydrogen is oxidized at the electrode surface. This process is limited by the solid-state diffusion of hydrogen to the surface and, thus, a broad voltammetric feature is observed rather than a well-defined peak. We observe that the current density of the oxidation process in region (3) is approximately proportional to the scan rate raised to the exponent of 0.83 (Figure 6a). This scan-rate dependence neither fits a surface process (exponent of unity) nor a process that is limited by linear diffusion (exponent of one half). Gravimetric measurements, collected with an electrochemical quartz crystal microbalance (EQCM), have shown that the electrode mass decreases during a forward potential sweep in region (1), which supports the proposal that incorporated H is removed from the structure in this region. During potential cycling in this general potential range, gravimetric measurements form a closed loop, which indicates that no electrode dissolution occurs. This study also showed that alkali cations are not involved in the surface electrochemistry below ~1.2 VRHE.30This allows free comparison
between experiments in NaOH and KOH solutions, although ionic strength differences, and thus differences in the activity of OH-, are relevant at very high concentrations.31
From the hydrogen absorption model presented thus far, one would expect that if the forward scan is reversed within region (3), the anodic current will not immediately cease since it is primarily controlled by diffusion rather than by the overpotential. The current density is seen to drop quickly on scan reversal. However, the current remains anodic during the reverse scan (Figure 7), which is consistent with oxidation of incorporated H. The hydrogen oxidation current after reversal is larger for electrodes initially held longer in the cathodic potential region, which can be explained by an increase in hydrogen content (Figure 4). The remainder of the anodic current during the forward scan in region (3) is attributed to a concurrent anodic process, which is dependent. This is partially explained by the existence of variable, potential-dependent stable hydrogen concentrations as proposed by Conway et al.16 and previously
measured for pure and mixed α/β-NiHx electrodes below -100 mVRHE.32 However, this alone
seems insufficient to rationalize the potential-dependence and, hence, we propose that oxidation of the nickel metal also contributes to the net anodic current within region (3), which further complicates the scan-rate dependence observed in Figure 7. This oxidation process is discussed in detail in section 3.2.
To recover the oxidation currents in regions (2) and (3) after the first cycle, one must scan to sufficiently negative potentials (Figure 7). Note that the current density in region (3), proposed to correspond to the oxidation of absorbed hydrogen, is not fully restored even when the lower scan limit is the same as the initial potential. This is because we did not hold the electrodes at the negative limit after the first cycles and, thus, the amounts of hydrogen in the electrodes was lower than during the initial scans.
The incorporation of H into Ni electrode materials has been proposed to occur by either H permeation into interstitial sites in the Ni metal9, 29, 33, 34 or by a phase transition to a nickel
hydride.10, 11, 14-16 However, there is some dispute regarding whether a true bulk hydride phase
can be formed under these conditions.13There are two bulk phases, α and β, which draw their
nomenclature from the palladium hydrides.35 β-NiH
xhas a fcc lattice structure with the H atoms
in the octahedral sites and x = 0.6 ± 0.1.36The β phase lattice parameter is ~6 % greater than that
of Ni metal.36, 37 The lattice parameter of α-NiH
x is only slightly expanded relative to Ni metal
(less than ~1 %), supporting the general belief that it is isostructural with α-PdHx.38, 39 The H
atoms in α-PdHx occupy the octahedral interstitial sites and x ≤ 0.03.35, 38 The full dimensional
and energetic sequence of nickel hydrides has been discussed previously.13
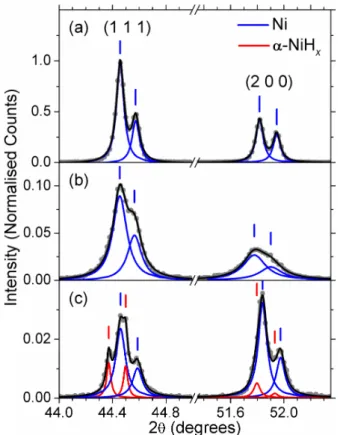
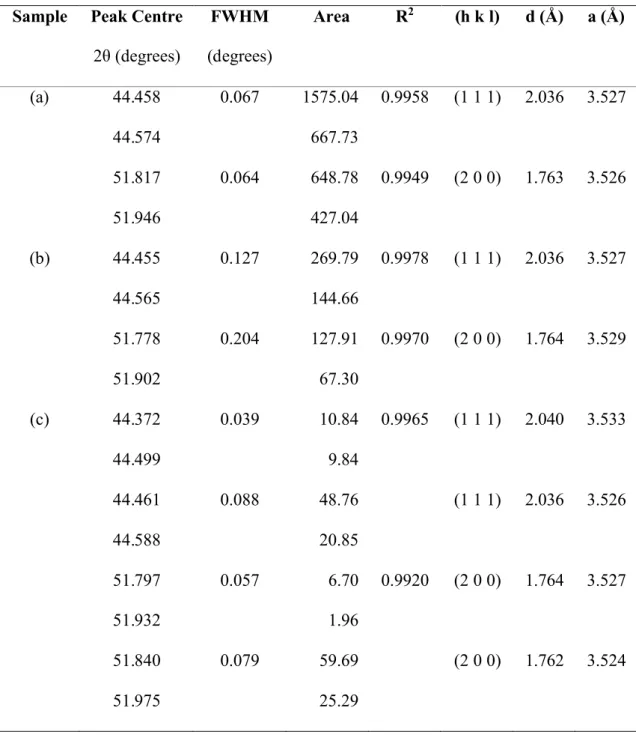
The XRD pattern of a freshly polished electrode shows the expected fcc Ni (1 1 1) and (2 0 0) peaks (Figure 8a).The diffraction peaks appear as doublets because the incident X-ray is split by spin-orbit coupling into Kα1(2p3/2 1s) and Kα2(2p1/2 1s) components. The weak (2
2 0) peaks at 76.32° and 76.54° were also observed. The diffraction peaks shown in Figure 8 were fit using the Lorentzian curve shape and the parameters listed in Table 2.
Ni was cathodically charged by applying -0.5 A cm-2. We chose this large geometric
current density to accelerate the electrode deactivation. Ni that was charged in 1 M NaOH produces much weaker and broader diffraction lines than observed for the untreated sample (Figure 8b, Table 2). The (2 0 0) peak positions are shifted slightly, relative to Ni, whereas the (1 1 1) peaks are not. XRD peak widths generally originate from the combined effects of the detector resolution, crystallite size and non-uniform lattice strain. We disregard the first factor because the samples were analyzed using the same diffractometer. The latter two effects can be differentiated by the Williamson-Hall analysis method, however, at least three strong diffraction
peaks are needed to properly conduct this analysis.40Nevertheless, Figure 8b qualitatively shows
that a structural change in the Ni metal occurs during cathodic charging, which supports that H is incorporated into the material. We expect that H atoms move most rapidly into the electrode along grain boundaries and dislocation defects, where the diffusivity is the greatest, i.e., by short-circuit diffusion, and more slowly by diffusion into the lattice.41 The origin of the (2 0 0) peak
shift is unknown. The samples were not perfectly flat, thus, the relative peak intensities between samples are not quantitative.
Ni charged cathodically in 30 % (w/w) KOH shows an additional pair of (1 1 1) peaks, which correspond to ~0.2 % lattice parameter expansion relative to metallic Ni (Figure 8c, Table 2). Because two pairs of peaks are observed, rather than a broadened, shifted pair of peaks, we know that there are two distinct crystallographic phases present. Hence, we propose that the H concentration near the grain edges builds up and, when the H concentration exceeds some critical value, metallic Ni transforms to α-NiHx. The formation of nickel hydrides has previously been
observed to act as a barrier to further H diffusion.9Thus, the grain centres remain metallic Ni and
the Ni diffraction peaks are sharper than for Ni charged in milder conditions. These results suggest that the rate of H absorption into Ni electrodes increases with solution alkalinity.
Soares et al. have provided the only other direct evidence of electrochemically formed bulk NiHx in alkaline media without the addition of agents, such as thiourea [SC(NH2)2] and
arsenic trioxide (As2O3), that are known to promote hydride formation.10, 13Electrodeposited Ni
was cathodically charged (-0.3 A cm-2) for 2 h in 30 % (w/w) KOH and weak β-NiH
x(1 1 1) and
(2 0 0) XRD peaks were measured.10Our attempts to emulate these results only yielded Ni and
α-NiHxdiffraction peaks (Figure 8c). However, we now believe that our results differed because
experiments and the diffusion of H deep into the material prevented the H concentration at the surface from increasing sufficiently to form the β-NiHx phase. Soares et al. used very thin Ni
electrodes (~15 μm thick) and, hence, the H content of the metal accumulated and concentrations along the grain boundaries increased rapidly during charging. Thus, the surface H concentrations increased sufficiently that β-NiHx formed at the surfaces of their electrodes. We now conclude
that the results of Soares et al. are indeed consistent with our own and it is reasonable to assume that the α-NiHxphase also formed at their electrode surfaces, as a precursor to the β-NiHxphase.
However, since only the bases of the Ni peaks are visible in their reported XRD patterns and since their detector resolution was lower than ours, one cannot determine whether any α-NiHx
remained at the surface or whether it was completely consumed during the formation of the β-NiHxphase.10
The incorporation of H into Ni electrodes may explain the observed decrease in HER activity after several hours of electrolysis. The HER activity on freshly polished metallic Ni electrodes is quite high (Figure 1). With time, the H content of the electrode increases, which causes structural disorder, similar to what we observed in our XRD patterns (Figure 8b). This disorder may cause the decreased intercept observed in Figure 1 after 2 – 4 h of H2evolution.
The change of the slope below -0.4 VRHE after 2 – 4 h of H2evolution indicates that there is a
change in the rate-determining step, either because the HER is a multi-step reaction or because the reaction pathway changes. For example, the slope may be related to the concentration of H at the electrode surface, which depends on the potential-dependent rate of H incorporation and on the diffusion of H in the material. In this interpretation, the region η < -0.4 VRHEcorresponds to
greater H content at the surface, which could affect the kinetic parameters by an increase in structural disorder or by a phase transformation at the surface. For longer charge times, e.g., 12 –
24 h, more H is expected to have accumulated and hence, the slope and intercept that corresponds to greater H content are observed across the entire potential range. This hypothesis is consistent with our findings, although it is only one possible explanation. More detailed studies are needed to clarify the cause of the observed changes of the slope and intercept. Nevertheless, the results in this work support that H incorporates into Ni electrodes during the HER and that the resultant structural effects at the surface, i.e., increased disorder and phase transformations, negatively affect the kinetics of the HER.
We conclude from the voltammetric and XRD evidence that during the HER in alkaline media, H diffuses into metallic Ni electrodes. This introduces structural changes and can lead to the formation of α-NiHxand β-NiHxphases. Even though the latter has only been observed on a
very thin electrode in concentrated KOH, it is reasonable to believe that this phase could form in industrial electrolysers, which use concentrated KOH, apply very large current densities and typically operate for over 10 years. The incorporation of H into Ni electrodes can adversely affect the kinetics of the HER in alkaline media. Above the RHE potential, incorporated H oxidizes as it diffuses to the electrode surface. However, other, concurrent processes can make experimental results difficult to interpret.
3.2 Nickel Oxide and Nickel Hydroxides
Industrial electrolysers are often subject to transient current reversal, especially during initiation and shut-down. Thus, we considered the anodic processes on Ni and the effect they may have on a catalyst’s HER activity. Anodic currents from the oxidative removal of incorporated H, discussed in section 3.1, have often been attributed to oxide and hydroxide formation. Further, recent studies offer new insight on the phases of Ni(OH)2and can be used to
re-interpret older reports. This section considers the Ni(II) species that form on metallic Ni electrodes in alkaline media and clarifies the voltammetric assignments (Figure 3, Table 3).
It is known that an air-formed oxide, 6 – 8 Å thick, rapidly forms on Ni metal that has been mechanically or electro-polished.42The details of this surface layer and the passive layers
that form on Ni electrodes immersed in various electrolytes have been studied extensively, although there is no consensus on their compositions.43-46 MacDougall and Cohen observed
reflection high energy electron diffraction (RHEED) peaks on electropolished Ni from non-stoichiometric NiOx, x ≥ 1, with ~2 % lattice parameter expansion.42Hall et al. observed a weak
Raman peak from NiO (or NiOx) on chemically polished Ni.26 Raman spectroscopy cannot
usually detect very thin surface layers; however, this particular peak arises from a magnetic transition and is very sharp and intense.47The XPS spectra of mechanically polished Ni indicate
that there is a NiO component (Figure 9a-i, b), which we assume is indistinguishable from NiOx
by this method. The XPS spectra also reveal a Ni(OH)2 component that was not observed by
RHEED or Raman spectroscopy.26, 42Using the XPS line shape for a β-Ni(OH)
2component, the
fitted curve does not exactly match the data at 858 – 859 eV (Figure 9a-i), similar to what is reported for α-Ni(OH)2 deposits.26 The α phase typically adopts a high degree of structural
disorder, hence it may not be possible to detect very thin α-Ni(OH)2 films by RHEED or by
Raman spectroscopy. Medway et al. observed X-ray scattering evidence consistent with a layered surface structure in the sequence Ni|NiO|Ni(OH)2.48 Since β-Ni(OH)2 has sharper
diffraction features than α-Ni(OH)2, the absence of any β phase RHEED peaks indicates that it is
not present in the air-formed film.42 Therefore, from the combined results of XPS, RHEED,
mechanically polished Ni surfaces is a bilayer composed of α-Ni(OH)2 underlaid by
non-stoichiometric NiOx.
We measured the open circuit potential (EOC) of mechanically polished Ni in
argon-purged, alkaline solutions at about 0.4 – 0.5 VRHE, which is consistent with previous reports.22
The reversible potential of the α-Ni(OH)2surface component is not known exactly, however, it is
greater than 0.108 VRHE (see section 3.1). The non-stoichiometric NiOx surface layer likely
contains Ni2+vacancies, similar to passive NiO
xlayers,45which would create a fractional Ni(III)
character and, hence, may increase the EOCabove that of ideal NiO (0.132 VRHE).
On the first reverse potential scan after electrode immersion, a cathodic peak nearly identical to peak (9) is observed and it has been shown that the electrode mass decreases.49
Ellipsometry measurements during this first reverse scan show that the surface layer is mostly removed at about -300 mVRHE, although, a small surface layer remains.23 There is no evidence
supporting the possibility of a true metal-solution interface in alkaline solution, however, the existence of a small amount of unreactive nickel oxide-hydroxide does not change our interpretation of the voltammetric features. It may, however, affect the scan-rate dependences of some processes and the catalytic activity for the HER on Ni.
On the basis of reversible potentials (Table 1), it has been suggested that the voltammetric peaks (2) and (9) correspond to the formation and reduction, respectively, of a Ni(II) species,5, 19-21, 27while other studies specify that the oxidation product is α-Ni(OH)
2.17, 18, 23, 28 There are three possible oxidation products – NiO
x, α-Ni(OH)2 and β-Ni(OH)2 – and
rationalizing electrochemical data is further complicated by the range of possible disordered structures that Ni(OH)2 electrode materials can adopt.26 The partial reduction of the air-formed
in alkaline electrolyte prior to voltammetry experiments decreases the charge under the anodic peak (2).22X-ray scattering shows that the surface layer thickens, relative to the air-formed film,
upon immersion in alkaline solution.48 Further, it is well-established that α-Ni(OH)
2 gradually
transforms to β-Ni(OH)2in alkaline media. The β phase is generally more crystalline and is more
stable in alkaline media than the α phase,26so it may be reasonable to assume that the β phase
reduces at more negative potentials than α-Ni(OH)2, although this cannot be stated with certainty
unless the thermodynamic and kinetic parameters are known. Thus, more negative overpotentials or longer treatment times are required to remove the air-formed layer after it has been aged in alkaline solution because the layer is more stable and/or the surface layer has thickened. Since the surface layer must be removed for peak (2) to occur, fractional reduction of the surface layer would subsequently result in a fractional anodic current density at (2).
Ellipsometry measurements performed during a forward voltammetric sweep in 0.1 M KOH show that an oxide and/or hydroxide film forms at peak (2).46Ultraviolet/visible (UV/vis)
range reflectance measurements performed in situ during a forward voltammetric sweep in 0.1 M NaOH show that new reflectance peaks develop at anodic peak (2).50Gravimetric measurements
show the electrode mass increases in region (2), although the mass of the oxidation product is obscured by the concurrent removal of H from the Ni metal.30, 49These results show that a Ni(II)
surface layer forms at peak (2).
The UV/vis reflectance data collected during forward potential sweeps in region (2) have been used to create a reference spectrum for α-Ni(OH)2.50 However, the reported reflectance
features are very broad and there are no reports of the typical reflectance spectra for the possible surface layers, i.e., NiOx, α-Ni(OH)2 and β-Ni(OH)2 materials. Further, the possible effects of
conclusively determine the composition of the surface layer at the voltammetric region (2). As such, we used the results of our recent spectroscopic investigation of Ni(OH)2materials26to
re-examine the in situ surface-enhanced Raman spectroscopy (SERS) results reported by Melendres and Pankuch.44The authors collected SERS spectra on Ni electrodes in 0.1 M NaOH during 1 h
potentiostatic treatments at various potentials. We note that it is possible that some α-Ni(OH)2
may have chemically transformed to β-Ni(OH)2during the 1 h treatment periods. Also, the O-H
stretching modes of H2O are convoluted with their data over the frequency range 3000 – 3700
cm-1. Further, the surface selection rules for SERS are difficult to predict and are often quite
different than for conventional Raman spectroscopy. With these caveats in mind, the reported spectrum for an electrode held at region (2) contains weak Raman peaks at ~450 cm-1 and ~800
cm-1, which we here ascribe to a lattice mode and a 2ndorder lattice mode of α-Ni(OH)
2. There is
a very weak feature at ~510 cm-1that we ascribe to NiO
x. We make the assumption that the
non-stoichiometric material has the same vibrational modes as a non-stoichiometric NiO sample.44
Melendres and Pankuch report a broad feature at ~3630 cm-1, which we now attribute to the O-H
stretching modes of α-Ni(OH)2. It is known that the two phases of Ni(OH)2 are most easily
differentiated by the O-H stretching region and that β-Ni(OH)2has stronger vibrational features
than α-Ni(OH)2.26 Hence, the β phase is either absent or, at most, present as a very minor
component of the surface film in this region. Thus, from our re-examination of the SERS results of Melendres and Pankuch we conclude that the surface layer formed at region (2) contains α-Ni(OH)2 and NiOx components. As such, the UV/vis spectrum reported by Hahn et al. is not a
true reference spectrum for α-Ni(OH)2and the biphasic nature of the film explains the breadth of
We observe that the anodic maximum of peak (2) is proportional to the scan rate raised to the exponent 0.76 (Figure 6). To simplify the problem, one can attribute the current in region (3) entirely to H oxidation. If the average anodic current in region (3) is subtracted from region (2) the exponent of the scan-rate dependence of peak (2) is ~0.5, i.e., the square root of the scan rate. This suggests that the surface oxidation is limited by the linear diffusion of either OH-/O2- into
the surface layer or Ni2+out to the electrode-solution interface.
It has been suggested that the hydroxide film thickens and transforms to β-Ni(OH)2in the
potential regions (3) and (4).17, 18, 23The intensities of XPS (Figure 9b), ellipsometric and UV/vis
features support that during a forward potential sweep the surface layer indeed thickens in regions (3) and (4) at an approximately constant rate.44, 46, 50 We again re-examine the SERS
spectra collected during voltammetry by Melendres and Pankuch.44 The absence of any sharp
SERS features in the O-H stretching region44indicates that there is very little, if any, β-Ni(OH) 2
present at the surface in voltammetric region (3). We here assign the reported SERS peaks to α-Ni(OH)2 (456 cm-1, ~800 cm-1 and ~3630 cm-1) and NiOx (512 cm-1). In the SERS spectrum
collected on an electrode that was held in potential region (4), sharp peaks are visible at ~3580 cm-1and ~3635 cm-1.44We now conclude that these peaks correspond to the β-Ni(OH)
2A1gand
A2u modes, respectively. The A2u mode is not normally active in Raman spectroscopy.26
However, the surface selection rules can cause ‘IR-active’ modes to appear in SERS spectra. The presence of a large fluorescent background in the reported SERS spectrum,44 which is
characteristic of the Raman spectra of β-Ni(OH)2films,26supports this assignment. There is also
a broad underlying feature at ~3635 cm-1, which we attribute to an α-Ni(OH)
2component. The β
phase typically has more intense Raman signals than α-Ni(OH)2,26hence, the β-Ni(OH)2peak at
in region (4), which indicates that the surface layer becomes more ordered. The transformation of α-Ni(OH)2 to β-Ni(OH)2 may not be observable from the lattice modes, since the surface
selection rules are unknown and both materials have vibrational modes at ~450 cm-1. The
voltammetric properties of the subsequent peaks (5) and (7) are consistent with a surface layer that contains both α and β-Ni(OH)2components by the end of region (4). Structural disorder and
an underlying NiOxfilm are expected to influence the optical properties of the surface layer and,
thus, ellipsometry was unable to confirm the surface species.46During a forward potential sweep
in regions (3) and (4), the electrode mass is unchanged because incorporated H is removed while the film thickens.30, 49
The voltammetric behaviour after the first cycle depends on the upper and lower limits. For more positive limits, the film requires more negative potentials to reduce. This is attributed to a more stable surface layer with greater crystallinity and higher β-Ni(OH)2 content. For
insufficiently negative lower limits, only small cathodic currents are observed (Figure 7). During the reverse scan H is incorporated in to the electrode and the mass increases slightly. During the forward scan the electrode mass decreases slightly as the incorporated H is removed.49
In summary, from voltammetric, XPS and literature evidence, we find that polished Ni electrodes have a thin, air-formed bilayer of NiOx and α-Ni(OH)2. This surface layer can be
mostly removed cathodically at peak (9), although ageing in basic solution makes this layer more difficult to remove. Anodic peak (2) corresponds to the formation of α-Ni(OH)2and NiOx. The
anodic charge under this peak has been used to estimate surface roughness.11, 17 However, we
recommend that this should only be used for an approximate value because of the complex factors that affect this region and the poorly defined unit cell parameters of α-Ni(OH)2.51, 52The
surface film thickens in regions (3) and (4). In region (4), some β-Ni(OH)2 is formed, either
electrochemically or by the chemical ageing of the α-Ni(OH)2component.
3.3 Nickel Oxyhydroxides
The anodic peak (5) is attributed to the formation of β-NiOOH, which we observe by XPS analysis (Figure 9a-iv). This phase cannot be measured ex situ because it decomposes in ambient conditions. Rather, the decomposition product, Ni3(OH)4O2, was characterized as per
Biesinger et al. and Grosvenor et al.25, 53Thus, one cannot conclude from XPS results alone that
the anodic peak (5) corresponds to the formation of β-NiOOH, rather than Ni3(OH)4O2. The local
maxima in Figure 9a-iv (855.5 eV and 860.9 eV) are slightly higher than we observe for Ni(OH)2
samples (855.3 eV and 860.7 eV). Further, the voltammetric features match those reported by Visscher and Barendrecht, who observed the formation of β-NiOOH by in situ ellipsometry.46A
β-Ni(OH)2component was not used while fitting these spectra because any Ni(II) is expected to
have mostly oxidized. Further, it is difficult to deconvolute β-Ni(OH)2 and β-NiOOH
components in XPS spectra. The presence of a NiOx component is consistent with a previously
reported underlying layer that thickens at more positive potentials, well into the OER region.48
We observe that the anodic maximum of peak (5), background-corrected using region (4), is proportional to the scan rate raised to the exponent of ~0.6 (Figure 6b), which could indicate that the reaction is diffusion-limited. Indeed, the oxidation of β-Ni(OH)2is largely agreed to be
limited by the movement of H+through the material to the electrode-solution interface,54which
would yield an exponent of 0.5. Conversely, the mechanism for α-Ni(OH)2 oxidation is
The conversion of Ni(OH)2 electrode materials to NiOOH is used extensively for the
anodes of secondary alkaline batteries, including NiCd and NiMH.55 At sufficiently positive
potentials, β-NiOOH overcharges and forms γ-NiOOH, which contains alkali cations and is often described to fractionally contain Ni(4).52This latter phase is not expected at the upper scan limits
used in this work and is not observed in our XPS spectra.
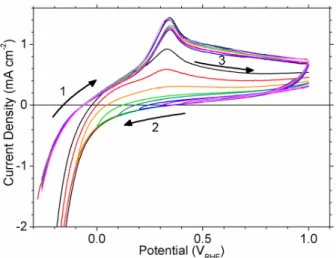
On potential scan reversal, we observe two cathodic peaks in region (7) from the removal of adsorbed O species and the reduction of β-NiOOH to β-Ni(OH)2.46, 52Reduction of β-NiOOH
yields only β-Ni(OH)2 and the shapes of the reduction peaks in region (7) do not change on
cycling (Figure 10).46However, the oxidation peak (5) is sharper after the first cycle. Thus, the
broad voltammetric peak during the first cycle corresponds to the oxidation of α-Ni(OH)2,
whereas the sharp peak during subsequent scans is from the oxidation of β-Ni(OH)2. The charge
associated with peaks (5) and (7) increase with cycling, presumably because the repeated lattice contraction and expansion from oxidation and reduction exposes more of the underlying metal.
During the reverse potential scan, there is a small anodic current density between ~0.3 to ~0.7 VRHE from the oxidation of incorporated H. The magnitude of this current is considerably
less than for electrodes that are not cycled through the Ni(II)/Ni(III) redox region (e.g. Figure 4 vs. Figure 5), which demonstrates that the H diffusivity of the compact, crystalline β-Ni(OH)2
layer is much lower than it is for a disordered α-Ni(OH)2surface layer.
4. Conclusions
The electrode processes are summarized by the potential regions indicated in Figure 3 (Table 3). The complexity of the voltammetry of metallic Ni in basic media results from the oxidation of H2O/OH-, Ni, NiHabs, NiOx and α/β-Ni(OH)2 species during the forward scan and
the reduction of H2O/OH-, β-NiOOH, α/β-Ni(OH)2 and NiOxduring the reverse scan. Many of
these processes occur concurrently and depend on the electrode history. The transformation of α-Ni(OH)2 to β-Ni(OH)2and the various types and degrees of structural disorder further increase
the complexity of this electrochemical system.
The decrease in HER activity on metallic Ni cathodes with time appears to be attributable to the incorporation of H into electrode material. During prolonged cathodic polarization in alkaline electrolyte solutions, α-NiHxand β-NiHxmay form at the electrode surface. The addition
of hydridic H into the electrode alters the electronic structure near the electrode/solution interface and adversely affects the HER activity. Reported voltammetric evidence at 77 °C is consistent with H incorporation,56although, further investigation is needed to determine whether
α- or β-NiHx can form at the temperatures typically used for industrial electrolysis (i.e. 50 – 80
°C4).
Transient anodic currents can occur at the cathode in industrial electrolysers during initiation and shut-down, thus, we have assessed the oxidation processes on smooth Ni and their potential impact on the cathode’s performance. The oxidation products have negligible solubility in alkaline media and, from the recovery of peak (2) after cathodic treatment, they are observed to reduce back to the initial state at about -300 mVRHE (Figure 7). However, lattice expansion and
contraction occurs on cycling, which creates mechanical stress and roughens smooth Ni electrodes. This may increase the electrochemical surface area, which would actually improve an electrode’s performance. However, the mechanical strain may damage or destroy high surface area materials. Although there is no lasting chemical change from transient anodic currents, cathodes must be able to endure repeated expansion and contraction at the surface.
Voltammetry on metallic Ni electrodes in alkaline solution is very difficult to reproduce to a satisfactory degree of precision, even if solutions are replaced and electrodes are polished between each experiment. Such difficulties dealing with Ni in alkaline media have been stressed previously.57 We now understand that the accumulation of H, relatively deep within the
electrode, causes experimental drift. Hence, strict adherence to random experimental order is very important to avoid systematic errors and electrodes should be regularly cut or polished with a coarse abrasive to remove as much of the affected surface material as possible. Finally, electrodes may require periodic replacement to collect sufficiently high quality data for fundamental studies.
5. Acknowledgements
This work was supported by National Research Council Canada (NRC) and the Natural Sciences and Engineering Research Council of Canada (NSERC). The authors acknowledge the contributions of David J. Lockwood (NRC-Measurement Science and Standards) for valuable discussions and suggestions regarding the re-interpretation of the SERS work of Melendres and Pankuch, Bussaraporn Patarachao (NRC-EME) for assistance collecting and interpreting XRD patterns, Yvon Le Page (NRC-EME) for assistance interpreting XRD patterns and David Kingston (NRC-EME) for assistance collecting XPS spectra.
6. References
1. K. Zeng and D. Zhang, Progr. Energy Combust. Sci., 36, 307 (2010).
2. IEA Energy Technology Essentials: Hydrogen Production & Distribution, in, International Energy Association (2007).
3. S. Dunn, Int. J. Hydrogen Energy, 27, 235 (2002).
4. D. Pletcher, X. Li and S. Wang, Int. J. Hydrogen Energy, 37, 7429 (2012).
5. R. M. Abouatallah, D. W. Kirk, S. J. Thorpe and J. W. Graydon, Electrochim. Acta, 47, 613 (2001).
6. S. A. S. Machado, J. Tiengo, P. de Lima Neto and L. A. Avaca, Electrochim. Acta, 39, 1757 (1994).
7. A. C. Makrides, J. Electrochem. Soc., 109, 977 (1962).
8. H. E. G. Rommal and P. J. Moran, J. Electrochem. Soc., 132, 325 (1985). 9. H. E. G. Rommal and P. J. Morgan, J. Electrochem. Soc., 135, 343 (1988). 10. D. M. Soares, O. Teschke and I. Torriani, J. Electrochem. Soc., 139, 98 (1992). 11. S. A. S. Machado and L. A. Avaca, Electrochim. Acta, 39, 1385 (1994).
12. R. Jus̆kėnas, A. Selskis and V. Kadziauskienė, Electrochim. Acta, 43, 1903 (1998). 13. B. Baranowski, J. Electroanal. Chem., 472, 182 (1999).
14. M. Bernardini, N. Comisso, G. Davolio and G. Mengoli, J. Electroanal. Chem., 442, 125 (1992).
15. M. Bernardini, N. Comisso, G. Mengoli and L. Sinico, J. Electroanal. Chem., 457, 205 (1998).
16. B. E. Conway, H. Angerstein-Kozlowska, M. A. Sattar and B. V. Tilak, J. Electrochem. Soc., 130, 1825 (1983).
17. M. Alsabet, M. Grden and G. Jerkiewicz, Electrocatalysis, 2, 317 (2011). 18. B. Beden, D. Floner, J. M. Leger and C. Lamy, Surf. Sci., 162, 822 (1985). 19. L. D. Burke and T. A. M. Twomey, J. Electroanal. Chem., 134, 353 (1982). 20. L. D. Burke and T. A. M. Twomey, J. Electroanal. Chem., 162, 101 (1984). 21. L. D. Burke and D. P. Whelan, J. Electroanal. Chem., 109, 385 (1980).
22. A. Seghiouer, J. Chevalet, A. Barhoun and F. Lantelme, J. Electroanal. Chem., 442, 113 (1998).
23. W. Visscher and E. Barendrecht, Electrochim. Acta, 25, 651 (1980).
24. V. M.-W. Huang, V. Vivier, M. E. Orazem, N. Pebere and B. Tribollet, J. Electrochem. Soc., 154, C99 (2007).
25. M. C. Biesinger, B. P. Payne, L. W. M. Lau, A. Gerson and R. S. C. Smart, Surf. Interface Anal., 41, 324 (2009).
26. D. S. Hall, D. J. Lockwood, S. Poirier, C. Bock and B. R. MacDougall, J. Phys. Chem. A,
116, 6771 (2012).
27. A. Bard, R. Parsons and J. Jordan, Standard Potentials in Aqueous Solution, International Union of Pure and Applied Chemistry, New York, New York (1985).
28. M. Vuković, J. Appl. Electrochem., 24, 878 (1994).
29. R. M. Abouatallah, D. W. Kirk and J. W. Graydon, Electrochim. Acta, 47, 2483 (2002). 30. M. Grdeń and K. Klimek, J. Electroanal. Chem., 581, 122 (2005).
31. J. F. J. Zemaitis, D. M. Clark, M. Rafal and N. C. Scrivner, Handbook of aqueous electrolyte thermodynamics: Theory & application, p. 852, Design Institute for Physical Property Data, New York (1986).
33. M. A. V. Devanathan and Z. Stachurski, Proc. R. Soc. Lond. A, 270, 90 (1962).
34. E. Gileadi, E. Kirowa-Eisner and J. Penciner, in Interfacial Electrochemistry: An Experimental Approach, p. 472, Addison-Wesley Publishing Company, Inc., Don Mills, Ontario (1975).
35. T. B. Flanagan and F. A. Lewis, Trans. Farad. Soc., 55, 1400 (1959).
36. E. O. Wollan, J. W. Cable and W. C. Koehler, J. Phys. Chem. Solids, 24, 1141 (1963). 37. Z. Szklarska-Smialowska and M. Smialowski, Bull. Acad. Pol. Sci., Ser. Sci. Chim., 6,
427 (1958).
38. B. Baranowski, S. Majchrzak and T. B. Flanagan, Journal of Physics F: Metal Physics, 1, 258 (1971).
39. T. Boniszewski and G. C. Smith, J. Phys. Chem. Solids, 21, 115 (1961). 40. G. K. Williamson and W. H. Hall, Acta Metallurgica, 1, 22 (1953).
41. M. R. Louthan Jr, J. A. Donovan and G. R. Caskey Jr, Acta Metallurgica, 23, 745 (1975). 42. B. MacDougall and M. Cohen, J. Electrochem. Soc., 121, 1152 (1974).
43. B. MacDougall, D. F. Mitchell and M. J. Graham, J. Electrochem. Soc., 127, 1248 (1980).
44. C. A. Melendres and M. Pankuch, J. Electroanal. Chem., 333, 103 (1992). 45. E. Sikora and D. D. Macdonald, Electrochim. Acta, 48, 69 (2002).
46. W. Visscher and E. Barendrecht, Surf. Sci., 135, 436 (1983).
47. D. J. Lockwood, M. G. Cottam and J. H. Baskey, J. Magn. Magn. Mater., 104-107, Part
2, 1053 (1992).
48. S. L. Medway, C. A. Lucas, A. Kowal, R. J. Nichols and D. Johnson, J. Electroanal. Chem., 587, 172 (2006).
49. M. Grdeń, K. Klimek and A. Czerwinski, J. Solid State Electrochem., 8, 390 (2004). 50. F. Hahn, B. Beden, M. J. Croissant and C. Lamy, Electrochim. Acta, 31, 335 (1986). 51. R. S. McEwen, J. Phys. Chem., 75, 1782 (1971).
52. P. Oliva, J. Leonarki, J. F. Laurent, C. Delmas, J. J. Braconnier, M. Figlarz, F. Fievet and A. de Guibert, J. Power Sources, 8, 229 (1982).
53. A. P. Grosvenor, M. C. Biesinger, R. S. C. Smart and N. S. McIntyre, Surf. Sci., 600, 1771 (2006).
54. J. L. Bantignies, S. Deabate, A. Righi, S. Rols, P. Hermet, J. L. Sauvajol and F. Henn, J. Phys. Chem. C, 112, 2193 (2008).
55. D. Linden, Handbook of Batteries, Mc-Graw-Hill, New York (1995).
56. M. F. Kibria, M. S. Mridha and A. H. Khan, Int. J. Hydrogen Energy, 20, 435 (1995). 57. A. Lasia and A. Rami, J. Electroanal. Chem. Interfacial Electrochem., 294, 123 (1990). 58. F. D. Rossini, D. D. Wagman, W. H. Evans, S. Levine and I. Jaffe, Selected Values of
Chemical Thermodynamic Properties, National Bureau of Standards (1952). 59. R. Barnard, C. F. Randell and F. L. Tye, J. Appl. Electrochem., 10, 109 (1980). 60. H. Bode, K. Dehmelt and J. Witte, Electrochim. Acta, 11, 1079 (1966).
61. B. J. Boyle, E. G. King and K. C. Conway, J. Am. Chem. Soc., 76, 3835 (1954).
62. T. Engel and P. Reid, Thermodynamics, Statistical Thermodynamics, & Kinetics, Benjamin Cummings, Toronto (2006).
Figure 1 The HER activity of a freshly polished Ni electrode and Ni electrodes held at -0.5 A cm-2 various time periods as measured at 1 mV s-1 in H
2-purged 30 % (w/w)
KOH. The Ohmic loss (IR drop) was estimated from EIS measurements taken after 2 h at E = -1 VRHE(IR uncorrected).
Figure 2 Reduction potentials of electrode processes close to the RHE potential. The letters correspond to the half-reactions listed in Table 1.
Figure 3 CVs of freshly polished Ni electrodes held at -300 mVRHEfor 60 s then scanned at
100 mV s-1in Ar-purged 0.1 M KOH to upper potential limits of (a) 1.6 V
RHEand
(b) 0.5 VRHE. The numbers denote the voltammetric regions discussed throughout
Figure 4 Freshly polished Ni electrodes were held at -300 mVRHE for various periods then
scanned at 100 mV s-1 in Ar-purged 0.1 M KOH. The numbers denote the
voltammetric regions discussed throughout the text.
Figure 5 Freshly polished Ni electrodes were held at -600 mVRHE≤ E ≤ +500 mVRHEfor 60
Figure 6 Freshly polished Ni electrodes were held at -300 mVRHE for 60 s then scanned
positive at different rates in Ar-purged 0.1 M KOH. (a) Current-potential profiles with the scan rates indicated in mV s-1. (b) The current density of the first anodic
peak [(2), ■], 850 mVRHE [(3), ●], 1200 mVRHE [(4), ▲] and the second anodic
Figure 7 Ni electrodes were held at -300 mVRHE for 60 s then cycled at 100 mV s-1in
Figure 8 XRD patterns (●) of (a) chemically polished Ni foil and Ni electrodes treated galvanostatically at -0.5 A cm-2for (b) 141 h (5.9 days) in 1 M NaOH and (c) 66.5
h (2.8 days) in 30 % (w/w) KOH. The y-scale is normalised to the most intense peak in (a). The fitted Lorentzian peaks and the cumulative line shapes are shown as solid lines. The curve parameters are listed in Table 2.
100 mV s-1to (2) 0.5 V
RHE, (3) 1.0 VRHEor (4) 1.5 VRHE. Spectra were curve-fitted
with Ni (- - -), NiO (• • •), β-Ni(OH)2(–•–) and β-NiOOH (–• •–) components
using the line shapes and method of Biesinger et al.25 (b) The surface oxidation
state from the curve-fitted component area percentages of Ni (■), NiOx (●),
Ni(OH)2 (▲) and β-NiOOH (♦). Each sample was analyzed at three spots. The
data points show the average values and the error bars each span one standard deviation.
Figure 10 A freshly polished Ni electrode was held at 500 mVRHEfor 60 s then cycled at 100
Table 1 Reversible electrode potentials for processes discussed in this study. Potentials are separated by a slash, where there is a range of possible values. The letters (first column) correspond to Figure 2.
Potential
VRHE
Reaction Ref.
(a) -0.12/-0.13 Ni(s)+ x H2O(l)+ x e-⇌ β-NiHx(s)+ x OH-(aq), x = 0.60 - 0.65 32
(b) -0.075/-0.095 Ni(s)+ x H2O(l)+ x e-⇌ α-NiHx(s)+ x OH-(aq), x = 0.01 - 0.03 32 (c) 0.000 2 H2O(l)+ 2 e-⇌ 2 OH-(aq)+ H2(g) (d) 0.108a β-Ni(OH) 2(s)+ 2 e-⇌ Ni(s)+ 2 OH-(aq) 27, 58 (e) 0.132b NiO (s)+ H2O(l)+ 2 e-⇌ Ni(s)+ 2 OH-(aq) 1.229 O2(g)+ 2 H2O(l)+ 4 e-⇌ 4 OH-(aq) 1.37/1.40c β-NiOOH + H 2O(l)+ e-⇌ β-Ni(OH)2(s)+ OH-(aq) 59
aThe measurement predates the discovery of α-Ni(OH)2 in 196660 so it is assumed that the
researchers used high purity, crystalline β-Ni(OH)2. bCalculated from the free energies of formation of NiO
(s) and H2O(l).61, 62The potential for
non-stoichiometric NiOxis expected to be different.
Table 2 Lorentzian parameters used to fit the XRD peaks shown in Figure 8 and the derived lattice spacing and unit cell parameters. Pairs of peaks arising from the split Cu Kα1and Kα2X-ray lines were fit with the same full-width half maximum
(FWHM) value.
Sample Peak Centre
2θ (degrees) FWHM (degrees) Area R2 (h k l) d (Å) a (Å) (a) 44.458 0.067 1575.04 0.9958 (1 1 1) 2.036 3.527 44.574 667.73 51.817 0.064 648.78 0.9949 (2 0 0) 1.763 3.526 51.946 427.04 (b) 44.455 0.127 269.79 0.9978 (1 1 1) 2.036 3.527 44.565 144.66 51.778 0.204 127.91 0.9970 (2 0 0) 1.764 3.529 51.902 67.30 (c) 44.372 0.039 10.84 0.9965 (1 1 1) 2.040 3.533 44.499 9.84 44.461 0.088 48.76 (1 1 1) 2.036 3.526 44.588 20.85 51.797 0.057 6.70 0.9920 (2 0 0) 1.764 3.527 51.932 1.96 51.840 0.079 59.69 (2 0 0) 1.762 3.524 51.975 25.29
Table 3 The proposed electrode processes corresponding to the numerical regions indicated in Figure 3.
Region Electrode Process(es)
(1) H incorporated in the Ni metal oxidizes and dissolves into solution (2) Metallic Ni oxidizes to NiOxand α-Ni(OH)2
H incorporated in the Ni metal oxidizes and dissolves into solution (3) H incorporated in the electrode material oxidizes and dissolves
The NiOx/α-Ni(OH)2layer is chemically modified and thickens
(4) The NiOx/α-Ni(OH)2layer thickens
β-Ni(OH)2forms electrochemically and/or by ageing of α-Ni(OH)2
H incorporated in the Ni metal oxidizes and dissolves into solution (5) α/β-Ni(OH)2oxidize to β-NiOOH
The underlying NiOxlayer thickens
H2O/OH-adsorbs and oxidizes to adsorbed oxygen species
(6) H2O/OH-is oxidized to O2(OER)
(7) The Ni(3) oxyhydroxide layer reduces to β-Ni(OH)2
Adsorbed oxygen species reduce and desorb (8) β-Ni(OH)2, NiOxand α-Ni(OH)2reduce to Nia
H2O is reduced to H2(HER)
(9) NiOxand α-Ni(OH)2reduces to Nia, b
aThe surface layer on Ni may not fully reduce due to small amount of unreactive surface
bAt more positive upper limits, the surface layer is chemically modified to contain β-Ni(OH) 2