O
pen
A
rchive
T
OULOUSE
A
rchive
O
uverte (
OATAO
)
OATAO is an open access repository that collects the work of Toulouse researchers and
makes it freely available over the web where possible.
This is an author-deposited version published in:
http://oatao.univ-toulouse.fr/
Eprints ID : 19502
To cite this version
:
Benoit, Hadrien and Ansart, Renaud
and García-Triñanes, Pablo
and Gauthier, Daniel and Flamant, Gilles and Simonin, Olivier
3D numerical simulation of upflow bubbling fluidized bed in opaque
tube under high flux solar heating. (2016) In: 9th International
Conference on Multiphase Flow (ICMF 2016), 22 May 2016 - 27
May 2016 (Firenze, Italy)
Any correspondence concerning this service should be sent to the repository
administrator:
[email protected]
3D numerical simulation of upflow bubbling fluidized bed in opaque tube under high flux solar
heating
Hadrien Benoit1, Renaud Ansart2, Pablo Garcia Triñanes3, Daniel Gauthier1, Gilles Flamant1and Olivier Simonin4 ∗ 1
PROMES-CNRS
7 rue du four solaire, 66120 Font-Romeu Odeillo, France [email protected]
2
Laboratoire de Génie Chimique, Université de Toulouse, CNRS, INPT, UPS, Toulouse, France [email protected]
3
University of Surrey; Department of Chemical and Process Engineering (J2) Guildford, GU2 7XH, United Kingdom
4
Institut de Mécanique des Fluides de Toulouse (IMFT), Université de Toulouse, CNRS, INPT, UPS, Toulouse, France
Abstract
Current solar Heat Transfer Fluids (HTF) only work below 600◦C. We proposed to use air-fluidized Dense Particle Suspensions (DPS), also called Upflow Bubbling Fluidized Bed (UBFB), in tubes as a new HTF and storage medium in the frame of the so-called CSP2 FP7 European project. UBFB can operate up to the solid sintering temperature (1400◦C for SiC particles), thus improving the plant efficiency and cost of produced kWh. The DPS capacity to extract heat from a tube absorber exposed to concentrated solar radiation was demonstrated and the first values of the tube wall-to-DPS heat transfer coefficient were measured. A stable outlet temperature of 750◦C was reached with a metallic tube, and a particle reflux in the near tube wall region was evidenced. In this paper, the UBFB behavior is studied using the multiphase flow code NEPTUNE_CFD. Hydrodynamics of SiC Geldart A-type particles and heat transfer imposed by a thermal flux at the wall are coupled in 3D numerical simulations. The convective/diffusive heat transfer between the gas and dispersed phase, and the inter-particle radiative transfer (Rosseland approximation) are accounted for. Simulations and experiments are compared. The temperature influence on the DPS flow is analyzed.
Keywords: tubular solar receiver, gas-particle flow, heat transfer fluid, euler-euler model, 3D numerical simulation
1. Introduction
In the frame of the European CSP2 project [1], a new con-cept of solar receiver using a Dense Particle Suspension (DPS) upward flow in tubes was studied. The interest of using as Heat Transfer Fluid (HTF) solid particles transported by an air flow is that the two-phase medium created takes the flow properties of liquid while being able to withstand high temperatures, up to the solid sintering temperature. Reaching temperatures over 700◦C is required in order to use high efficiency conversion cycles in solar tower power plants, such as Brayton or combined cycles. Moreover, the DPS can be used as direct heat storage medium.
The DPS flow in tube hydrodynamic was analyzed thanks to experiments on a cold mock-up [2, 3]. Among many results, it led to understanding how to control the solid flow and to determine specific flow characteristics. Then the process was successfully tested in real conditions of concentrated solar irradiation with a single-tube experimental receiver set at the focus of the CNRS 1 MW solar furnace in Odeillo [4]. A stable outlet temperature of 750◦C was reached with a metallic tube, and a particle reflux in the near tube wall region was evidenced [5]. Moreover, wall-to-DPS global heat transfer coefficients over the irradiated tube height were calculated. They ranged from 400 to 1100 W/m2.K.
3D numerical simulations of the single-tube solar receiver setup were conducted in order to better understand the particle flow and the heat transfer mechanisms inside the absorber tube. The Eulerian-Eulerian approach was chosen in regard of the very large number of particles (> 1010) to limit the calculation time.
The same method was applied in other simulations of the single-tube solar receiver that aimed to reproduce the measured heat transfer between the wall and the particles [6].
The NEPTUNE_CFD computational code was used [7]. First, the DPS circulation was simulated at ambient temperature. The numerical results were compared to those obtained on the cold mock-up and to those of Positron Emission Particle Track-ing (PEPT) experiments conducted by CSP2 project partners [8]. The solid recirculation evidenced by the DPS temperature distri-bution in the absorber tube during on-sun experiments was ob-served in both simulations and PEPT experiments. This shows the capability of the code and implanted mathematical models to reproduce this peculiar flow pattern.
This paper presents simulations of the DPS flow in a heated tube aiming to reproduce on-sun experiments on a single-tube solar receiver. First, the experimental setup is described. After that, the simulation parameters are detailed: geometry and mesh, phases’ properties, mathematical models, boundary conditions. The simulation procedure is explained. Then, the numerical and experimental results are compared at the level of the linear pres-sure loss and temperature to validate the model. Finally, the in-fluence of the temperature on the DPS flow is analyzed. 2. Single-tube DPS solar receiver experimental setup
This setup and the results obtained during on-sun experimen-tal campaigns have already been the object of two publications [4, 5]. Therefore it will only be quickly explained in this section.
∗This study was performed in the framework of the CSP2 Project (Concentrated Solar Power in Particles), funded by the European Commission (FP7, Project No. 282 932).
The principle of the DPS solar receiver is to create an upward flow of solid particles from a bottom Fluidized Bed (FB), called Dispenser Fluidized Bed (DiFB) into a vertical tube exposed to concentrated solar radiation that heats the tube wall. The heat is then transmitted to the particles circulating inside that finally flow out of the tube in a collector FB. The DPS is obtained by fluidiz-ing the particles in the DiFB with air injected through a sintered metal plate at the bottom of the chamber to reach a state of bub-bling fluidized bed. The air flow at the DiFB outlet is controled by an electronic valve. Closing the valve leads to a freeboard pressure increase and to the DPS going up the tube so that the hy-drostatic pressure drop compensates the pressure increase. The circulation is achieved by stabilizing the DPS level in the tube at the tube’s outlet height and injecting solid in the DiFB. To main-tain the pressure equilibrium, the same solid flow rate injected in the DiFB has to exit the system and flow out of the tube.
The experimental setup was equipped with thermocouples that measured the DPS temperature and allowed to determine the heat transferred to the particles.
3. Simulation parameters 3.1. Geometry and mesh
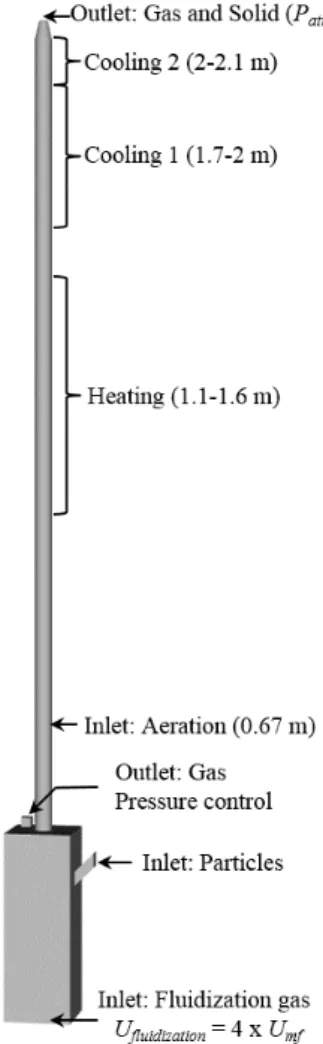
The simulated geometry that was limited to the DiFB and the absorber tube is shown in Fig. 1. The DiFB could not be re-moved from the simulation because experimental results showed that what happens at the tube inlet impacts the DPS flow inside the tube. The DiFB has a horizontal section area of 0.02 m2, a height of 0.4 m and is equipped with a lateral solid entrance and an air evacuation at the top. The tube is 2.06 m high and 0.034 m in diameter. Its inlet is set 0.1 m cm above the bottom of the chamber (fluidization plate). An aeration injection is set on the tube 0.57 m from its inlet. The geometry dimensions correspond to those of the cold mock-up. The mesh contained 1,650,000 hexahedral, 1.5 mm high and around 1.2 mm wide cells.
We chose to keep the same geometry as previously used for simulations without heating to be able to compare both numerical studies. It slightly differed from the geometry of the experimen-tal solar receiver. The DiFB section was smaller (0.02 m2 in-stead of 0.16 m2) and its height was greater (0.4 m instead of 0.3 m) but this did not affect the results as long as the fluidized bed state was reproduced (bubbling bed). The tube diameter simu-lated was 0.034 m whereas that of the experimental absorber tube was 0.036 m. To compensate for this difference, the solid flux was kept constant and the heat flux density imposed during the simulations was adapted to keep the same temperature increase. The tube inlet was set 0.1 m above the fluidization plate whereas it was 0.04 m in the experiments. Finally, the aeration injection was set 0.57 m above the tube inlet in the simulations instead of 0.3 m in the on-sun experiments.
3.2. Phases properties
The used SiC particles had very irregular shapes with a high size polydispersion. They had a 63.9 µm mean Sauter diame-ter. Due to the particles’ shapes, the bed expansion was under-estimated by the model when the imposed diameter was 64 µm. The particle diameter was set to 40 µm to obtain the same nu-merical bed expansion as that measured experimentally, while considering perfectly spherical particles [8]. The SiC particles’ properties were calculated from the data given in [9]. The den-sity was kept constant while the heat capacity was function of the temperature.
The air density was calculated with the perfect gas law. The specific heat capacity, dynamic viscosity and thermal conductiv-ity were determined from the data tables given in Perry’s Chem-ical Engineers’ Handbook [10]. They were all function of the temperature.
Figure 1: Simulated geometry.
3.3. Mathematical models
The 3D numerical simulations of the experimental DPS so-lar receiver were carried out using an Eulerian n-fluid model-ing approach for turbulent and poly-dispersed fluid-particle flows, which is developed and implemented by the Fluid Mechanics In-stitute of Toulouse (in French: Institut de Mécanique des Flu-ides de Toulouse - IMFT) in a specific version of the NEP-TUNE_CFD code. This multiphase flow software uses the finite-volume method, with unstructured meshes, to run parallel calcu-lations [11]. It uses a predictive-corrective method for the equa-tions resolution [12]. It was developed by the consortium Com-mission for Atomic Energy (in French: Commissariat à l’Énergie Atomique - CEA), Électricité de France (EDF), Radioprotection and Nuclear Safety Institute (in French: Institut de Radioprotec-tion et de Sûreté Nucléaire - IRSN) and AREVA in the frame of the NEPTUNE project.
The proposed modeling uses a hybrid approach [13], to es-tablish the particles’ momentum equations from the joint fluid-particle probability density functions. Separate mean transport equations (mass, momentum and fluctuant kinetic energy) are solved for each phase and coupled through inter-phase transfer terms. The transport equations are derived by phase ensemble averaging weighted by the phases’ volume fraction for the con-tinuous gaseous phase and by using kinetic theory of granular flows supplemented by fluid and turbulence effects for the dis-persed phase. The drag model used is the Wen and Yu model limited by Ergun equation in the zones of low voidage [14]. The kinetic theory for granular media describes the collisional part of
the stress sensor [15]. A frictional model was added to account for the long period interactions in the flow very dense zones [16]. For the continuous gaseous phase, no turbulence model is consid-ered. For the dispersed phase, a transport equation is solved on the particle random kinetic energy qp2.
In this model, a heat flux density imposed at the inside tube wall. The conduction in the wall, and convection from the wall to the DPS were not simulated which means that there was neither a wall temperature nor a wall-to-DPS heat transfer coefficient. This approach was chosen to reproduce the wall-to-DPS heat flux mea-sured during the experiments that includes the radiation contribu-tion. The heat exchanged by contact during the interparticle col-lisions was neglected. Therefore, the heat exchange modes in the suspension were: the convection/diffusion heat transfer between the gaseous phase and the particles, and the radiative heat transfer between particles. The radiation between the particles in the bed was assumed to take place in the frame of the Rosseland approx-imation through a diffusion mechanism. The radiative flux was taken proportional to the temperature gradient. Since the wall is not simulated, the radiative transfer between wall and particles is included in the heat flux density boundary condition. Finally, the heat distribution was determined through both phases’ enthalpy transport equations.
3.4. Boundary conditions Flow conditions
The geometry comprised 3 inlet boundaries.The fluidization plate through which the air was injected at a constant mass flow rate corresponding to an air superficial velocity close to 4 Umf.
The air was injected at the DiFB temperature. This boundary was seen as a wall by the solid phase. The lateral solid injection where the solid mass flow rate was imposed with an 0.5 particle volume fraction and an extremely low air mass flow rate. Both phases were injected at the DiFB temperature. The aeration injection, 0.57 m above the tube inlet, where the air mass flow rate was set to reproduce the experimental aeration mass flux (= superficial mass flow rate). The aeration air was injected at 100◦C.
The geometry had 2 free outlets: one on the DiFB ceiling, through which only air passed (the passing solid fraction was neg-ligible) and the other one at the top of the tube. A pressure loss was imposed on the DiFB outlet to control the freeboard pressure rather than imposing pressure or flow rate condition. This choice was made to reproduce the behavior of the pressure control valve used in the experiments. The desired solid flux through the tube was obtained by adjusting the pressure loss coefficient, which is similar to changing the valve’s setting. The outlet pressure was the atmospheric pressure Patm= 101325 Pa.
The wall boundary condition was a no-slip condition [17] for both gas and particles. It gave results closer to the cold mock-up experiments than the friction condition and the slip condition that were also tested with cold simulations.
Heat conditions
A uniform heat flux density was imposed at the tube wall. In that regard, there is a significant difference between experiments and simulations. Indeed, during the experiments, the tube had one side directly exposed to the concentrated solar flux, whereas the opposite side only received the radiation reflected and emitted by the cavity. The approximation of uniform heat flux was used due to the lack of another option, since the reflected and re-emitted fluxes coming from the cavity were not measured.
The heat flux transferred to the DPS during experiments was calculated by enthalpy balance on the solid phase between the inlet and outlet of the system. The heat flux density averaged on the exchange surface between tube and DPS was obtained by dividing the heat flux by the internal surface area of the irradi-ated part of the tube. Due to the tube diameter difference (0.036
m inside diameter in solar experiments and 0.034 m in simula-tions), the heat flux density transferred to the DPS was adapted to keep the same temperature increase as in the experiments with a changed solid flow rate since the solid flux was kept constant (heat flux density ratio = diameter ratio).
The heat flux density condition applied was varied along the tube height to be as close as possible to the solar experiments. From the tube inlet (0.1 m) to the cavity inlet (1.1 m), the ex-perimental tube was insulated. Therefore, an adiabatic condition was applied. From the cavity inlet (1.1 m) to its outlet (1.6 m), the tube was exposed to concentrated solar radiation, so a posi-tive heat flux density was applied (”Heating” in Fig. 1). After the cavity, the tube passed through the cavity insulation. In this zone (1.6 m to 1.7 m) an adiabatic condition was imposed. Above 1.7 m, the tube was not insulated at all, which led to high heat losses. This was represented by a negative heat flux density with a high loss from 1.7 m to 2 m and a lower one between 2 m and 2.1 m since the heat loss is higher when the temperature is higher (”Cooling 1” and ”Cooling 2” in Fig. 1, respectively).
As will be explained afterwards, the simulations overesti-mated the particle reflux. At the cavity outlet, the exagerated mixing between particles heated in the cavity and others cooled by heat losses above led to the simulated temperature being lower than that measured. We decided to increase the heat flux in the cavity, with respect to the value obtained through enthalpy bal-ance, to have matching temperatures at the cavity outlet. The cooling heat flux was increased accordingly to maintain the tem-perature at the tube outlet.
The boundary conditions of all the simulated cases are given in Table 1.
4. Simulation procedure
The calculations were conducted with 140 processors. The simulations begined by a transitory period during which the con-trol parameters that are the pressure loss coefficient at the DiFB outlet and the heat flux densities were adapted. Their influences on the temperature and solid flux in the tube are intertwined. On the one hand, increasing (decreasing) the pressure loss coeffi-cient, which corresponds to a valve closing (opening), decreased (increased) the air flow rate passing through the pressure control valve (outlet of the DiFB) and therefore increased (decreased) the air flow through the tube. More (less) air going into the tube means more (less) solid carried up and an increased (decreased) solid flux. This solid flux modification, for given heat flux densi-ties, provoked temperature changes. On the other hand, modify-ing the heat flux densities modified the temperature distribution along the tube height. Since the temperature affects the air den-sity and velocity, the DPS denden-sity is impacted. A DPS denden-sity variation means a hydrostatic pressure variation, which leads to a changed air flow repartition between valve and tube that affects the solid flux going up the tube. Due to these coupled phenomena, the adjustments had to be done simultaneously for both control parameters, to finally obtain the experimental cases’ conditions. Once the parameters were correctly set, the system converged to-wards a stable state with a constant solid mass in the geometry and an established temperature distribution. The total transitory regime duration, including the period to find the righ parameters and the stabilization period, was at least 200 s.
Even in stable regime, the DPS flow is unsteady, which means that instantaneous characteristics are constantly changing. The regime is called stable because the time-averaged characteristics are constant. 150 s long time averages were done in order to ob-tain stable averaged values.
To illustrate the unsteady flow, Fig. 2 shows an instantaneous solid velocity field in the tube, for the Ref case, between 1.3 and 1.4 m, at 720 s after the beginning of the simulation. The tube vertical slice is colored by the magnitude of the velocity. It can
Table 1: Boundary conditions Case Fp Ff FA Tp,iDiF B ϕ1 ϕ2 ϕ3 [kg/h] [kg/h] [kg/h] [K] [kW/m2] [kW/m2] [kW/m2] Ref 59.8 0.483 8.92 × 10⁻² 575 128.9 120.9 20 HQ 147.4 0.483 8.92 × 10⁻² 601 189.7 172.6 25 HT 32.8 0.483 1.78 × 10⁻¹ 782 107.3 159.7 17
Ref: medium solid flux-medium temperature, HQ: high solid flux-medium temperature, HT: low solid flux-high temperature, Fp:
par-ticle mass flow rate, Ff: fluidization air mass flow rate, FA: aeration air mass flow rate, Tp,iDiF B: DiFB temperature, ϕ1/2/3: heat
flux densities from 1.1 m to 1.6 m, from 1.7 m to 2 m and from 2 m to 2.1 m, respectively (cf. Fig. 1)
Table 2: Parameters comparison between experiments and simulations
Parameter Ref case HQ case HT case
Exp Sim Error Exp Sim Error Exp Sim Error
Gp[kg.m−2.s−1] 18.3 18 - 1.8 % 45.1 44.7 - 0.7 % 10 10.1 1 %
Linear pressure drop [Pa/m] 8750 8340 - 4.6 % 8880 9120 2.6 % 6180 4510 - 27 %
Ti,center[K] 614 772 26 % 630 684 9 % 872 992 14 %
To,center[K] 842 819 - 2.7 % 802 804 0.2 % 1004 951 - 5.3 %
T2m,center[K] 743 728 - 2 % 711 708 - 0.4 % 842 856 1.7 %
be seen that the particles are going up in some zones, down in some others, and that their velocities range from 0 to 0.5 m/s. Fig. 3 illustrates the result obtained after a 150 s long time av-erage. The recirculation is shown by the averaged solid velocity positive in the center and negative close to the wall.
Figure 2: Instantaneous solid velocity field at t = 720 s in the tube between 1.3 and 1.4 m (Ref case).
Figure 3: Time averaged solid velocity field in the tube between 1.3 and 1.4 m (Ref case).
5. Comparison between simulations and experiments The results of simulations and experiments are compared in Table 2. The DiFB pressure control allowed to work at solid fluxes almost identical to those of the selected experimental points with a 1.8 % maximum absolute relative error. The linear pressure drop, which is directly linked to the hydrostatic pres-sure drop caused by the particle weight in the column, was well reproduced for the Ref and HQ cases (relative error < 5 %).
It must be noted that, in DPS, the gas and solid have the same temperature [18]. The temperature at the inlet of the irradiated cavity in the center of the tube Ti,center was overestimated by
simulations. This is due to an overestimation of the solid recir-culation [8]. Indeed, if the downward flux is overestimated, more hot particles flow down below the irradiated cavity and preheat the particles by mixing before they reach the cavity inlet. The temperature at the cavity outlet in the tube center To,centerwas
well reproduced for the Ref and HQ cases (absolute relative error < 3 %) thanks to the heat flux density condition adaptation. The temperature is well reproduced at 2 m which is normal since the heat flux conditions were set to respect the enthalpy balance over the whole tube length.
The temperature overestimation at the cavity inlet and under-estimation at the cavity outlet were the most significant for the HT case with the lowest solid flux. On the opposite, the HQ case was the least impacted by the recirculation overestimation. This is due to the recirculation impact decreasing with the solid flux increase. Indeed, when the average particle residence time in the tube is reduced, there is less mixing between upward and down-ward particle fluxes.
6. Numerical results: Temperature influence on DPS flow The results analysis focuses on the impact of the temperature on the DPS flow characteristics. Only the HQ case, for which the experiment was best reproduced, is shown.
6.1. Vertical temperature profile
Figure 4 presents the simulated temperature profiles at the center of the tube and 5 mm from the tube wall along the tube height and the experimental temperatures for the HQ case. The
temperature is well reproduced at the cavity outlet at the tube center (804 K) but it is overestimated at the cavity inlet (684 K instead of 630 K). The temperature increases from the aeration in-jection height to just below the cavity outlet then decreases until it stabilizes at 2 m. This profile’s shape is caused by the wall heat flux density condition with a downward shift provoked by the re-circulation (the temperature starts going up below the cavity inlet and reaches the maximum below the cavity outlet).
0.1 0.6 1.1 1.6 2 600 650 700 750 800 850 Vertical Position [m] T [K] Sim Center Sim 5mm Exp Center Exp 5mm
Figure 4: Simulated vertical temperature profiles and experimen-tal temperatures at the center of the tube and 5 mm from the tube wall (HQ case).
6.2. Radial air velocity profile
Figure 5 presents the gas vertical velocity ug, z radial profiles
for the HQ cases at 4 positions along the tube height: 0.5 m, 1.1 m, 1.6 m and 2 m. The first element to notice is that the air ve-locity is positive in the center and negative close the wall. This is due to the particle recirculation. The velocity is lower before the aeration than after because the air mass flow rate is increased by the aeration. Moreover, we can see that the velocity is lower at 1.1 than above at 1.6 m and 2 m. This is due to the air density decreasing with the pressure decrease and with the temperature increase. From 1.6 to 2 m, the velocity decreases, while the pres-sure decreases, because the temperature is higher at 1.6 m than at 2 m, making the air density lower.
−1.7 −1 −0.5 0 0.5 1 1.7 −0.4 −0.2 0 0.2 0.4 Radial position [cm] ug,z [m/s] 0.5 m 1.1 m 1.6 m 2 m
Figure 5: Gas vertical velocity radial profiles (HQ case).
6.3. Radial solid volume fraction profile
Figure 6 presents the solid volume fraction αpradial profiles
for the HQ case at 4 positions along the tube height: 0.5 m, 1.1 m, 1.6 m and 2 m. It can be seen that αpis higher at 0.5 m, below the
aeration located at 0.67 m. The aeration purpose was to help the solid circulation, and αpwas lowered as a consequence of the air
flow increase. This effect is well reproduced by the simulations. The profiles show that the volume fraction is higher close to the tube wall than at the center. This difference increases after the aeration. This is due to the bubbles circulating in the tube central zone. At 2 m, αpis equal to 0.26 at the tube center and it is 38
% higher at the wall. We can also observe that it is higher at 1.1 m than above because the pressure is higher and the temperature lower, therefore the air velocity is lower. Moreover, αp is the
lowest at 1.6 m where the temperature is the highest (see Fig. 4). This means that the temperature, through its influence on the air density, impacts the solid volume volume fraction that depends on the air velocity.
−1.7 −1 −0.5 0 0.5 1 1.7 0.2 0.25 0.3 0.35 0.4 0.45 0.5 Radial position [cm] α p
Figure 6: Solid volume fraction radial profiles (HQ case).
6.4. Radial solid flux profile
Figure 7 presents the solid flux Gpradial profiles for the HQ
case. The recirculation is clearly visible with Gpbeing positive
in the center and negative close to the wall. The recirculation ra-tio, defined as the ratio of descending solid flux over ascending solid flux, is much higher above the aeration, where the air flow rate is increased, than below. It is the highest at 1.6 m where the air velocity is the highest due to the temperature influence. Therefore it can be said that there is a direct link between the air velocity and the solid recirculation. For a given solid flux, the higher the air velocity, the higher the recirculation. At 1.6 m, the recirculation ratio is 83 % in the Ref case (not shown) and 64 % in the HQ case. It is reminded that these values are overestimated as showed by the comparison between experimental and simula-tioned temperatures. However, it is confirmed that the higher the solid flux, the lower the recirculation. Moreover we can see that the recirculation zone (zone with a negative solid mass flux) is 4 mm thick for the entire tube height.
−1.7 −1 −0.5 0 0.5 1 1.7 −400 −300 −200 −100 0 100 200 300 Radial position [cm] G p [kg.m −2 .s −1 ] 0.5 m 1.1 m 1.6 m 2 m
6.5. Discussion
In the studied case, we have seen that the temperature strongly impacts the air velocity through the density variation along the tube height. As a consequence, the solid volume frac-tion and the recirculafrac-tion that depend on the air velocity are af-fected by the temperature. This influence is combined with that of the pressure.
This result will be useful when planning for the system’s scaling-up. Indeed, in industrial applications, the absorber tubes will be much longer (probably 8 m) which means that the tem-perature increase, pressure decrease and induced air velocity in-crease will be much higher. To keep the air velocity more or less constant over the tube height and prevent the detrimental to heat transfer plug-flow regime from appearing at high air velocity, it will be necessary to install air evacuations (with sintered metal filters to stop particles) to lower the air mass flow rate while the temperature is goes up and the density goes down.
The tube length increase should not create other complica-tions since the height itself does not impact the DPS flow (the recirculation zone width is constant over the tube height). 7. Conclusion
The 3D numerical study of the experimental DPS solar re-ceiver was realized with the NEPTUNE_CFD code. A uniform heat flux density condition over the absorber tube circumference was applied. The model reproduced the experimental results to some extent but differences were noted. The particle recirculation that had been noticed during the experiments was reproduced, however it was overestimated.
The numerical results put in evidence the impact of the tem-perature on the DPS flow through its influence on the air density. The higher the temperature, the lower the solid volume fraction and the more intense the recirculation. It means that for indus-trial application with longer absorber tubes, it will be necessary to compensate the air density decrease with the temperature in-crease and pressure dein-crease by evacuating a fraction of the air flow to maintain the air velocity constant.
Only part of the simulations results were exploited in this pa-per. In particular, the heat transfer mechanisms between the cen-ter of the tube and the zone close to the tube wall will be analyzed through the velocities time variances and particle agitation in a future publication.
Several possibilities are currently being explored to improve the fit between simulations and experiments. The mesh could be further refined in the radial direction. The particle-particle fric-tion, the particle size distribution and the non-sphericity could be better accounted for. The wall-to-suspension heat exchange could be modeled. Lastly, the inhomogeneous heat flux could be simu-lated by coupling NEPTUNE_CFD with the SYRTHES code that would allow computing the heat flux through the tube wall. References
[1] FP7 EC project CSP2. http://www.csp2-project.eu. [2] B. Boissière, R. Ansart, D. Gauthier, G. Flamant, and
M. Hemati. Experimental hydrodynamic study of gas-particle dense suspension upward flow for applications as new heat transfer and storage fluid. Canadian Journal of Chemical Engineering, 93:317–330, 2015.
[3] B. Boissière. Étude hydrodynamique et thermique d’un nou-veau concept de récepteur solaire à suspensions denses gaz-particules (Hydrodynamic and thermal study of a new con-cept of solar receiver using dense gas-particle suspensions). PhD thesis, Institut National Polytechnique de Toulouse (INP Toulouse), 2015.
[4] G. Flamant, D. Gauthier, H. Benoit, J.-L. Sans, R. Garcia,
B. Boissière B., R. Ansart, and M. Hemati. Dense suspen-sion of solid particles as a new heat transfer fluid for concen-trated solar thermal applications: On-sun proof of concept. Chemical Engineering Science, 102:567–576, 2013. [5] H. Benoit, I. Pérez López, D. Gauthier, J.-L. Sans, and
G. Flamant. On-sun demonstration of a 750◦C heat trans-fer fluid for concentrating solar systems: Dense particle sus-pension in tube. Solar Energy, 118:622–633, 2015. [6] R.A. Reyes Urrutia, H. Benoit, M. Zambon, D. Gauthier,
G. Flamant, and G. Mazza. Simulation of the behavior of a dense SiC particle suspension as an energy transporting vector using computational fluid dynamics (CFD). Chem. Eng. Res. & Design, 106:141–154, 2016.
[7] N.A. Konan, H. Neau, O. Simonin, M. Dupoizat, and T. Le Goaziou. Multiphase flow simulation of hexafluoride con-version reactor. Proceedings of 7thInternational Confer-ence on Multiphase Flow, Tampa, Florida, USA, 2010. [8] P. Garcia-Triñanes, R. Ansart, H. Benoit, O. Simonin, and
J.P.K. Seville. Dense gas-particle suspension upward flow used as heat transfer fluid in solar receiver: PEPT experi-ments and 3D numerical simulations. Chemical Engineer-ing Science, (submitted).
[9] R.G. Munro. Material Properties of a Sintered alpha-SiC. Journal of Physical and Chemical Reference Data, 26:1195–1203, 1997.
[10] D.W. Green and R.H. Perry. Perry’s Chemical Engineers’ Handbook. McGraw-Hill Professional, 8thedition, 2008. (Section 2, Thermodynamic Properties).
[11] H. Neau, P. Fede, J. Laviéville, and O. Simonin. High per-formance computing (HPC) for the fluidization of particle-laden reactive flows. Proceedings of Fluidization XIV, No-ordwijkerhout, The Netherlands, 2013.
[12] N. Méchitoua, M. Boucker, J. Laviéville, S. Pigny, and G. Serre. An unstructured finite volume solver for two phase water/vapour flows based on an elliptic oriented fractional step method. Proceedings of NURETH 10, Seoul, South Ko-rea, 2003.
[13] S. Morioka and T. Nakajima. Modeling of gas and solid particles two-phase flow and application to fluidized bed. Journal of Theoretical and Applied Mechanics, 6(1):77–88, 1987.
[14] A. Gobin, H. Neau, O. Simonin, J.-R. Llinas, V. Reiling, and J.-L. Sélo. Fluid dynamic numerical simulation of a gas phase polymerization reactor. International Journal for Numerical Methods in Fluids, 43:1199–1220, 2003. [15] G. Balzer, O. Simonin, A. Boelle, and J. Lavieville. A
uni-fying modelling approach for numerical prediction of dilute and dense two-phase flows. Proceedings of Circulating Flu-idized Bed Technology V, Beijing, May 28-June 1, 1996. [16] A. Srivastava and S. Sundaresan. Analysis of a frictional
kinetic model for gas/particle flows. Powder Technology, 129:72–85, 2003.
[17] P. Fede, O. Simonin, and A. Ingram. 3D numerical simula-tion of a lab-scale pressurized dense fluidized bed focussing on the effect of the particle-particle restitution coefficient and particle-wall boundary conditions. Chemical Engineer-ing Science, 142:215–235, 2016.
[18] J. Baeyens and W.R.A Goossens. Some aspects of heat transfer between a vertical wall and a gas fluidized bed. Powder Technology, 8:91–96, 1973.