The Development of an Automated System for Electrical
Characterization of Cells Using a Novel Force Balance
Method
by
Hao-Wei Su
B.S., Electrical Engineering, National Taiwan University 2009
SUBMITTED TO THE DEPARTMENT OF ELECTRICAL ENGINEERING AND COMPUTER SCIENCE IN PARTIAL FULFILLMENT OF THE REQUIREMENTS FOR THE
DEGREE OF MASTER OF SCIENCE
AT THE
MASSACHUSETTS INSTITUTE OF TECHNOLOGY SEPTEMBER 2012
0 2012 Massachusetts Institute of Technology All rights reserved.
ARCHES
MASSACHUSETTS INSITUTE "FTC~LOGYOCT
2
4 2012
LIBRARIES
/ Signature of Author Department of Electrical Hao-Wei Su Computer Science August 7, 2012 Engineering and (n Certified by Joel Voldman Associate Professor of Electric 1 gineering and Computer Science Thesis SupervisorAccepted by
I
LeslW A.()tolodziej ski Professor of Electrical Engineering and Computer Sciences Chairman, Department Committee on Graduate CommitteeThe Development of an Automated System for Electrical
Characterization of Cells Using a Novel Force Balance Method
by
Hao-Wei Su
Submitted to the Department of Electrical Engineering and Computer Science on August 7, 2012
in Partial Fulfillment of the Requirements for the Degree of Master of Science
ABSTRACT
Dielectrophoresis (DEP), a cell separation technique based on the dielectric properties, has significantly advanced biomedical research in diverse applications ranging from blood stem cells purification to cancer cells isolation from heterogeneous populations. The ability to accurately measure the dielectric properties of individual cells is not only critical for effective sorting applications, but is also advantageous for enhancing the current knowledge of cell biology.
This thesis proposes a novel method: the n-DEP spring, which applies an electrical field gradient upon continuously flowing cells to distinguish them based on their individual DEP properties. Specifically, the method uses the equilibrium position originating from the force balance between hydrodynamic and DEP forces to infer the cellular dielectric properties.
For thorough DEP characterization, changing different conditions of cells is an essential but time-consuming process which usually takes hours to days. Especially for DEP characterization of time-sensitive events, such as neutrophil activation or cell apoptosis, short characterization time is required. This thesis describes the automation of the fluidic, optics, and electronics components of the DEP characterization system, which shortens the characterization time within an hour.
We first demonstrated the automated DEP characterization of a mammalian cell type in thirty-nine conditions within an hour. Subsequently, we characterized the neutrophils with different activation states and successfully found out the right conditions to discriminate the activated neutrophils and non-activated neutrophils. With this system and method, we now have the potential to rapidly screen through a variety of system parameters, and optimize conditions for effective cell sorting.
Thesis Supervisor: Joel Voldman
ACKNOWLEDGEMENTS
First of all, I would like to express my deepest gratitude to Prof. Joel Voldman for guiding me, encouraging me, and helping me with his knowledge and patience during the entire duration of my Master of Science. Under his weekly advices, I have become more mature in critical thinking, scientific writing, and conducting independent research. I would also like to thank collaborators in MIT Lincoln Laboratory, especially Lalitha Parameswaran and Richard Mathews, for valuable discussions and lending me the high frequency equipment.
Secondly, I want to thank all my previous and current lab mates in Voldman's group, especially Michael Vahey, the man I admire for his great knowledge of dimensional analysis and differential equations where this work built on, as well as his professional attitude and work ethics. Also thanks to Marc, Javier, Thibault, and Tao for sharing their experience of the DEP characterization and sorting and providing guidance and useful suggestions for my thesis. Thanks to Sarvesh for sharing the little stories of the first two years of our MIT graduate life, Burak for thoughtful academic discussion and Aalap for enlightening the group meeting as well as organizing an awesome group outing event. Thanks to Laralynne and Catherine for answering my biology and many other questions, Lily for holding the FluidicMEMS where I felt connected to the microfluidic people. Thanks to Salil for his late night discussion, his plastic masters and his humorous words. Thanks to Minoru who introduced me to delicious Japanese food and played tennis with me. Thanks to Chad for taking care of our lab works and purchases. Also thanks to Katarina, Pat, Wei-Mong, Melanie, Anna, Moritz, and the UROPs Ram, Tiffany, and Yu-Chi who shared my enjoyable life in Voldman's lab.
Thirdly, this work would not been finish without many people who have helped me outside the lab. I want to thank Prof. Dennis Freeman and Prof. Rohit Karnik for thorough discussions. I want to thank Chia-Hua Lee for providing the HL-60 cells and Lara for providing the blood cell separation protocol. I also want to thank the staff and members of MIT MTL for training me the fabrication process.
Finally, I owe special thanks to all my friends for accompanying me through the ups and downs in this two years. At last, most importantly, thanks to my family for everything.
Table of Contents
Chapter 1: Introduction... 10
1.1. Dielectrophoretic cell separation... 10
1.2. Approaches for measuring the DEP force... 11
1.3. Introduction to the n-DEP spring ... 13
1.4. Thesis overview... 15
Chapter 2: DEP theory and the dielectric properties of the cells... 17
2.1. DEP force and the Clausius-M ossitti (CM ) factor ... 17
2.2. Dielectric models of the cells ... 19
2.3. Re[CM ] map and the Iso-dielectric point... 20
2.4. M ethods of measuring the dielectric properties of cells ... 21
Chapter 3: n-DEP spring model... 24
3.1 M ethod overview... 24
3.2 The force balance of a particle moving along a pair of diagonal coplanar electrodes ... 25
3.3 The hydrodynamic drag force in a microfluidic channel ... 25
3.4 The electrical field and the DEP force on a pair of coplanar electrodes... 26
3.5 The balance position of the two forces... 28
3.6 The force ratio and the binary separation on the angle coplanar electrodes ... 29
3 .7 O th er forces ... 32
3 .8 C on clu sio n ... 3 3 Chapter 4: Development of an automated system for force measurement... 34
4.1. Overview of the automated system ... 34
4.2. Fluidic system ... 35
4.3. Electrical system ... 41
4.4. Optical system ... 43
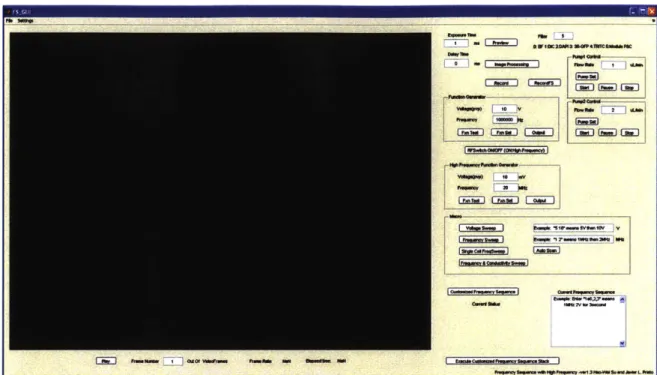
4.5. The graphical user interface of the automated system ... 44
4.6. Image processing and data extraction program ... 46
4 .7 . C o n clu sio n ... 50
5.1. Theory validation with 6 pm polystyrene bead in low conductivity media... 51
5.1.1. M aterials and m ethods ... 51
5.1.2. Results... 53
5.1.3. Conclusion ... 59
5.2. Balance position measurement for HL-60 cells in different frequencies and conductivities ... 59
5.2.1. M aterials and m ethods ... 60
5.2.2. Results... 63
5.2.3. Conclusion ... 69
5.3. D iscrim ination of activated and unactivated neutrophils... 69
5.3.1. M aterials and m ethods ... 70
5.3.2. Results... 72
5.3.3. Conclusion ... 75
Chapter 6: Conclusion and future direction... 76
6.1. Conclusions and contributions ... 76
6.1.1. n-DEP Spring ... 76
6.1.2. The autom ated system ... 77
6.1.3. M ultim odal electrical and optical cytom etry ... 78
Future directions ... 79
6.2.1. Applying frequency sequences with n-DEP spring ... 79
6.2.2. Com bining n-D EP spring w ith fluorescent im aging ... 80
Appendix -A : Fabrication Process Flow ... 81
Appendix -B: Determining the electrical properties of the cell from Re[CM]... 83
List of Figures
Figure 1-1 The general idea of the n-DEP spring. (a) The schematic of the 1-D n-DEP spring. (b) Applying the n-DEP spring in a continuous manner. (c) The n-DEP spring for
different voltages on the red blood cells... 14
Figure 2-1 Polarization of a particle in an external non-uniform electric field. ... 17
Figure 2-2 Two electrical models of a cell. (a) Single -Shell model. (b) Double-shell model. ... 2 0 Figure 2-3 The real part of the Clausius-Mossitti factor as a function of the frequency of the external electric field and the media conductivity... 21
Figure 3-1 The n-DEP spring method overview... 24
Figure 3-2 The force balance of the particle flow along the coplanar electrodes. (a) The top-down view of the microfluidic channel. (b) The cross-sectional view of the coplanar electro d es. ... 2 5 Figure 3-3 The simulated electrical potential above a pair of coplanar electrodes... 27
Figure 3-4 The DEP force along x direction for R=5 Im at the height 15 Im... 28
Figure 3-5 The two forces in the x-direction. ... 28
Figure 3-6 The balance position 6 as a function of force ratio FDE,,,,x /FD,. ... 31
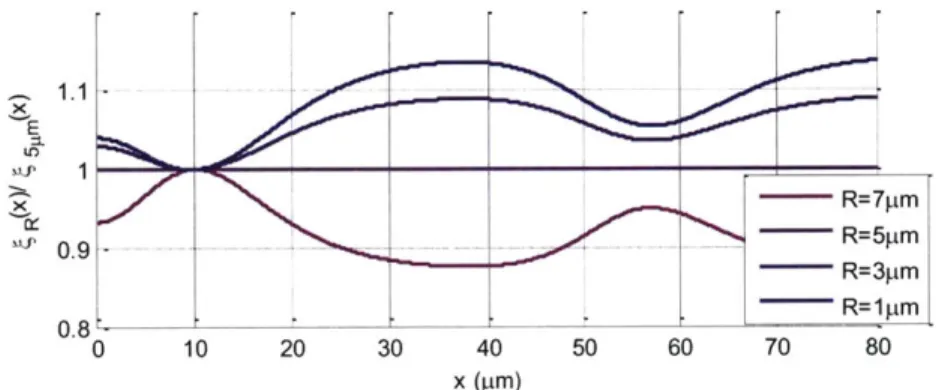
Figure 3-8 The deviation percentage of R (x) compared to particle of R=5 pm... 32
Figure 4-1 n-DEP force map as a function of frequency and conductivity. ... 34
Figure 4-2 The overview of the automated system. ... 35
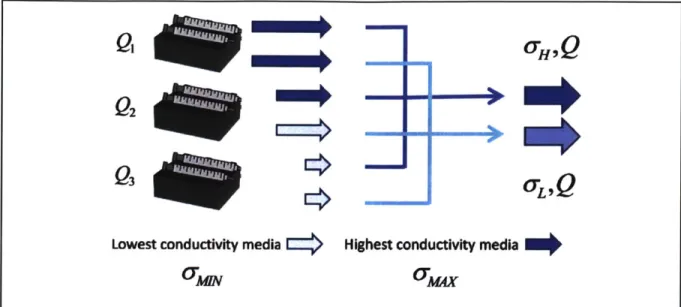
Figure 4-3 The scheme for the tri-pump system ... 37
Figure 4-4 The micro-mixer microfluidic device for demonstrating the dynamic concentration gradient control ... 38
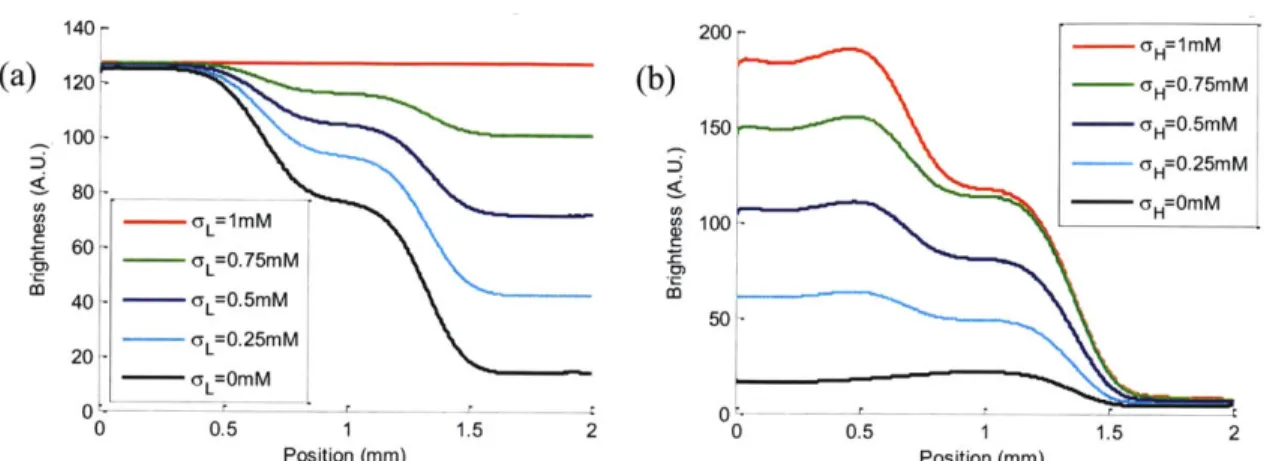
Figure 4-5 The dynamic control of concentration gradient system. (a) Control the high intermediate conductivity stream o-,,(C,) (b) Control the low intermediate conductivity stream -L (CL) *' ' '''' '''''''' '''''' ''' ''' '' '' ''' '' ''' ''... 39
Figure 4-6 The long term response of the conductivity gradient... 39
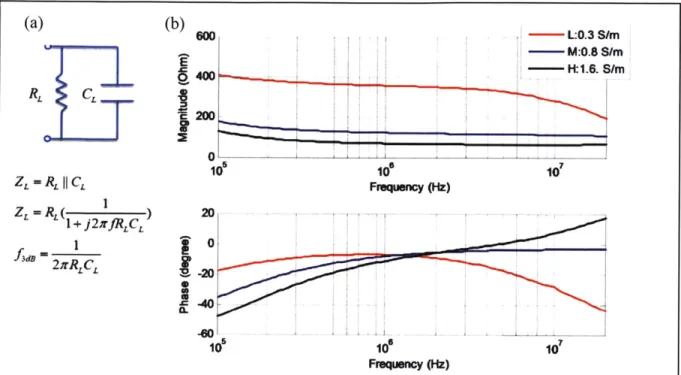
Figure 4-7 The short term response of the conductivity gradient.Error! Bookmark not defined. Figure 4-8 The frequency response of the parallel electrodes in different media conductivity. ... 4 2 Figure 4-9 Matlab GUI for automated system ... 45
Figure 4-10 The control panel of the Matlab GUI... 45
Figure 4-11 The Macro panel of the Matlab GUI... 46
Figure 4-12 The image processing for extracting the objects on the electrodes... Error! Bookmark not defined. Figure 4-13 The uncertainty of measuring the size of a cell. ... 48
Figure 4-14 The effect of different threshold to the area measurement from cell image. (a) The raw image (b) The background removed image (c) The binary image with normalized threshold 0.05 (d) The binary image with normalized threshold 0.1... 49 Figure 4-15 Comparison of the size measurement between the imaging segmentation and
C ou lter cou n ter . ... 50
Figure 5-1 The microfluidic device used in this thesis. ... 52 Figure 5-2 Experiment result for balance positions of 6 pm beads. (a) Representative images (median balance position) for Q=1 pL/min. The images are 20x50 pm big. (b) Representative histogram of the balance position (Q=4 pL/min and V=7 V). (c) The balance position measured from different
Q
and V. (d) The balance position as a function of V2IQ. ... 5 4Figure 5-3 The comparison between simulation and experimental balance position with different flow rates and voltages... 57 Figure 5-4 Balance position error between measurement and model... 57 Figure 5-5 Force ratio error between measured force ratio and model force ratio. ... 58 Figure 5-6 Standard deviation of the balance positions (6) measured in different frequencies and flow rates... 58 Figure 5-7 The IRe[CM]I (only negative part) for HL-60 Cells. ... 60
Figure 5-8 The Re[CM] for 6 pm and 10 pm polystyrene beads. I... 61
Figure 5-9 Particle images of (a) a mixture (b) 6 pm beads, (c) 10 pm beads, and (c) the
H L -6 0 cells...6 3
Figure 5-10 The systematic parameter C, for different frequencies and media conductivities using 6 pm bead as reference ... 64 Figure 5-11 The balance position histograms of the HL-60 cells, 6 pm beads, 10 pm beads in 0.3 S/m and different frequencies... 65 Figure 5-12 The balance position histograms of the HL-60 cells, 6 pm beads, 10 pm beads in 0.4M Hz and different media conductivities. ... 66
Figure 5-13 The calculated Re[CM] histograms in different frequencies and conductivities.
... 6 7 Figure 5-14 The comparison between model Re[CM] and the experimental Re[CM] in d ifferen t con d u ctivity... 68
Figure 5-15 Simulated conductivity profile along the electrodes of
Q =
1.5 pL/min... 70Figure 5-16 Classify the mixture through 3-dimensional clustering. (a) Images of a mixture of of 10 pm beads, 6 pm beads, neutrophils and erythrocytes. (b) Scatter plots of balance position, particle area, and intensity extracted from the images. (c) The classified populations can be verified by gating and examining the images of particles in each gated region. (d) Single-parameter histograms show overlap of the four populations... 72
Figure 5-17 The balance position histograms of activated an unactivated neutrophils in different frequencies and conductivities ... 73
Figure 6-1 Multi-parameters scatter plots for a mixture of cells and beads... 78 Figure 6-2 Discrimination of live and dead cells by frequency sequence. ... 80
Chapter 1: Introduction
In this chapter, we will introduce the background and motivation for measuring dielectrophoretic
(DEP) forces, the existing methods for measuring DEP forces, and our approach. Finally, we will
provide our specific aims and the overview of the thesis and in the last section.
1.1. Dielectrophoretic cell separation
Cell separation is an important technology for medical diagnostics, therapy and basic biological research. Label-free cell separation methods are a subgroup of cell separation methods that separate cells based on physical intrinsic properties such as size, shape, deformability, density and electrical properties [1]. Unlike commonly used cell sorting methods, such as fluorescent-activated cell sorting (FACS) and magnetic-fluorescent-activated cell sorting (MACS), label-free separation methods require no biochemical labels that would remain on the cells after the sorting. These methods include using mechanical filters [2], hydrodynamic force [3], deterministic lateral displacement [4], inertial forces [5], gravity [6], intrinsic magnetic properties [7], acoustophoresis [8], and dielectrophoresis [9]. Among these techniques, dielectrophoresis is the only method that separates cells based upon their intrinsic dielectric properties and therefore dielectrophoresis can perform separations that no other label-free methods can achieve.
Dielectrophoresis (DEP) has been actively applied to biosensors, cell therapeutics, drug discovery, medical diagnostics, microfluidic, and particle filtration during the past 10 years [10]. In the application of cell-based assays, it has been used to resolve different cellular identities in heterogeneous populations and to monitor cell state without bio-markers. Some common demonstrations include separation of different leukocytes subpopulations [11], viable/non-viable yeast cells [9] [12], and modified/unmodified bacteria [13]. Other interesting medical applications include enrichment of CD34+ cells from peripheral blood stem cell harvests [14], separation of cancer cells from blood [15], and isolation of malaria-infected blood cells [16]. Recently, dielectrophoresis has also been applied to stem cell research, investigating the relationship between the electrical phenotype and the differentiation state of neural stem cells
[17]. The miscellaneous applications indicate the potential impact of the DEP separation.
The DEP applications are based on the DEP force difference between target populations. Some of them use the difference of the DEP force directions (attractive/repulsive) to separate cells. Some of them use the magnitude of the DEP forces to separate the cells. For example, the separation of viable/nonviable yeast cells [12] used attractive/repulsive DEP force. Namely, the
DEP force pushes away the nonviable cells to the weak electric field (which we call negative DEP, or n-DEP) and attracts (which we call positive DEP, or p-DEP) the viable cells to the
strong electric field. On the other hand, the separation of leukocytes subpopulations [11] uses
n-DEP magnitude separation. Namely, the cells flow through a series of diagonal parallel
the larger the lateral displacement is. Both magnitude and direction DEP separation are important in different applications.
The DEP forces acting on the cells depend on a few things: the cell morphology (size and shape), the electrical properties of the cell, the electrical properties of the media, and the electric field. In particular, the frequency of the electric field and the media conductivity are the two factors that are easy to manipulate to affect the DEP separation. Finding the right frequency and the right media conductivity to separate target cells is important. Estimating the DEP forces in different frequencies and media conductivities can help us improve the DEP separation and understand the electrical properties of the cells. In this thesis, we are developing a new method and a new system for measuring the n-DEP forces on cells in different frequencies and conductivities.
1.2. Approaches for measuring the DEP force
Even though there are over 100 publications of the DEP cell separation device for the past 5 years [18], few of them tried to quantify the exact DEP forces acting on the cells because most
DEP separation devices only need to optimize its particular application, which can be done
without quantification of DEP forces, but rather by trial and error. However, quantifying the
DEP forces of the cells can help us determine the electrical properties of cells and why they can
be separated. There are some approaches have been developed for obtaining the DEP forces on the cells. We briefly review these methods below.
Hydrodynamic drag force balance: When the cell has relative velocity to the surrounding fluid
flow, the hydrodynamic drag force acting on the cell, known as Stokes' drag force, is well-understood in most microfluidic system. Therefore, several methods use the calculated hydrodynamic force as a known force to measure the DEP force.
Thomas Schnelle et al. has studied the n-DEP against the hydrodynamic drag force with the top-down parallel electrodes geometry [19]. They used a quarter circle-shaped electrodes to deflect the cells so that the hydrodynamic drag forces counteracted with the n-DEP force barriers were continuously changing (different angles between the flow and n-DEP force) in different parts of the electrodes. They estimated the n-DEP force by matching the corresponding hydrodynamic force where the particles passed through the quarter circle-shaped electrode. The advantage of the continuous flow system is measuring the n-DEP force for a lot of cells without stopping. However, the disadvantage is that the cells only pass through the electrodes once so that one cell can only be characterized under one condition. It is difficult to measure single cell in different frequencies or media conductivities.
Instead of having the flowing fluid, there are approaches of measuring the cell velocities in a static flow DEP system. Thibault Honegger et al. placed the particles on coplanar electrodes and applied a continuous frequency sequence to switch the DEP force between p-DEP and n-DEP
[20], and derived the DEP frequency spectrum for single particles. This method is highlighted for a wide frequency spectrum of the DEP force for single particles. However, the system does not work in highly conductive media because the cells only experience n-DEP in such high conductive media so the cells cannot concentrate on to the electrodes by p-DEP.
Gravitational force balance: There are approaches that use the gravitational/buoyant force as
the known force to measure the DEP force. In 1977, H. A. Pohl and R. Pethig measured the balance height between the gravity and the DEP force [21]. They put the particles on a pair of electrodes that generated an isomotive electric field and pushed the cells upward against the gravity. Recently, a Japanese group modified this method by putting the experiment in an inclined floor [22] to control the magnitude of the gravitational force. This method can measure very minute DEP forces at small inclined angle (25 fN) and obtain the frequency spectrum of the
DEP force of single particles (both p-DEP and n-DEP). However, the gravitational/buoyant force
of the cell is usually below pN and therefore the maximum DEP force this method can achieve cannot exceed pN and therefore limits the dynamic range of this measurement. Furthermore, the density of the particle is needed for calculating the corresponding DEP force.
Optical tweezers: There are approaches that use optical tweezers to measure the DEP force.
Optical tweezers are a technique that confines the cell in a small region using a focused laser beam to centralize the cell in the middle of the laser beam. The cell experiences a position-dependent optical force that moves the cell to the central of the laser beam due to the refractive index difference between the cell and the media. A German group has combined this technique with the dielectrophoretic cage [23]. They used the DEP force to calibrate the optical tweezers. Recently, a group at Lehigh University also used optical tweezers combined with amplitude-modulated DEP force to measure the DEP force [24]. However, the optical force depends on the laser power, the refractive index of the particle/media and thus requires calibration beforehand.
Automated high-throughput approaches: Instead of measuring single particles, there are also
approaches for measuring DEP forces on a population of cells in an automated and high-throughput way. Michael Hughes' group has developed a method for measuring the DEP response at different frequencies for a large population of cells using the light absorption intensity in DEP-activated microwells [25]. Another common method is to quantify the amount of cells that trapped by the p-DEP and correlate it to the magnitude of the p-DEP force [26]. However, in these approaches, single cell information has lost because they do not measure the behavior of individual cells.
Non-DEP approaches: The DEP force can be calculated from the dielectric properties of the
cells. Therefore, instead of DEP force, there are methods that measure the dielectric properties of the cells and then predict the DEP phenomena from the dielectric properties of cells. The common methods are electro-rotation [27] and dielectric spectroscopy [28]. These methods are
linked to the DEP force based on the dielectric model of the cell which we will describe in section 2.4.
Comparison among methods
Methods using the gravitational force or optical force require additional knowledge of the other cell properties such as density and refractive index of the cell, which are non-trivial to measure. Single-cell DEP measurement methods are usually time-consuming so that the number of cells measured is usually <100. The automated high-throughput approaches can measure many cells but usually lack single-cell DEP information. The impedance spectroscopy method and the electro-rotation are linked to the DEP force through dielectric models, which can be oversimplified for cells. They also require the single cell size information with the impedance/rotation rate to deduce the single cell DEP force. Therefore, a high-throughput method for measuring the DEP force on individual cells is needed. In this thesis we develop a continuous DEP force measurement method for high-throughput single-cell characterization using hydrodynamic and DEP force balance. The method is similar to Thomas Schnelle's approaches [19] but has several advantages which we will describe in the following section.
1.3. Introduction to the n-DEP spring
The n-DEP spring is a high-throughput method of measuring n-DEP force on individual cells using the force balance between the n-DEP force and the hydrodynamic force (Figure 1-1). This method is similar to Thomas Schnelle's approach [19], but instead of measuring the maximum holding force of the n-DEP barrier, we measure the n-DEP forces in different balance positions, 6, which counteracts with the hydrodynamic force. It has the advantage as a continuous characterization method while shrinking the needed field of view for detection within 50 pim square, and thus provides capability of high-resolution imaging. A similar method for measuring the DEP force through hydrodynamic force has described in the calibration of optical tweezers [23]. However, they did not implement their method in flow. The n-DEP spring method allows us to characterize the same cell many times as it flowing through. For the device geometry, instead of using a pair of top-down parallel electrodes, we use a simple fabricated parallel coplanar electrodes structure.
Essentially, the electrodes generate an n-DEP force gradient where the largest force occurs at the inner edges of the electrodes. In actuality, the DEP force is a 3D vector field but we can simplify the problem into 1-dimension through appropriate choice of electrode design [Figure 1-1(a)]. Even though 3D trajectory and motion analysis for extracting the DEP force is possible [29], simplification can reduce the number of parameters we need to measure.
We only analyze the force balance in a direction perpendicular with the central line of the coplanar electrodes but also in parallel with the substrate where the coplanar electrodes are on.
This makes the n-DEP barrier similar to a 1 -D nonlinear spring: the more you push the cell with the hydrodynamic force, the more the spring is compressed. By putting a smaller angle between the flow direction and central line of the coplanar electrodes, we can continuously measure the balance positions from the images for a large amount of cells in a higher throughput manner
[Figure 1-1(b)]. We can experimentally obtain the 1 -D n-DEP force as a function of the balance
position by giving different flow rates of the hydrodynamic force. The n-DEP force is proportional to the square of the applied voltage. Therefore, the stiffness of this n-DEP spring is also proportional to the square of the applied voltage. With the same hydrodynamic drag force, the larger the voltage is, the stiffer the n-DEP spring is, and the larger the balance position is. To give a qualitative idea of this method, we show the red blood cell images with different applied voltages [Figure 1-1(c)]. We can observe the balance positions increases when the voltage rises.
(a) n-DEP Force ydrodynamic Figure 1-1 The general idea of the n-DEP
6 rag Force spring. (a) The schematic of the 1-D
n-DEP spring. The n-n-DEP force from the
coplanar electrode (yellow) is like a nonlinear compressive spring because it has The n-DEP Spring a position dependent reacting force. The
(b) more the applied hydrodynamic drag force
Cells Buffer is, the smaller balance position, 6, is. The
stiffness of this n-DEP spring depends on several parameters: the voltage of the electric field, the cell size and the polarizability of the cell/media. (b)
Applying the n-DEP spring in a
-0 continuous manner. The angled coplanar
electrodes enable us to measure the balance position and the cell size in a continuous way. (c) The n-DEP spring for different voltages on the red blood cells. The balance positions of three different applied voltages are compared in the image. The balance position increases with the voltage. (c)
The benefits of the n-DEP spring method are the continuous measurement for the cells and its capability to measure the force in highly conductive media. The other aspect worth highlighting is, compared to Thomas Schnelle's approach [19] , the measurement only requires a small field of view so that we can minimize the field of view and thus use higher magnification to obtain high-resolution images of the cells.
The general constraint about this method is that this method can only measure the cells that are deflecting by the electrodes but not able to measure the cells that experience p-DEP forces or very small n-DEP forces that are overwhelmed by the hydrodynamic drag force. Another constraint is that if one wants to get the exact value of the DEP force, the size of the cell needs to be measured accurately to calculate the hydrodynamic drag force (explained below in section
Chapter 3: 3.3).
In this thesis, we will combine this n-DEP spring method with an automated system for quantifying the n-DEP force acting on the cells in different frequencies and different media conductivities. The measured result can assist the process of finding the right frequency and media conductivity for n-DEP magnitude separation of the cells. Furthermore, with the morphology information (size, shape), the electrical properties can be extracted out from the n-DEP forces. Therefore, the size, shape, and the electrical properties of the cells can be measured simultaneously for the same cell. The multi-modal electrical and optical parameters can be used for optimizing new label-free separation applications that use size, shape, and/or electrical properties.
1.4. Thesis overview
We have the following objectives in this thesis:
(1) The development of the n-DEP spring model for n-DEP force measurement: Derive the
analytical expression for the n-DEP force and hydrodynamic force. Calculate the analytical expression of the balance position. Experimentally verify the expression with standard particles. (2) The development of an automated system for generating various conditions for n-DEP force characterization: Develop a computer controlled dynamic conductivity generator to perform spatially and temporally changes media conductivity. Develop a computer controlled integrated system for automatic measurement of balance positions in different voltages, frequencies, flow rates and media conductivities.
(3) The n-DEP force measurement of the human promyelocytic leukemia cells (HL-60):
Perform a full electrical characterization of HL-60 cells in different frequencies and media conductivities.
(4) The demonstration of a real medical application--characterization of activated and
nonactivated neutrophils in different frequencies and media conductivities and find out the DEP separation condition.
Scope of the thesis
In order to understand the mathematic basis of this method, we will first introduce the underlying theory of DEP and the dielectric model of cells in chapter 2. Then we will introduce the analytical model for n-DEP spring in chapter 3. In chapter 4, we will describe the development of the automated system for providing dynamic control of media conductivity/conductivity gradient and different electric field frequencies.
Chapter 5 gathers the main experiment to demonstrate the data for objectives (1)-(4). To validate the n-DEP spring method, in section 5.1, we will show the 6 prm polystyrene beads as the standard particles to experimentally validate the balance position model. In section 5.2, we will demonstrate the first automated high-throughput n-DEP force measurement of HL-60 cells at various frequencies and media conductivities. To show the power of fast characterization of the cells, we will show the n-DEP spring applied in a real medical application: finding the DEP separation conditions in activated neutrophils and non-activated neutrophils in a short amount of time. The system we have developed is not limited to study the electrical properties of cells but also optical properties of the cells. In the chapter 6, we will conclude our contributions and provide some interesting preliminary result of the future direction using the electrical and optical properties simultaneously.
Chapter 2: DEP theory and the dielectric properties of the cells
We introduced DEP separation and its application in section 1.1 in a qualitative fashion. In this chapter, we will introduce the mathematical formulations of the DEP force and the dielectric properties of the cells. In section 2.4, we will introduce the existing method of measuring the dielectric properties of cells and compare the pros and cons of the DEP characterization with other methods. In the end, we will describe how our method fits into the niche of DEP characterization.
2.1. DEP force and the Clausius-Mossitti (CM) factor
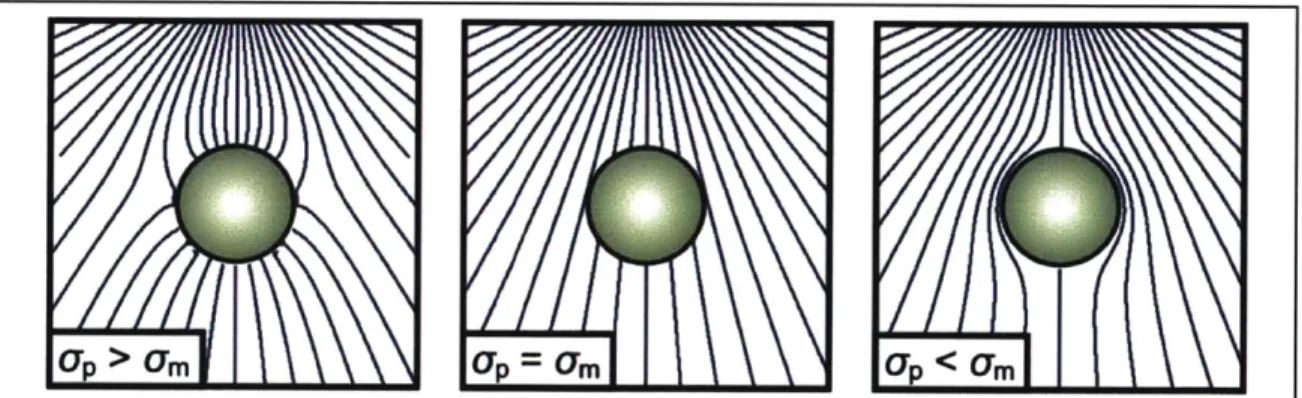
Inside a static electric field (E), the particle and the surrounding media are both polarized to form a dipole moment. The effective induced dipole moment (p) is either parallel or anti-parallel to the applied field (Figure 2-1 (Pohl and Crane 1971). If the electric field is uniform, there is no net force acting on the particle. However, in a spatially non-uniform electric field, the dielectrophoretic (DEP) force will either move the particle toward stronger electric field (positive
DEP ) or toward weaker electric field (negative DEP). The direction of the force depends upon
the electrical properties of the particle and medium.
Figure 2-1 Polarization of a particle in an external non-uniform electric field. For
relatively conductive particles (left), the dipole moment and electric field align parallel to each other, leading to lower potential energy at higher electric field strengths, known as
p-DEP. For relatively insulating particles (right), the dipole moment and external field
are anti-parallel, causing particles to be expelled from regions of higher field intensity, known as n-DEP. If the electrical properties of the particle match those of the medium (center), the polarization vanishes and there is no preferential motion towards higher or lower field strengths. Adapted from Mike Vahey [51].
FDP = (p -V)E = 21rR3c, Re[CM(w)]VE2
(2-1) where R is the particle radius, e,, is the permittivity of the media, E is the amplitude of the electric field, w is the frequency, and CM(w) is the Clausius-Mossitti(CM) factor which is given by
CM(w) = -!2 (2-2)
where e, and _, are the complex permittivity of the particle and media, respectively. The sign of the Re[CM(w)] determines the force direction. Due to the mathematical formulation of CM factor, the real part of the CM factor is always between -0.5 and 1.
The media can be considered as a loss-free capacitor in parallel with a resistor. Therefore, the complex permittivity of the media e,, is a combination of permittivity and conductivity of the media solution.
61,, ='CM + (2-3)
-jW
For example, in phosphate buffered saline (PBS), the media permittivity 8,,. is 78.5 co and the
media conductivity o-, is 1.6 S/m. For a typical DI (de-ionized) water, the media conductivity a,. is around 0.01 mS/m. For an ideal pure water at room temperature, the media conductivity U,, is
5.5 pS/m .
The complex permittivity of the particle is determined by the materials comprising the particle. If the particle is composed of a uniform material, the particle can be modeled similarly to the media. eP =eCP + 7P(2-4)
- jW
For example, the polystyrene (PS) latex beads, the permittivity es is 2~3 co and the conductivity
0- is composed of two parts, the surface conductivity c, and the bulk conductivity
ab . In theory,
the bulk conductivity of the micro-submicron latex beads is negligible compared to the surface conductivity a, which is inversely proportional to the particle radius R and proportional to the general surface conductance K, (~1 nS for PS beads).
07P ab+ 07 = 7 b
KS(2-5)
R
In low frequency range, the CM factor mainly depends on the conductivity of the particle and media.
( +j(W, W (jwe +C P) (W6r + a.) 07P - (2-6
CMM P(+ ) + 2(,,, +n0 ) (IGwep + op)±+2(jwen, +ra.) o-p+u. 26
jW JW
As a result, for micron size PS beads, the CM factor is positive in low-conductivity media (DI water) and negative in high-conductivity media (ionic solution).
2.2. Dielectric models of the cells
Unlike uniform latex beads, cells have more complex composition and different behavior than beads. Dielectrically, the cells are composed of several layers of materials. For example, a typical mammalian cell consists of cell membrane, the cell cytoplasm, the nuclear membrane, and the nuleoplasm from the outside to the inside of the cell. Each layer of the cell has distinct dielectric properties.
In order to match the true composition of the cell, the shell model has been developed to simulate
the dielectric properties of the cell [30]. The single shell model [Figure 2-2(a)] and double shell
model [Figure 2-2(b)] consider the cellto be composed of two and four concentric spherical shell layers of uniform conductivity and permittivity, respectively.
For the single shell model [Figure 2-2(a)], there are six parameters, including R, d, Cme, ,nem
c,, a,. The effective complex permittivity of the cell c is given by
R - - - e_ _ ( ) +2( " ) R -d Ei + 2en 8 " "iEeI R C (2-7) R 3( ±.nem
-Similarly, the mathematical formulation of equation (2-7) can be recursively done with multiple layers of different material.
~o) (b)
ii. . Two electcical models o a cell. (a) inagle-Shell model. (b) ouble-shllmodel. is The ell phase paraernters are represented by coin-pla permaittivity defined by a0 - e - Juwess,,: c. reive permittivity:
w. conductivity- -m - 2u-/: f. frequency. a.. permitivty cot vacuum". j.
imainairy _nity. The subscripts refer to the following phases m l.
plasma mmbrane; , pp. Ie phase of cell; ne. cytoplasm; nuclear
cnvelope; ap. aaacieoplaumn. Trhe nmrphologlical parameters are: R.
outer radius of celll outer radius R, nucleus: thickness Ofof d.
oplsma mmb rane; d_.. thickness of nuclear ennvlope.
Figure 2-2 Two electrical models of a cell. (a) Single -Shell model. (b) Double-shell model. The cell is composed of concentric uniform layers of different complex permittivity( e = e + aClw ). The subscripts refer to the following phases: m, plasma membrane; i, inner phase of cell; cp, cytoplasm; ne, nuclear envelope; np, nucleoplasm. The morphological parameters are: R, outer radius of cell; R, outer radius of nucleus; d, thickness of plasma membrane; d, thickness of nuclear envelope. Figure adopted from [32].
For a cell with a thin membrane, there is another representation of, which is given by [31
6-R+, (2-8)
pbiain incthn
where the membrane coplex capacitance pot ,,e,,, + Gieii / 1w . C,,,e,,, and G,,,,,, are the
membrane capacitance and conductance which is derived frome equed and Uepdcid.
Asami et ao measured the dielectric properties of mouse lymphocytes and erythrocytes in suspension using dielectric spectroscopy [32]. They fitted the measured complex permiivityhe of erythrocytes and lymphocytes with the simulation of single-shell and double-shell model. They extracted out the parameters of the shell model which have been referenced from various publications since then.
2.3. Re[CM map and the Iso-dielectric point
From the single shell and double shell model, one can deduce the frequency dependency of the DEP behavior by their mathematical formulations. At lower frequencies, the DEP force mainly depends on the membrane properties. In higher frequencies, the force mainly depends on the cytoplasm conductivity (and/or the nuclear and cytoplasm ratio for double layer model). The DEP force is not only a function of frequency but also a function of electrical properties of the media. The common approach to disturb the DEP response of the cell is to change the media conductivity and the frequency. Therefore, we often use the 2-D (media conductivity and frequency) Re[CM maps to explain the dielectric response or DEP separation of cells. The 2-D Re[CM] map as a function of frequency and media conductivity in Figure 2-3 can help us
estimate the magnitude and the sign of the DEP force. In general, for cells, the Re[CM] is usually negative at high conductivity media because the media is more polarizable than the cell.
0.8 0.8 10 00.4 U_ -0.2 104 1 0 0.2 0.4 0.6 0.8 1 1.2 1.4 1.6 Medium Conductity (S/m)
Figure 2-3 The real part of the Clausius-Mossitti factor as a function of the frequency of the external electric field and the media conductivity. The white-line shows the IDP
(iso-dielectric point) curve where the particle experiences zero DEP force. The blue area on the right side is the condition where the cell experiences p-DEP force (Re[CM] <0) and the left side is the condition where the cell experiences p-DEP ( Re[CM] >0 ). The white-line shows the
condition where the cell experiences no DEP force (Re[CM] = 0). We term any point this line as
an iso-dielectric point, and the related frequency as the cross-over frequency. The electrical parameters for this figure come from dielectric spectroscopy for human white blood cells [11]. 2.4. Methods of measuring the dielectric properties of cells
Over the past century, people have developed different methods to measure the dielectric properties of cells. The earliest work was comparing the conductivity of erythrocytes in high and low frequency in 1910s and they proved that cellular membranes exist electrically by the different response at low/high frequencies [33]. Following that, many techniques have been developed for dielectric measurement of cells, including dielectric spectroscopy [34], electro-rotation [35], and dielectrophoresis. We briefly introduce the three listed methods below.
Dielectric spectroscopy (bulk impedance measurement):
Dielectric spectroscopy is one of the earliest tools used in dielectric characterization of cells. Typically, the impedance of a cell population is measured using an impedance analyzer. The suspension is held in a reservoir containing two, three or four electrodes. An AC excitation signal is given to the suspension and the current passing through the system is measured as a
function of frequency. The relation between the complex permittivity ,,,(w) of the whole mixture and the CM factor is given by
&x(W) =m C.1+ 2<pCM(w)
_,,_ w) _,, (2-9)
1-<pCM(w)
where the <p is the volume fraction of the cells and the media. Electro-rotation (ROT):
Typically, electro-rotation is performed by putting a cell inside quadruple electrodes with four
AC sinusoidal signals, successively 900 out of phase and thus creates a rotational electric field surrounding the cell. In the rotational electric field, if the induced dipole moment is not in phase with the electric field, a torque will act on the cell and make it rotate. The time-averaged torque
is given by
1ROT m-4;rcR3 Im[CM]E 2 (2-10)
and depends on the sign of the imaginary part of the CM factor (Im[CM]), the cell will rotate with or against the electric field. The electro-rotation is measured by analysis of the rotation rate, which is given by
RROT = Im[CM]E' K (2-11)
2q
where q is the viscosity of the media and K is a scaling factor. Dielectrophoresis (DEP):
The DEP force for a spherical particle inside non-uniform electric field was described in equation (2-1). Methods for measuring DEP force, including hydrodynamic drag force method, optical tweezers method, and gravitational method, were described in chapter 1.2. For the methods using velocity measurement, the step response of the velocity of the particle after initiation of a uniform DEP forceis given by
F
Fn1;R7u = DEP ± (U0 -DEP )-1(m/6R (2-12)
6xRt 6 R7
where 7 is the viscosity of the media and u0 is the initial velocity.
From equation (2-1), it is worth noticing that if one wants to calculate the Re[CM], the size of the electrodes and the electric field gradient needs to be measured or calibrated. Alternatively, most DEP characterization methods chose to measure the DEP crossover frequency
(Re[CM(w, o-)] =0) as a function of conductivity. The information, however, is not sufficient
to determine the dielectric properties of cells in highly conductive media where the cell has no cross-over frequency. Also, the crossover frequency method is mathematically insufficient to obtain the entire c, (w) without electrical models of the cell. However, with the measurement of Re[CM] values in different conductivity, we can obtain the entire e,(w) without any electrical models. We will discuss the details in Appendix -B: Determining the electrical properties of the cell from Re[CM].
Discussion:
Dielectric spectroscopy (impedance method) can acquire the real part and imaginary part of the CM factor but it requires information of the volume fraction, which is not easy to get. The other caveat of dielectric spectroscopy is that the measurement of a mixture of cells is an average over a population rather than the electrical properties of a single cell. Recently, single impedance cytometry [36] has been developed to overcome this problem. This technique can measure single cell impedance in a flowing microfluidic device, but the measurement did not measure and decouple the morphological effect from the electrical properties. ROT can measure the rotation rates of a cell at different frequencies while obtaining optical information, and thus provide rich information for the imaginary part of the CM. It is famous for its sensitivity of dielectric characterization but also notorious for its low throughput and cumbersome cell loading process. On the other hand, DEP characterization is usually limited to cross-over frequency characterization because the DEP force is proportional to volume and it is hard to decouple the size and the Re[CM]. There are approaches of size-insensitive characterization methods like DEP-FFF. However, there is no successful high-throughput method like single cell impedance spectroscopy for DEP characterization. The n-DEP spring method fits into the niche of high-throughput single cell measurement for DEP characterization where Re[CM] is negative.
Even though the experiments in this thesis only measure the DEP response of cells at a single frequency, the method can easily be extended to measure a frequency spectrum of Re[CM] of a single cell by applying a frequency sweep and tracking the cell position.
Thus, the n-DEP spring is a new way of extracting the dielectric properties of single cells that can potentially improve the DEP characterization and make them comparable to ROT and single cell impedance spectroscopy.
Chapter 3: n-DEP spring model
Now that we have introduced electrical forces and described different ways to extract out electrical properties of cells, in this chapter we will derive the analytical model for the n-DEP spring extraction method. The n-DEP spring method uses the force balance between the position-dependent DEP force and the constant hydrodynamic drag force to measure the DEP force from a particle's equilibrium position. We first discuss the hydrodynamic force drag force in the microfluidic channel and then evaluate the DEP force created by coplanar electrodes. By balancing the two forces, we determine the theoretical balance position as a function of flow rate, applied voltage, cell size, and the electrical properties of the cell. In section 3.6, we will describe relation between the balance position and binary n-DEP separation on the angle coplanar electrodes. At last, we describe the conditions where other forces become significant and their effect on balance positions.
3.1 Method overview
The n-DEP spring is a force balance method for measuring the negative DEP forces acting on individual cells in a continuous manner. The cell first enters the microfluidic channel from the inlet and flows with laminar flow until it runs into the electric field from the coplanar electrodes
(Figure 3-1). The negative DEP force forms an invisible barrier to deflect the cell. The deflected
cell reaches a force balance and moves along the electrodes with constant velocity. We use 8, the balance position between the hydrodynamic force and the DEP force in the direction perpendicular to the electrodes, to extract the electrical properties of the particles.
To use the n-DEP spring to extract electrical properties, we need to theoretically analyze the
Cop elec
Flow
Cell Buffer
Figure 3-1 The n-DEP
spring method overview.
Cells (or other particles) are ed introduced into the channel along with buffer flow. As the cells flow down the channel they encounter the
electrodes where they
experience a DEP force (red, inset) that balances the drag force. The equilibrium balance position between the two forces is denoted by .
force balance for the deflected cell. We are going to find how the balance position relates to the electrical properties of the cell, the cell radius, the flow and the electric field.
3.2 The force balance of a particle moving along a pair of diagonal coplanar electrodes
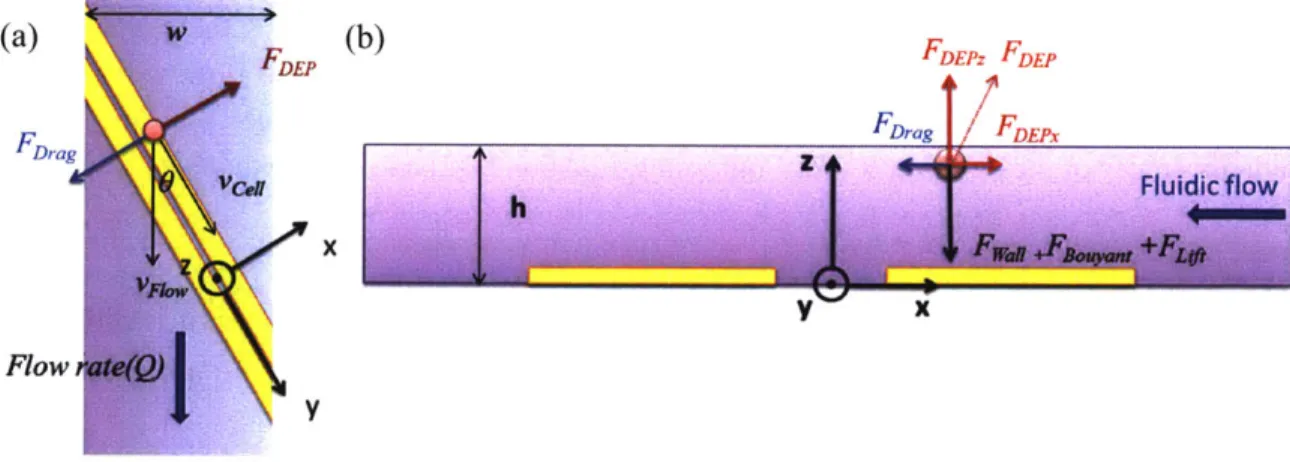
The predominant forces acting on the deflected cell are the DEP force, hydrodynamic drag force, the contact force from the wall, the buoyant force and the lift force (Figure 3-2). In the z-direction, the DEP force is larger than the lift force and the buoyant force so that the cell is pushed by the DEP force to the ceiling of the channel. The reacting force from the ceiling offsets the excessive DEP force in the z-direction. Therefore, the buoyant force and the lift force do not affect the balance position unless they become comparative to the DEP force in z-direction. In the y-direction, the cell moves along the electrodes with constant velocity. The hydrodynamic drag force counteracts the friction force between the particle and the ceiling. In the x-direction, defined as perpendicular to the electrodes, we consider two predominant forces, the DEP force and the hydrodynamic force, in our first-order model. In the next two sections, we solve for the hydrodynamic drag force and the position-dependent DEP force to determine the balance position. There are some second-order forces, such as the friction force and the electro-hydrodynamic force that could affect the force balance and hence the balance position.
(a) (b) FDEPz FDE
Fora Fnrg IFDEPx
x
Flow
Y
Figure 3-2 The force balance of the particle flow along the coplanar electrodes. (a) The top-down view of the microfluidic channel. (b) The cross-sectional view of the coplanar electrodes.
3.3 The hydrodynamic drag force in a microfluidic channel
The Reynolds number is a dimensionless number that represents the ratio between inertial forces and viscous forces in hydrodynamics. For Reynolds number much smaller than 1, the viscous force dominates and the Stokes' flow occurs. For water or physiological media flowing in a 20 ptm by 2 mm rectangular channel with flow rate of 10 pL/min, the dimensionless Reynolds number is 0.167. Therefore, because our operating flow rates are at or below 10 pL/min, the flow
in our microfluidic channel can be treated as Stokes' flow. Mathematically, for a spherical cell moving in a uniform Stokes' flow, the hydrodynamic drag force (FDrag ) is given by
FDrag =6 v Cell (3-1)
where q is the viscosity of the fluid. v is the average velocity of the flow which points to the outlet and vCell is the velocity of the cell which points along the electrodes. We can decompose the drag force into two components: FDrgx (perpendicular to the electrodes) and FDra,, (parallel to the electrodes). The two individual components are given by
FDag, =-6xy R sin 0v1 vFO,|, (3-2)
F = 6,rR(|vFIo I Cos 0-| VCell ) (33
However, in a thin microfluidic channel, the pressure-driven flow is not a uniform plug flow but a Poiseuille flow. The aspect ratio of channel width to channel height is 100 and therefore the flow can be considered as a plane Poiseuille flow. Since the entrance length for the flow is a small fraction of the channel length, we assume that the flow is fully developed. Fully developed plane Poiseuille flow has a parabolic profile along the z-axis. The flow rate profile is given by
6Q
vFlow,(z) =h 3 z(h - z) (3-4)
where
Q
refers to the volumetric flow rate, w is the channel width, and h is the channel height. The average velocity experienced by the cell can be approximated as the flow velocity at the mass center of the cell. The cell is pushed to the ceiling by the upward-directed n-DEP force, so the mass center of the cell is at h - R. Combining equation (3-2) and (3-4), we haveF g -61riqR sin 0 6Q (h - R)R (3-5)
In the case of h>>R, the hydrodynamic drag force is proportional to R2. If not, it is proportional
to slightly less than R2 . Since in our case of R ~ h, we use equation (3-5) as our approximation of the hydrodynamic drag force.
3.4 The electrical field and the DEP force on a pair of coplanar electrodes
The other predominant force is the DEP force. We are specifically concerned with the DEP force produced by coplanar electrodes. This could be modeled as a number of different ways. We chose to simulate the electric field of coplanar electrodes using conformal mapping. Schwarz-Christoffel mapping [37] maps the potential from the parallel plate capacitor to the coplanar electrodes and provides an analytical solution for the electric field. In the model, we assume the coplanar electrodes are in an insulating microfluidic channel with channel height 20 Pm and infinite channel width. The electrode width is 46 ptm and the gap between two electrodes is 16.3 pm which is measured from an actual device. The simulation result of the electrical potential is shown in Figure 3-3. The blue lines show the equipotential lines of the electric field and the two red lines are the coplanar electrodes. As expected, the strongest field appears at the inner edges
of the electrodes. As we move further away from the electrode edges, the potential lines get farther apart, indicating that the electric field is smaller. Therefore, the n-DEP force is forcing the cell away from the central line of electrodes.
x104M FDEPx
1
---8 .6 -4 -2 0 2 4 8 8
x 10'm Figure 3-3 The simulated electrical potential above a pair of coplanar electrodes. The blue
lines denote equipotential lines created by electrodes (red). The solution is obtained via conformal mapping as developed by [38]. The dashed blue line represents the line along which the DEP force is plotted in Figure 3-4.
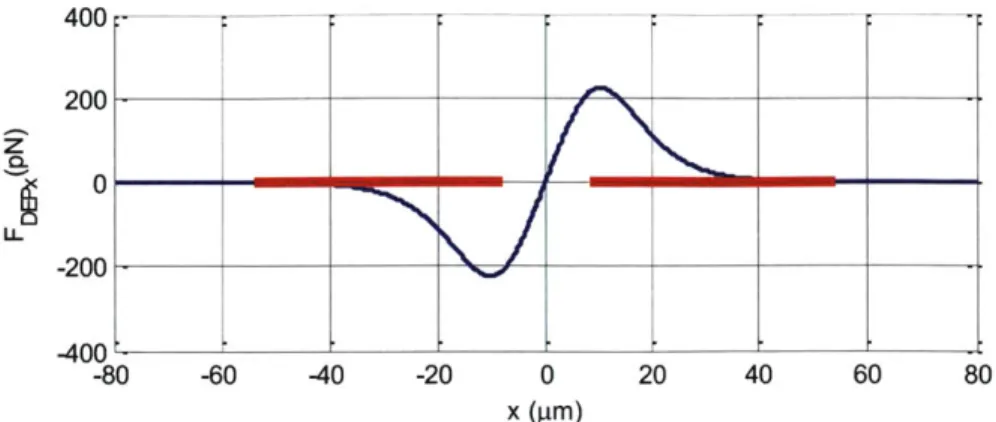
We want to get an analytical representation of the DEP force along x (FDEPx ). Similar to the
methods used in deriving the DEP force in different levitation height in DEP-FFF [39], the mathematical formulation of the FDEPx can be given by
3E~x aE 2 (x, h-R) 3 (X)V 2P(f)
FDEPR =2RcR e[CM] ' =2cR E,,, e[CM]qR (3-6)
ax
where E2 (x, h - R) is the RMS value of the electric field strength for an applied RMS voltage
VRMS at location x and height h-R. The p(f) is the normalized function that corrects the
frequency-dependent voltage drop at the electrode/solution interface. qR(X) is a function that reflects the positional dependency of the DEP force, the shape of this function is determined by the electrode geometry: the electrode gap (g), the electrode width (w) and the channel height (h). The magnitude of qR(X) scales inversely with the cube of the electrode gap ( qR ( -9g3). Different from the DEP-FFF formulation, qR (x)in our case is size dependent. This is because different particle sizes are levitated to different heights (h-R) when they are pushed to the ceiling, so they experience slightly different electric-field gradients.
We plot FDEPx as a function of x for a 5 tm radius particle in Figure 3-4. For x>0, the force is always positive (pointing to the right) and for x<0, the force is always negative (pointing to the left). The maximum of FDEPx is at x= -10.4 pm where it is the maximum n-DEP barrier created by the pair of coplanar electrodes. We use the region where x>10.4 ptm to form the force balance
400 1= I- ______ ______ ______ -60 -40 -20 0 x (pm) 20 40 60 80
Figure 3-4 The DEP force along x direction for R=5 pm at the height 15 Im. Other
simulation parameters for this plot are: p(f) = 1, Re[CM] = -0.5, VRMS = 7.07V, channel height
= 20 pm, electrode width = 46 pim, and electrode gap = 16.3 pm. 3.5 The balance position of the two forces
After solving the hydrodynamic drag force and DEP force, we plot the two forces in Figure 3-5 according to equation (3-5) and (3-6) to find the balance position 6 at the intersections of the two.
FDEPx + FDragx = 2rR c,,, Re[CM]q (6)RMS2p(f) - 6zriR sin 0[6Q (h - R)R =0
1wh' (3-7)
There are two intersections but the inner side intersection is not a stable solution because the force gradient is pushing the particle away from its equilibrium. Only the intersection greater than L, the position of maximum DEP force (FDEPxXY ), can form a stable force balance. We
define this balance position as 65.
FDEPxMX 300 200 --- --- -- - - ---. . .. . ..-.. - ---.. ---100 0.. .. .. . U-.8 -4 4 -2 0 2 4 6 8 x 10*m
Figure 3-5 The two forces in the x-direction. The balance position 6 is the right intersection of
the blue line (hydrodynamic drag force) and the red line (DEP force) because the left intersection is not a stable equilibrium.
200 0. 0 -200 --400 --80
After reorganizing equation (3-7), we have the explicit expression of the balance position as
= qR - L wr J (3-8)
Re, Re[CM]VRMS2 p(
From this formula, we can analytically deduce the balance position from the theoretical model which we will compare the experimental result with in section 5.1. The balance position depends on the VRMS2/Q. Therefore, for the same particles if we increase the flow rate by 4 and increase the voltage by 2, the balance position should remain the same.
If we change the frequency or the media conductivity, not only the Re[CM ] will change but also the p(f), the normalized frequency response of the system, can be accommodated from an impedance measurement [39]. We chose to experimentally compensate this effect by using known Re[CM] (modeled) standard particles (polystyrene beads) as a reference to characterize
p(f) while estimating the Re[CM] of the cells.
Unfortunately the balance position has size dependency in many places. The hydrodynamic drag force, the original DEP force formula (R3) and the position dependent function qR(x) are all size
dependent. Therefore, we need to measure R while measuring the balance position in order to obtain the Re[CMj].
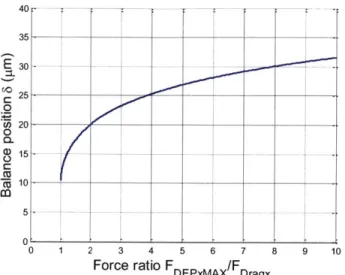
3.6 The force ratio and the binary separation on the angle coplanar electrodes
The binary separation (pass/deflected) on the angle coplanar electrodes depends on the hydrodynamic drag force FD,, and the maximum DEP barrier FDEPxMAx . Theoretically, if
FDEPxMAX <FDagx the drag force will overcome the DEP barrier and make the cell pass through the electrodes. If FDEPxMAx >FDragt , the cell could be deflected by the electrodes and hold a
balance position. Therefore, we define the force ratio FDEPxMAX /FDra as the criteria of the binary
separation on the angle coplanar electrodes. The larger the force ratio, the larger the barrier margin it is for the cell to pass through the electrodes. The force ratio formula is given by
FDEPxMAX _ 2zR'c, Re[_CM]qR(L)VMSp(f) - wh's P(f RMS
2
[R (L)R Re[CM]
FDrag 6z7R sin0 6Q (h - R)Rl 187sin9
Q
(h-R)where the first term on the right hand side is the geometry and system factor, the second term is the dynamic tuning factor that can be changed during the experiment to perform different binary separations, and the last term is the intrinsic separation factor on the angle coplanar electrodes. If