Cardiovascular Research, 1970, 4, 371-379.
Instruments and techniques
Pulsatile velocity of
blood in the pulmonary
artery of
dogs: measurement by an
ultrasound gauge
G. Fricke, U. Studer, and
H. D.
Scheu
From the Medical Policlinic of the University of Zurich Medical School
Authors' synopsis An advanced model of an ultrasound Pow gauge, mounted on a N7 catheter was used to measure Pow velocity in the pulmonary artery of closed-chest dogs. The recorded flow signals were calibrated in cmlsec by determining stroke volume (by dye dilution) and dia- meter of the pulmonary artery (by angiography). The influence of positive and negative inotropic drugs on velocity and acceleration is reported.
In 1965 Scheu, Sager, and Veragut described the application of an ultrasound catheter-tip gauge for the intravascular measurement of velocity of blood flow. The instrument was used in the aorta of dogs with open chests and its signal compared with that of an electro- magnetic flowmeter of the cuff type. The ultrasound flow gauge described at the time was too large and too fragile to allow its insertion in the pulmonary artery.
Since that time a number of catheter-tip flowmeters have been developed, based on different principles such as the Halleffect (Bond and Barefoot, 1967; Mills and Shil- lingford, 1967), the Dopplereffect (Stone, Stegall, Bishop, and Laenger, 1967) or dissipation of heat by thermistors (Grahn, Paul, and Wessel, 1968). The velocity measurement based on the differential pres- sure along the stream axis has been improved by Pieper (1963). Our own ultrasound device has been improved in collaboration with the Institute of High Frequency of the Swiss Federal Institute of Technology (director, Professor F. Borgnis). The gauge today is considerably smaller and mechanically more stable, so that measurements in the pulmon- ary artery of dogs are possible without open- ing the chest. Studer (1970) has described the technical improvements and the results of testing of the gauge in vitro. We report here the results of in vivo testing of the new gauge.
Accepted a9 October 1969.
Methods
A description of the principles of measurement and of the apparatus was given by Plass (1964) and more recently, by Studer (1970). In brief, the technique uses a combination of ultrasonic pulses and phase discrimination. The sound transducers are positioned at a fixed distance apart within the blood stream and are excited by sine wave pulses of high frequency in opposite phase. After having traversed the flowing medium the sound waves are received by the transducer at the opposite end of the gauge, which at this time is acting as a sensor. The difference in phase, A?, of the received signals is proportional to the velocity of flow:
2L
-
4
= - Ca - v as AT =
-
AT =2
CaloL
v(x) dxw
dcp N V(X) and w = const
Actually the gauge is influenced by only that component of velocity of flow that is parallel with the axis of the gauge. V(x)=v(x). cos a, where a is the angle between the gauge and the
stream axis. In vitro experiments (Studer, 1970) have shown that this factor is of little importance, at least up to angles of approximately 15".
I The measuring gauge
The flow velocity gauge is mounted at the end of a F7 Teflon catheter with an outer diameter of
372 Fricke, Studer, and Scheu
I
J Pulse- Generator 11 Stageu
Discriminator Meter1
I I + I Receiver-I - I
S taneI
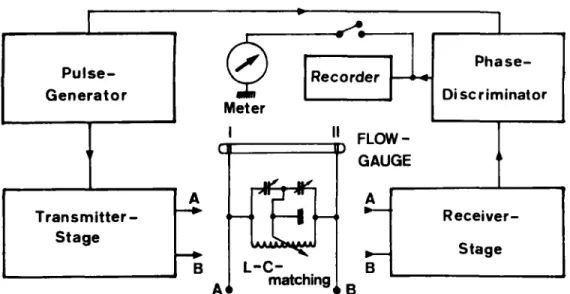
F I O . I Simplified block diagram of the apparatus. For more details see Studer (1970).
F I G . 2 A. The ultrasound catheter in the
introducer. Through a side arm pressure at the end of the introducer can be monitored. The polyethylene tubing has an internal diameter of 2.7 mm as compared with the outer diameter of the ultrasound gauge of 2.3 mm. B. The ultrasound gauge protruding from the tip of the introducer. Length of the gauge between transducers:
15 mm. Overall length of the body of the gauge: 23 mm.
2.3 mm. The gauge itself is ground out of a
steel cylinder with an outer diameter of 2.3 mm. The sides are milled off, leaving two narrow strips only. The length of the body of the gauge is
15 mm. On each end we place a lead zirconate crystal with a diameter of 1.34 mm and a thick- ness of 0.2 mm. The peripheral end of the gauge is prolonged by a length of KIFA red Oedman catheter of approximately 7 cm t o improve positioning of the gauge and, by fixation in a
peripheral pulmonary artery, to minimize its movement. The back of the sound transducers is electrically coupled by contact with the steel cylinder. The front sides are soldered with wires of 0.05 rnm diameter to leads of special copper coaxial cables that can be introduced easily within the F7 catheter with its inner diameter of 0.47 mm. Before use, the transducers must be isolated with a thin layer of Araldite.
2 The electronic unit
Figure I shows a block diagram of the apparatus with the functional units. The main difference from the apparatus described by Plass (1964) is in the use of phase discrimination in place of comparison of amplitudes (Studer, 1970).
3 Introduction of the gauge into the pulmonary artery
To facilitate positioning of the gauge in the main branch of the pulmonary artery a special intro- ducer was developed. It consists of polyethylene tubing 90 cm long with an outer diameter of
3-3 mm (FIo) and an inner diameter of 2-7 mm (Fig. 2). Since the tubing is a little wider than the F7 Teflon catheter of the measuring gauge, pressure can be monitored simultaneously through
a side arm of the introducer. The introducer is advanced from the right femoral vein to a peri- pheral pulmonary artery using a red Oedman catheter with a mandrel in place of the ultra- sound gauge. After positioning the Oedman catheter is withdrawn and replaced by the measur-
373 Pulsatile velocity of blood in the pulmonary artery of dogs
A Flow gauge catheter
a Gauge body with prolonged tip
B Cineangio- catheter C Aortic catheter
D 2 cm
-
measure below animalE 2 crn- measure above animal
F I G . 3
A : in the pulmonary artery of a dog. The animal was turned at approximately right angles for the two films. The other catheters are B: cineangiography catheter in the right ventricle. C: F7 catheter in the aorta. Below and above the animal z cm markers ( D and E ) can be seen.
Two angiographic projections of the ultrasound gauge: a: at the end of its catheter,
ing gauge in such a way that the ultrasound gauge protrudes 5-10 mm from the end of the introducer. By monitoring pressure and with radiographic control, the instrument can then be withdrawn until it is positioned just distal to the pulmonary valves in the main stem of the pulmonary artery.
4 Calibration
Experiments in uitro showed differences of sensi- tivity with changes of temperature and haemato- crit (Studer, 1970). A calibration method with blood of the experimental animal at 37°C is under development. For the experiments reported, we used a calibration in uiuo with dye dilution tech- niques and compared the calculated stroke volume with the area under the velocity signal of the ultrasound gauge.
5 Experimental procedure
Six mongrel dogs of 32'5-53 kg weight were used. Morphine was given subcutaneously in a dose of I mg/kg body weight I hr before the experiment. Anaesthesia was provided with chloralose 9% given intravenously at a dose of I ml./kg body weight. Artificial respiration was maintained with a n Engstrom respirator. Anaes- thetic agent was added during the experiments as needed. The femoral vessels were dissected free on both sides, as well as the right jugular vein. Catheters were then introduced as follows: ( I ) a
catheter for infusion and drug injection and, in some experiments, a catheter with a bipolar electrode for stimulation in the right ventricle were advanced from the left femoral vein; (2) an angiographic catheter (Ruesch FIO) was passed into the right ventricle from the right jugular vein for injection of dye or angiography contrast medium; (3) a Cournand F7 catheter was ad- vanced into the aortic arch from the left femoral artery to monitor pressure and to withdraw blood for dye dilution measurements; (4) finally, the introducer was advanced to a peripheral pul- monary artery from the right femoral vein as described above; the ultrasound gauge was placed just distal to the pulmonary valves im- mediately before the first experiment.
After positioning all catheters the thorax was opened by a left lateral incision in dogs nos. 3 through 6 and a cuff-type electromagnetic flowmeter (Statham microflow Kzooo, with element TTQ-2160) with an internal diameter of 16 mm was placed around the main stem of the pulmonary artery.
The data recorded included ( I ) aortic pressure
(PAo); (2) pressure through the side arm of the
introducer - in most cases pulmonary artery pressure (PAP), rarely right ventricular pressure
(PRV); (3) flow velocity (v) in the pulmonary artery, by ultrasound; (4) first derivative of velocity with respect to time (dv/dt); ( 5 ) ECG; (6) dye dilution curves, at least one curve between two recordings of flow velocity during each step of the experimental procedure.
374 Fricke, Studer, and Scheu
T A B L E I Collected values of six experiments*
Expt. no. and Weight Pharmacol. Rhythm Heart Area Stroke Maximum Maximum
symbol influence rate USS 001. dye Velocity acceleration
Vmnx dvldtmax (kg) (min-') (mm') ( m / . / r o k g ) (cmlsec) (g) - - I 37'0
-
ss
150 425 6.0 35 PS 73 1,024 14'5 I20 Isuprel SS 167 717 10.5 93 lsuprel PS 91 1,071 15'8 125-
0 - - Isuprel SR 104 1,240 17.1 130 - ~ _ _ _ _ _ _ 2 32.5-
SR 109 1,355 10.1 63 0.9 0 Macrodex SR 104 1,605 12'4 77 I '2 Inderal SR 90 2,030 17.0 78 I '0 lsuprel SR 166 1,506 13.6 84 I '9 Inderal SS I I I 1,117 8.9 59 0.9 Inderal SS 151 594 5'4 35 0.6 3 39'5 - SR 60 1,356 14.9 I34 2'2 A Isuprel SR 241 896 11.3 130 3'7 SR 139 1,033 12.1 104 I 4 Inderal SR 125 989 11.8 86 1-5 - --
4 43'0 - SR 148 970 5'3 124 a Macrodex SR 165 974 5.8 124 Inderal PS 99 1,697" 5.5 132 Inderal SR 1 1 5 1,090" 4.2 68-
-
Inderal SR 121 1,330" 4.6 87 Inderal PS 103 1,460" 5.6 1 I8-
- 5 32'5-
SR 180 680 5.0 107 2.7 A Macrodex SR 164 673 5.7 83 2'1 lnderal SR 137 440 3.6 53 I '4 Inderal SR 135 338 3'0 56 1'1 6 53'0 - SR 165 900 4 2 I 0 0 1 *5-
SR 171 964 4'7 I77 2'2Experiments I through 3 were closed chest animals, where pulmonary artery diameter was determined on
cineangiograms. Experiments 4 through 6 were animals with open chests, where pulmonary artery diameter was fixed by a cuff type electromagnetic gauge around the main stem of the pulmonary artery.
Symbols are the same as in Fig. 4.
0 Values recorded after accidental change in sensitivity during one experiment.
Dye dilution curves were recorded by continu- ous withdrawal of blood from the aorta through a densitometer (Waters type zooA) after injec- tion of I or z ml. Cardio Green solution into the right ventricle. The Cardio Green solution was prepared by dissolving the dye in equalamounts of solvent and blood to a concentration of 25 mg/zo ml. For calibration, 10, 20, and 30 PI. of the Cardio Green solution were added to 10 ml. blood
and withdrawn through the densitometer. At the end of each experiment cineangio- graphy of the pulmonary artery was performed by injecting during diastole 5-7 ml. Isopaque into the right ventricle. Angiography was done in two planes at approximately right angles in an effort to get one parallel and one perpendicular projection of the gauge (Fig. 3).
In each experiment cardiac output or stroke volume was varied by rapid infusion of dextran, infusion of isoprenaline, or injection of p-blocking agents (Inderal). In some experiments, single and paired ventricular stimulation were also used.
The different experimental procedures are listed in Table I.
Results
I In vivo testing of linearity
Since the ultrasound flow gauge measures the axial component of velocity i n the vicinity
of the gauge, in vivo testing of linearity was necessary. Experiments in vitro had shown that neither strictly central nor strictly axial positioning of the gauge was of critical im- portance (Studer, 1970). It was, however, necessary to ascertain whether measured velocity in the vicinity of the gauge was re-
presentative of cross-sectional flow velocity.
For this purpose, the mean stroke volume for each experiment was calculated from the dye dilution curves and heart rate. By planimetry of five ultrasound signals each before and after each determination of a dye
375 Pulsatile velocity of blood in the pulmonary artery of dogs
t
/
,/’ A
F I G . 4 Relative changes of stroke volumes as determined by dye dilution compared with relative changes of area under the velocity curve (see text). The correlation is remarkably strict.
dilution curve the mean area under the velocity signal for each experiment was dso calculated. This area of course corresponds to the stroke volume if the measured velocity is representative of cross-sectional velocity and if changes of diameter during systole can be regarded as negligible (Luchsinger, Sachs, and Patel, 1962). The relative value of stroke volume and the area under the signal during each step of the experiment in comparison with the mean stroke volume and area re- spectively were then plotted on a graph. Only relative changes were used for both para- meters to reduce errors due to additional inconsistency in calibration (Fig. 4).
Correlation of relative changes during the experiments was found to be highly signifi- cant, r = 0.98. This strict correlation proves that recorded signals of velocity of flow are representative of stroke volume. Therefore, the velocity across the proximal pulmonary artery seems to be uniform and the position- ing of the gauge, which cannot be controlled exactly, is apparently not critical. Compari- son of electromagnetic flow pulses and ultra- sound signals also showed no appreciable difference. The detailed results will be pre- sented elsewhere.
F I G . 5
and heart rate ( H R ) were chosen as conventional parameters. Positive and negative inotropic influences are more clearly demonstrated by maximum velocity (omax) and especially maximum acceleration (dvldt,,,).
Haemodynamic parameters in a typical experiment. Stroke volume index
(SVZ)
4 1
376 Fricke, Studer, and Scheu
2 The velocity of blood in the pulmonary artery
As discussed above,
we
did not calibrate our gauge in cmlsec. From the values of stroke volume and the diameter of the pulmonary artery, as determined by cineangiography, the velocity can be calculated indirectly. Stroke volumes may be taken from the dye dilution curves in any experimental stage or from the area under the velocity signal if the flow signal is calibrated by a dye dilu- tion curve at any time in the experimental procedure. The calibration factor E corre- sponds to flow velocity in cm/sec/mm length of ordinate on the graph of the ultrasound signal.sv
* v,E =
SV
= stroke volume calculated from dye dilution curves and heart rate. d=diameter of the pulmonary artery incm, determined by angiography. v, = paper-speed in mmlsec.
Fuss = area under the velocity signal (mean
In
the dog the determination of the dia- meter of the pulmonary artery is the critical parameter in the calculation of velocity. The gauge, with its known length and width is lying within the organ to be measured and can therefore be used as a measure without problems of projection. In spite of this, be.- cause of blurred pictures and the unnoticed oblique position of the gauge with respect to the film, the diameter varied by k I mm when several cineangiographic pictures were ana- lysed for each dogon
a projection-screen. The error of determination of diameter accordingly was about k 5% and leads to an estimated error of the calculated velocity of approximately 10%. In experiments 3through 6, the diameter was fixed by the cuff of the electromagnetic flowmeter, so that the inner diameter of the pulmonary artery was always I S mm.
Calculated velocities are listed in Table I. The higher velocities in experiments 3 through 6 are due to the constriction of the pulmonary artery by the electromagnetic flowmeter. As can be seen from the values in Table I and more clearly from Fig. 5, where the main measured haemodynamic values of one experiment are plotted, maximum velocity and stroke volumes do not change proportionally. Velocity increases more than stroke volumes under positive inotropic influences such as infusion of Isuprel. The
of I
o
signals).negative influence of @blocking agents is even more apparent through reduction of maximum velocity. Figure 4 shows clearly that with propranolol during ventricular pacing, velocity as well as acceleration de- cline sharply in spite of large stroke volumes. Maximal velocities during control condi- ditions varied greatly with volaemia and depth of anaesthesia (35 to 135 cm/sec). The highest velocities, 84-1 30 cmlsec, were re- corded after volume loading and especially during infusion of isoprenaline. Beta block- ade reduced maximum velocity by approxi- mately half of the initial value.
3 Acceleration of blood in the pulmonary artery
Differentiation of velocity with respect to time, using a resistive capacitive circuit with a time constant of 0.5 msec, permits con- tinuous recording of acceleration. Figure 6 shows a typical recording, while Table I
gives the numerical values of all experiments expressed in g’s (g=981 cm/seca). Figure 5
shows clearly that positive inotropic in- fluences increase acceleration more than any other haemodynamic parameter meas- ured in these experiments. The maximum accelerations were observed with isopren- aline, even when stroke volume decreased because of high heart rates and even when maximum velocity increased but slightly or remained constant, as in experiment 3 (Table I).
Discussion
Several techniques permit measurements of velocity of flow of blood within the large vessels. One drawback common to all intra- vascular gauges is the fact that they measure velocity in the vicinity of the gauge only. An approximately uniform velocity throughout the cross-section of the vessels is therefore required.
Our ultrasound gauge was first tested extensively in vitro (Studer, 1970) and proved to measure velocities with satisfactory linearity. The results presented here show that the recorded velocities in the pulmonary artery of dogs are representative of the cross- sectional velocity of flow, since stroke volumes (determined by dye dilution) and area under the velocity curve are strictly correlated over a wide range. We have previously (Scheu, Sager, and Veragut, 1965) observed strict linearity between the signals of an electromagnetic cuff-type flowmeter around the aorta and signals from an older type ultrasound gauge. The new model of
377 Pulsatile velocity of blood in the pulmonary artery of dogs
F I G . 6 Typical recordings during an experiment. The curves from top to bottom in each
run represent: velocity (v), aortic pressure
(PAo),
acceleration (dvldt), right ventricular pressure(PRv),
and the ECG. Recordings were taken during the control state, during infusion of isuprel, afrer &blockade, and finally after p-blockade during ventricular pacing.378 Fricke, Studer, and Scheu
F I G . 7
velocity recording by an electromagnetic powmeter and ultrasound gauge in the pulmonary artery. Open chest preparation.
Above: (propranolol) sinus rhythm. Below: paired ventricular stimulation. The recordings show the absolutely parallel changes of the signals. (The noise in the electromagnetic signal below is due to the interference of the stimulator.)
Comparison of simultaneous flow
the gauge also was tested against an electro- magnetic flowmeter of the cuff type (Medicon K 2000) that was fitted around the pul-
monary artery of open-chest dogs. Figure 7 shows a typical recording during sinus rhythm and during paired ventricular stimu- lation shortly afterwards. The strict simi- larity of the two curves is demonstrable. In a similar way, Mills and Shillingford (1967) have shown that their electromagnetic, intravascular flowmeter records representa- tive velocities. Criticism can be directed against these experiments, because turbu- lence could have been produced by the con- striction of the artery through the cuff-type flowmeter.
The ultrasound gauge offers several ad- vantages. It is mechanically and electronic- ally simple; its signals cannot be influenced
by other signals emanating in the vicinity of the measuring gauge, such as quadrature currents, ECG pick up, as happens with electromagnetic devices (Bond and Bare- foot, 1967; Mills and Shillingford, 1967). Moreover, the output of the ultrasound gauge is as much as IomV, whereas that of the electromagnetic devices is at most 10 pV.
The technically very simple Doppler gauge (Stone, Stegall, Bishop, and Laenger, 1967) has the disadvantage of not being direc- tionally sensitive and, besides, judging from published results, the gauge seems responsive to reflection from vessel walls and also re- cords their movements. Finally Grahn, Paul, and Wessel (1968) have recently devised an ingenious thermistor gauge that has the great advantage of being very small. The techniques to make such a gauge direction- ally sensitive are complicated and amplifica- tion has to be logarithmic because dissipa- tion of heat is a logarithmic function of velocity of flow. Published curves show addi- tional artefacts during stasis in diastole, when dissipation of heat is by conduction alone. The method of measuring velocity of flow according to the law of Navier-Stokes has been greatly improved by Pieper (1963). It is still an elusive method, because both pres- sures along the stream axis must be recorded in true and identical frequency and phase.
The main disadvantages of the ultra- sound gauge in its present form is the absence of a stable zero over a sufficient range of temperature and time. No electronic zero can be introduced during measurements, and recordings are feasible only in those vessels that have a biological zero flow, such as the pulmonary artery or the aorta. An approxi- mate zero flow can be introduced by with- drawing the ultrasound gauge briefly into the catheter used for the introduction. Another disadvantage is that the gauge cannot yet be calibrated in units of velocity per unit of output.
The velocities in the pulmonary artery as recorded with the ultrasound flow velocity gauge varied greatly; this is indicated also in the few published recordings of other authors (Pieper, 1963 ; Mills and Shillingford, 1967). Our values are within the range of those pub- lished-namely, 40 to 140 cmlsec in the non-constricted pulmonary artery. The bio- logical significance of these velocities is not well understood; it will be necessary to corre- late the recorded velocities with other haemo- dynamic parameters before their diagnostic importance can be ascertained.
Differentiation of velocity with respect to time yields acceleration. Our ultrasound
379 Pulsatile velocity of blood in the pulmonary artery of dogs
experiments. vascular Research, 4, 380-387.
gauge has a sampling frequency of more than
5,000 Hz. Because of some noise in the apparatus and because of deformation of the velocity pulse by movements of the catheter within the pulmonary artery we had to damp the signal with a 25 c/s low pass before differentiation. The recorded values for acceleration may therefore be slightly too low. A comparison of our findings with those in the literature is not very revealing. Noble, Trenchard, and Guz (1966) measured acceler- ation of the constricted ascending aorta. Our values are lower by 60 to 80% but one must remember that constriction increases ve- locity and therefore acceleration, and veloci- ties in the pulmonary artery can be expected to be lower than in the aorta because the right ventricular cycle begins earlier and displays a lower dp/dt. The acceleration of blood in the pulmonary artery of the anaes- thetized dog appeared to vary between I and
a.
Summary
A new ultrasound gauge for the intravascular measurement of velocity of flow records in a linear fashion a representative sample of velocity in the cross-section of the vessel. The velocities in the pulmonary artery vary between 35 and 135 cm/sec according to the state of the animal. They increase with in- creases in stroke volume and especially with positive inotropic influences, such as that of isoprenaline, and decline sharply with /3- blocking agents. The acceleration in the pulmonary artery varies between approxi- mately I and 2 g and reveals positive or
negative inotropic influences much more clearly than does the velocity or any other haemodynamic parameter recorded in these
We are greatly indebted t o Mr. R. Danieli f o r his invaluable help i n producing the flow velocity gauge. We also gratefully acknowledge the help of Steatit-Magnesia (Lauf a.d. Pegnitz) who kindly let us have samples of their miniaturized sound transducers.
References
Bond, R. F., and Barefoot, C. A. (~967). Evaluation of an electromagnetic catheter tip velocity-sensitive blood flow probe. Journal of Applied Physiology, Grahn, A. R., Paul, M. H., and Wessel, H. U. (1968).
Design and evaluation of a new linear thermistor velocity probe. Journal of Applied Physiology,
14, 236-246.
Luchsinger, P. C., Sachs, M., and Patel, D. J. (1962). Pressure-radius relationship in large blood vessels of man. Circulation Research, 11, 885-888.
Mills, C. J., and Shillingford. J. P. (1967). A catheter tip electromagnetic velocity probe and its evalua- tion. Cardiovascular Research, I, 263-273.
Noble, M. 1. M., Trenchard, D., and Guz, A. (1966).
Left ventricular ejection in conscious dogs: 1.
Measurement and significance of the maximum acceleration of blood from the left ventricle.
Circulation Research, 19, I 39-152.
Pieper, H. P. (1963). Catheter-tip blood flowmeter for measurement of pulmonary arterial blood flow in closed-chest dogs. Review of Scientific Instru- ments, 34. 908-910.
Plass, K. G. (1964). A new ultrasonic flowmeter for intravascular application. IEEE Transactions on
Bio-Medical Engineering, BME-11, I 54-1 56.
Scheu, H., Sager, O., and Veragut, U. (1965). Eine neue Methode zur intravasalen Messung von
Stromungsgeschwindigkeiten: Die Ultraschall- sonde. Klinische Wochenschrft, 43,608-61 I.
Stone, H. L., Stegall, H. F., Bishop, V. S., and Laenger, C. (1967). Continuous measurement of
blood flow velocity with an intravascular doppler flowmeter. P. z x 5. 7th International Conference on Medical and Biological Engineering. Almqvist
and Wiksell: Stockholm.
Studer, U., Fricke, G., and Scheu, H. (1970). Testing
of an improved ultrasound flowmeter. Curdio-