HAL Id: hal-01481770
https://hal.archives-ouvertes.fr/hal-01481770
Submitted on 2 Mar 2017
HAL is a multi-disciplinary open access
archive for the deposit and dissemination of
sci-entific research documents, whether they are
pub-lished or not. The documents may come from
teaching and research institutions in France or
abroad, or from public or private research centers.
L’archive ouverte pluridisciplinaire HAL, est
destinée au dépôt et à la diffusion de documents
scientifiques de niveau recherche, publiés ou non,
émanant des établissements d’enseignement et de
recherche français ou étrangers, des laboratoires
publics ou privés.
Repeated cures with paracetamol worsen sarcopenia in
old rats with suboptimal food intake.
Carole Mast, Isabelle Savary-Auzeloux, Didier Remond, Corinne Pouyet,
Delphine Centeno, Guillaume Voyard, Lydie Combaret, Dominique Dardevet,
Isabelle Papet
To cite this version:
Carole Mast, Isabelle Savary-Auzeloux, Didier Remond, Corinne Pouyet, Delphine Centeno, et al..
Repeated cures with paracetamol worsen sarcopenia in old rats with suboptimal food intake.. Journal
of Physiology and Pharmacology, Krakow Polish Physiological Society, 2016, 67 (5), pp.759-768.
�hal-01481770�
INTRODUCTION
Sarcopenia is the progressive loss of muscle mass and strength associated with ageing (1). It is a multifactorial event affected by intrinsic (e.g. age, hormonal change) and extrinsic (e.g. disease, nutrition) factors (2). When advanced, muscle loss is linked to morbidity and increased mortality (3) and sarcopenia is a major component of frailty (4). Sarcopenia results from an imbalance between muscle protein synthesis and proteolysis which could be in part explained by a lowered sensitivity of protein metabolism to stimuli associated with food intake. We recently reviewed that muscle develops a resistance to the anabolic effect of amino acids (5). Consequently, the aminoacidemia required to elicit the postprandial protein anabolism in muscle is higher in older than young adults. Thus, ensuring adequate availability of amino acids for muscle in elderly is of utmost importance. Preliminary estimates underlined that (i) treatment with a standard dose of paracetamol (N-acetyl-para-aminophenol, APAP) would reduce availability of sulfur amino acids (methionine and cysteine (Cys)) at the whole body level, and (ii) APAP-treated older persons with low
dietary protein intake could be deficient in sulfur amino acids (6). This potential APAP-related decrease in the availability of sulfur amino acids stems from APAP detoxification pathways.
APAP detoxification occurs in the liver through phase I and II reactions (7, 8). Briefly, up to 90% of APAP is directly conjugated with glucuronide or sulfate (sulfation pathway). In phase I, APAP is converted by cytochrome P450 into a highly reactive compound N-acetyl-p-benzoquinone imine (NAPQI). NAPQI formation dramatically increases when the sulfation pathway is saturated. NAPQI is neutralized by glutathione, and then metabolized through the mercapturate pathway. The end-products of APAP detoxification processes are excreted along with urine and constitute a net loss of Cys, since this amino acid is the precursor of both sulfate and glutathione (9). Cys is provided by dietary proteins, degradation of glutathione and proteins, and endogenous synthesis in the liver from methionine, which is the indispensable sulfur amino acid (9). Cys becomes indispensable when its endogenous synthesis is not sufficient to cover all metabolic needs (10).
We recently reported that loss in muscle mass and decreased plasma Cys concentration and glutathione content in liver and JOURNAL OF PHYSIOLOGY AND PHARMACOLOGY 2016, 67, 5, 759-768
www.jpp.krakow.pl
C. MAST1,2, I. SAVARY-AUZELOUX1,2, D. REMOND1,2, C. POUYET3, D. CENTENO3,
G. VOYARD4, L. COMBARET1,2, D. DARDEVET1,2, I. PAPET1,2
REPEATED CURES WITH PARACETAMOL WORSEN SARCOPENIA
IN OLD RATS WITH SUBOPTIMAL FOOD INTAKE
1University of Clermont, University of Auvergne, Human Nutrition Unit, Clermont-Ferrand, France; 2INRA, UMR 1019, UNH, CRNH Auvergne, Clermont-Ferrand, France; 3Metabolism Exploration Platform, INRA,
Auvergne-Rhone-Alpes Center, UMR 1019 Human Nutrition, Saint-Genes-Champanelle, France; 4University of Clermont,
Blaise Pascal University, Department of Chemistry of Clermont-Ferrand, Photochemistry Team, Clermont-Ferrand, France
The availability of all amino acids is of prime importance to prevent the ageing-associated decrease in skeletal muscle mass i.e. sarcopenia. Cysteine is the precursor of sulfate and glutathione that are both utilized in the liver to detoxify paracetamol (APAP). Cysteine availability could become limiting under repeated cures with APAP, especially when food intake is suboptimal. The aim of the study was to determine whether repeated cures with APAP could worsen sarcopenia. Twenty-two-month-old male Wistar rats received 3 two-week-long cures of APAP (1% of the diet) intercalated with washout periods of two weeks (APAP group). They were compared to untreated control rats euthanatized prior to the experiment (CT group) and rats pair-fed to the APAP group (PF group). Skeletal muscle mass and protein metabolism, as well as plasma amino acids and glutathione were assessed at the end of the third cure. APAP cures reduced food intake by 33, 23 and 33 % during the successive cures leading to an overall body weight loss of 8%. APAP rats lost lean mass during the experiment (–11%). This loss tended (P = 0.09) to be higher than in the PF group (–9%). The mass of hind limb muscles and the absolute synthesis rate of muscle proteins were 13 and 17% lower in the APAP group than the PF group, respectively. Plasma free cyst(e)ine (i.e. all free forms of cysteine not bound to proteins) and glutathione were 25% lower in the APAP group than the PF group. Repeated cures with APAP worsened sarcopenia in old rats with suboptimal food intake likely as a consequence of the APAP-induced shortage in cysteine/glutathione. Clinical studies are needed to clarify the effect of repeated treatments with paracetamol on skeletal muscle mass in older persons having suboptimal or insufficient dietary intakes.
muscle (that evidenced a reduction in Cys availability) occurred concomitantly, in adult rats under chronic treatment with APAP, compared to untreated rats (11). A deleterious effect of APAP treatment has also been observed in young adults: APAP abolished the increase in the fractional rate of protein synthesis that is typically induced in muscle by a bout of high intensity eccentric exercise (12). Surprisingly, results published so far in old rats and older persons were rather in favor of a beneficial effect of APAP on muscle. In rats, chronic treatment with a low dose of APAP limited ageing-associated alterations in the relative amounts of myosin and actin, intracellular ROS and Akt/mTOR signaling, which are thought to be important regarding sarcopenia (13). According to the authors, these results ‘lead to further credence of the possibility that chronic acetaminophen ingestion may be useful for the treatment of age related muscle atrophy’. However, none of the three papers related to that study reported muscle masses of old rats (13-15). In elderly men subjected to a resistance exercise program (3 to 5 times a week, 16 weeks), chronic administration of APAP (1 g, 2 hours before each training session) did not change fat free mass and muscle strength but increased to a greater extent the knee flexion strength compared to a placebo group (16). Another clinical study reported that chronic administration of APAP (4 g.d–1) potentiated the exercise
(bilateral knee extension, 3 times a week, 12 weeks)-induced gain in the volume of the exercised quadriceps femoris, with no effect on unexercised hamstring muscles (17). Food intake was not systematically recorded in these studies although of prime importance for muscle homeostasis/gain (18). We recently reported a dose and time-dependent negative effect of APAP on food intake in adult rats (11), and a positive effect of APAP on protein intake in older persons (19). Thus, a tight control of food intake is indispensable when investigating the specific effect of APAP on muscle.
APAP is the first-line treatment for persistent and chronic episodes of pain in older persons (20, 21), a population at high risk of APAP-induced sulfur amino acid deficiency (6). We raised the hypothesis that the metabolic impact of APAP detoxification on sulfur amino acid homeostasis could worsen sarcopenia, particularly when food intake is suboptimal. The aim of our study was to determine whether repeated cures with APAP within the range of therapeutic doses worsen sarcopenia in old rats, focusing on muscle protein metabolism, Cys availability to muscle and sulfur amino acid related metabolism. To dissect out the effects of APAP, rats submitted to cures were compared to a control group at baseline and a group of rats pair-fed to APAP-treated rats to avoid any bias derived from food intake differences.
MATERIALS AND METHODS
Animals and experimental design
This study was performed in accordance with the Directive 010/63/EU of the European Parliament and the Council on the Protection of Animals used for Scientific and received the approval (CE 02-12) of the local Ethical Committee, CEMEAA (Comite d’Ethique en Matiere d’Experimentation Animale Auvergne). The experimental protocol conformed to the 3R (replacement, reduction, refinement) ethical rule.
Twenty-month-old male Wistar rats (Janvier Labs, Saint Berthevin, France), were acclimatized 8 weeks in individual cages (type E, 45 × 30 × 20 cm (Charles River, Lyon, France)) under standard conditions (22 ± 1°C, 12 h light/dark cycle) and had free access to water and food (A04 from SAFE (Scientific Animal Food and Engineering), Villemoisson-sur-orge, France). They were adapted to the experimental control diet (Table 1)
then divided into three groups matched on body weight, food intake and lean mass. Ten control rats (CT, 734 ± 26 g) were euthanized before the experiment to get basal data. Eleven rats (APAP, 711 ± 30 g) were submitted to 3 cures (C1, C2 and C3) of 2 weeks of APAP treatment (APAP diet, Table 1), spaced by 2 inter-cure (IC) of 2 weeks without APAP (IC1 and IC2). Eleven rats (PF, 722 ± 33 g) were fed the control diet adjusted on the same daily APAP rats’ food intake. During IC, food intakes of APAP and PF rats were also matched to avoid any difference between the two groups throughout the whole experiment. Body weight and food consumption were recorded daily. Lean mass was assessed using magnetic resonance imaging (Echo MRI international, Houston, TX, USA) at the beginning and the end of each APAP cure. All rats were euthanized at the beginning of the light period under pentobarbital anesthesia (50 mg.kg–1, IP)
by aortic blood withdrawal. Food was removed few hours before the anesthesia. Blood was centrifuged at 2000 × g for 15 min at 4°C and plasma was immediately frozen in liquid nitrogen. Liver and small intestine (SI) were immediately removed, washed with saline and weighed. Skeletal muscles (gastrocnemius (GM), tibialis anterior (TA), soleus (SOL) and extensor digitorum longus (EDL)) were carefully dissected from the left posterior leg and weighed. Immediately after being weighed GM, liver, and SI were frozen in liquid nitrogen, and then stored at –80°C until analyses.
Paracetamol (APAP) administration
Powder of APAP was mixed to the ingredients during the diet preparation. The level of 1% (w/w) was chosen as an equivalent dose of human 4 g.d–1, as previously described (11).
Based on the expected food intake the daily dose will be in the range of the typical antinociceptive doses (200 – 300 mg.kg–1)
for rats (22). The cure model was chosen to reproduce treatment of chronic pain in human defined as daily pain lasting for at least 3 months (21) and the alternation of painful and remission periods in patients. The length of 2 weeks for cures and inter-cures took into account the difference between rat and human life expectancies.
Plasma measurements
Plasma amino acids were purified, i.e. 500 µL of plasma was added to 125 µL of sulfosalicylic acid solution (1 mol.L–1in
ethanol with 0.5 mol.L–1 thiodiglycol) previously completely
evaporated. Norleucine (100 µL) was added as an internal standard. Amino acid concentrations were determined using an
Ingredients Control diet APAP diet
Fish meal 211 211
Starch 575.5 565.5
Sucrose 100 100
Sunflower oil 31 31
Cellulose 50 50
Mineral Mixture AIN 93 20 20
Vitamin Mixture AIN 93 10 10
Choline bitartrate 2.5 2.5
APAP – 10
The composition of the diet was 16% proteins, 68% carbohydrates, 6% fat, 5% fibers and 5% others. APAP, paracetamol.
Table 1. Composition of the experimental diets (g.kg–1 dry
automated amino acid analyzer with BTC 2410 resin (Biotronic LC 3000, Roucaire, Velizy, France). Amino acid concentrations were expressed in µmol.L–1.
Plasma total aminothiols (all free forms plus forms bound to proteins through disulfide bridges for Cys, homocysteine (Hcy), cysteinyl-glycine (Cys-gly) and glutathione) were quantified by reversed-phase HPLC conditions and fluorescence detection (23). Briefly, aminothiols were reduced via incubation with tris-(2-carboxyethyl)-phosphine hydrochloride, followed by protein precipitation with trichloroacetic acid and derivatization with ammonium-7-fluorobenzo-2-oxa-1,3-diazole-4-sulfonic acid. An Alliance HPLC system (Waters, Guyancourt, France) was equipped with a hypersil gold column (4.6 × 150 mm, 3 µm, Thermo Scientific, Illkirch, France). The two mobile phases consisted of A: 0.1 M acetate buffer (pH 4.5) - methanol 97:3 (v/v) and B: buffer A - methanol 78:22 (v/v). Aminothiols were separated over 2 min with 100% A at a flow rate of 1 ml.min–1,
followed by 100% B (changed linearly over 1 min) at a flow rate of 1.0 ml.min–1for 7 min, and 5 min of column re-equilibration
for a total run time of 16 min. Free aminothiols (i.e. reduced forms plus homo- and hetero-disulfide forms not bound to proteins) were quantified in plasma samples after removal of proteins, followed by reduction of disulfide bounds using the same analytical method. Plasma aminothiols bound to proteins through disulfide bridges were calculated as differences between total and free concentrations. Aminothiol concentrations were expressed in µmol.L–1.
Hepatotoxicity was assessed by measurement of plasma aspartate transaminase (AST) and alanine transaminase (ALT) levels by photometric method using an automated analyzer (ABX Pentra 400, Horiba, Montpellier, France) and test kits A11A01629 and A11A01627 (Horiba), respectively. Data were expressed in IU.L–1.
Tissue measurements
The whole SI, GM and livers were finely pulverized in liquid nitrogen using a ball mill (Dangoumeau, Prolabo, Paris, France). GM was chosen for analyses because it contains a large proportion of type II fibers (24), and type II fiber atrophy is an early contributor to sarcopenia (25). Moreover its large size makes it the most representative of the whole muscle metabolism and allows multiple assays once milled.
Frozen powdered tissues were homogenized in a solution containing 0.2 mol.L–1perchloric acid and 5 mmol.L–1EDTA
then centrifuged for 20 min at 8000 × g. Reduced glutathione (GSH, the major form) plus glutathione homodisulfide (GSSG) were quantified with an automated analyzer (ABX Pentra 400, Horiba, Montpellier, France) using a standard enzymatic recycling procedure and 5,5’-dithio-bis-2-nitrobenzoic acid (Ellman reagent) as oxidant (26). GSH plus GSSG was expressed as µmol of reduced GSH per organ or muscle.
Total protein content was quantified after digestion of powdered tissue in 8 vol of 0.3N NaOH at 37°C during 2 hours using a Bicinchoninic acid (BCA) assay reagent kit, as previously described (27). Bovine serum albumin was used as standard. Protein concentration was expressed as mg.g-1and total
protein content as g or mg per organ.
Protein synthesis rates were measured in liver and muscle using the flooding dose method as previously described (28). Briefly, each rat received an intravenous injection of [1-13C]
valine (Cambridge Isotope Laboratories) (80%, 150 µmoles/100 g body weight) 25 min before euthanasia to flood the precursor pool with [1-13C] valine. Free and protein-bound
valine enrichments were determined as previously described (29). Absolute synthesis rate (ASR) was calculated as the product of protein fractional synthesis rate (FSR) and total
protein content of the tissue and expressed in mg.d–1or g.d–1.
FSR (in %.d–1) was calculated from the formula:
FSR = 100 × (Eb – En)/(Ea (t1/2) × t),
where t is the time interval between the end of the bolus injection and the killing of rats (incorporation period expressed in day); En is the natural enrichment of protein-bound valine, measured on rats not submitted to [1-13C] valine injection; Eb is
the enrichment of protein-bound valine at the end of the incorporation period; and Ea (t1/2) is the 13C enrichment of free
valine calculated at a time half-way between injection and killing, to take into account the small decline in Ea during measurement. In plasma, an initial Ea (0) level was assumed to be 80% and Ea (t) was measured. The change in tissue Ea was assumed equivalent to plasma Ea change. Tissue Ea (t1/2) was
then calculated by adding half of the difference between final and initial plasma Ea to the final tissue Ea.
The proteolytic activities of the ubiquitin-proteasome dependent proteolysis (UPS) were measured in muscle as previously described (24) with some modifications. Samples of powdered GM were homogenized in 10 vol of an ice-cold buffer A (pH 7.5, 50 mmol.L-–1 Tris-Cl, 250 mmol.L–1 sucrose, 10
mmol.L–1 ATP, 5 mmol.L–1 MgCl
2, 1 mmol.L–1 DTT and 0.2
mmol.L–1PMSF). Proteasomes were isolated by three sequential
centrifugations (30). Homogenates were centrifuged at 10,000 × g for 20 min at 4°C. Supernatants were then centrifuged at 150,000 × g for 30 min at 4°C. The resulting supernatants were finally centrifuged at 150,000 × g for 2 h 30 min at 4°C. The resulting protein pellets were resuspended in 150 µL of a 20% glycerol buffer (pH 7.5, 50 mmol.L–1 Tris-Cl and 5 mmol.L–1 MgCl
2,
(buffer B)). Protein concentration was determined on these resuspended pellets using the Bio-Rad protein assay kit. The proteasome chymotrypsin- and trypsin-like activities were determined by measuring the hydrolysis of the fluorogenic substrates succinyl-Leu-Leu-Val-Tyr-7-amido-4-methylcoumarin (LLVY-AMC) (Enzo Life Sciences), and succinyl-Leu-Arg-Arg-AMC (LRR-succinyl-Leu-Arg-Arg-AMC) (Pep Institute), respectively. Six microliters (~15 µg proteins) of the resuspended pellets from GM were diluted in 9 µL of buffer B and added to 60 µL of a reaction buffer (pH 7.5, 50 mmol.L–1Tris-Cl, 12.5 mmol.L–1MgCl
2, 1.5 mmol.L–1
DTT, and 0.012 U apyrase) containing either 300 µM LLVY-AMC or 800 µM LRR-LLVY-AMC. Experiments were realized with and without the MG132 inhibitor (Enzo Life Sciences) of the chymotrypsin-like (40 µmol.L–1) and the trypsin-like (100
µmol.L–1) activities of the proteasome. Activities were determined
by measuring the accumulation of the fluorogenic cleavage product (AMC) using a luminescence spectrometer (FLX800, Biotek, Winooski, VT, USA) for 60 min at 380 nm excitation wavelength and 440 nm emission wavelength. Then, the activities were determined by calculating the difference between arbitrary fluorescence units recorded with or without MG132 in the reaction medium. The time course for the accumulation of AMC after hydrolysis of the substrate was analyzed by linear regression to calculate activities, i.e., the slopes of best fit of accumulation AMC versus time. The final data were corrected by the amount of protein. Chymotrypsin- and trypsin-like activities were expressed in relative fluorescent unit (RFU).µg–1.min–1.
Statistical analysis
Results are expressed as means ± S.E.M. Body weight and lean mass from the APAP and PF groups were analyzed using analysis of variance (ANOVA) for repeated measures with time as the within-rat factor and group as the second variable, followed by Ryan, Einot, Gabriel, Welch q (REGWQ) test when significant differences were detected with the ANOVA. Other results were analyzed using Student’s t test for unpaired data. Significance was set at P≤0.05 and trend at P≤0.10. Analyses 761
were performed using XLSTAT for Windows, version 2013.1.01 software (Addinsoft, SARL, USA).
RESULTS
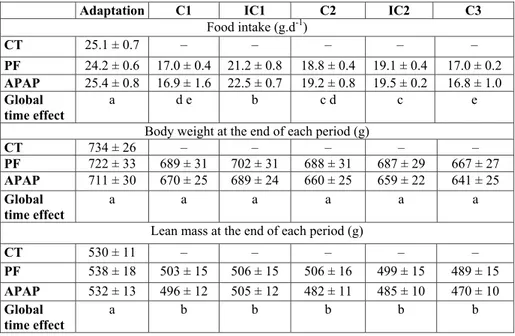
Kinetics of daily food intake, body weight and lean mass There was no significant difference in food ingested during the adaption period, basal body weight and lean mass among the 3 groups (Table 2).
In the APAP group, food intake was 34, 24 and 34% lower during the C1, C2 and C3 periods than the adaptation period, respectively (Table 2). The daily APAP consumption in the course of cures was about 260 mg.kg–1.d–1. There was no
significant difference in the food intake between the APAP and PF groups throughout the whole experiment (no group effect and no interaction between group and time, ANOVA for repeated measures).
Body weight decreased with time, similarly in the APAP and PF groups (time effect P < 0.001, no group effect, no interaction between group and time, ANOVA for repeated measures) (Table 2). There was no significant difference in the overall loss of body weight between the APAP (–9.1 ± 3.0%) and PF (–7.4 ± 0.8%) groups. Lean mass significantly decreased over time and a significant interaction between group and time was observed (ANOVA for repeated measures). The overall loss of lean mass tended (P = 0.09) to be more pronounced in the APAP group (–11.4 ± 1.3%) than the PF group (–9.0 ± 0.5%).
Skeletal muscle, liver and small intestine masses
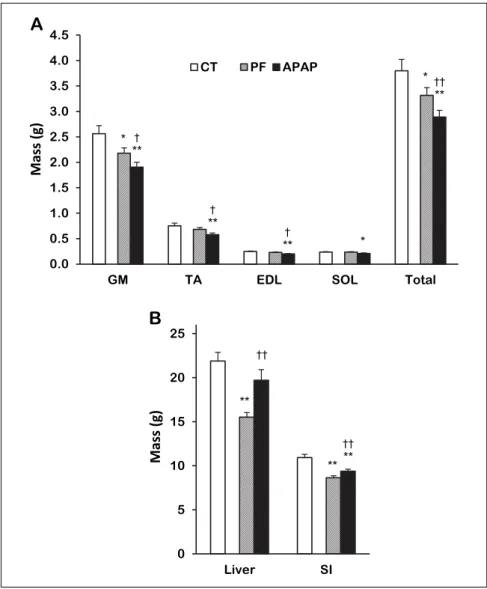
Muscle masses were significantly lower in the APAP group than the CT group: –26, –23 and –19% for GM, TA and EDL, respectively and a similar trend was observed for SOL (–11%, P = 0.08, Fig. 1A). The total mass of these muscles was 24% lower in the APAP group than the CT group. Total muscle mass of APAP-treated rats was also lower than the PF one (–13%). The
Adaptation C1 IC1 C2 IC2 C3
Food intake (g.d-1) CT 25.1 ± 0.7 – – – – – PF 24.2 ± 0.6 17.0 ± 0.4 21.2 ± 0.8 18.8 ± 0.4 19.1 ± 0.4 17.0 ± 0.2 APAP 25.4 ± 0.8 16.9 ± 1.6 22.5 ± 0.7 19.2 ± 0.8 19.5 ± 0.2 16.8 ± 1.0 Global time effect a d e b c d c e
Body weight at the end of each period (g)
CT 734 ± 26 – – – – – PF 722 ± 33 689 ± 31 702 ± 31 688 ± 31 687 ± 29 667 ± 27 APAP 711 ± 30 670 ± 25 689 ± 24 660 ± 25 659 ± 22 641 ± 25 Global time effect a a a a a a
Lean mass at the end of each period (g)
CT 530 ± 11 – – – – – PF 538 ± 18 503 ± 15 506 ± 15 506 ± 16 499 ± 15 489 ± 15 APAP 532 ± 13 496 ± 12 505 ± 12 482 ± 11 485 ± 10 470 ± 10 Global time effect a b b b b b
APAP, paracetamol group; C, Cure; CT, control group; IC, inter-cure; PF, pair-fed group. Values are means ± S.E.M. Adaptation values are not significantly different among the three groups (unpaired Student’s t test). ANOVA for repeated measures with time as the within-rat factor and group (PF and APAP) as the second variable for food intake: Time: P < 0.0001, Group: P = 0.505, Time * Group: P = 0.688; body weight: Time: P < 0.0001, Group: P = 0.596; Time * Group: P = 0.716, and lean mass: Time: P < 0.0001, Group: P = 0.550, Time * Group: P < 0.001. a,b,c,d,e significantly different (P < 0.05) within time points for combined PF and APAP groups (REGWQ test).
Table 2. Food intake, body weight and lean mass over the experimental periods.
3 Gastrocnemius Liver Proteins (mg.g–1) Chymotrypsin-like activity (RFU.µg–1.min–1) Trypsin-like activity (RFU.µg–1.min–1) FSR (%.d–1) Proteins (mg.g–1) FSR (%.d–1) CT 176 ± 3 33.0 ± 3.7 1.80 ± 0.22 6.68 ± 0.59 168 ± 2 51.1 ± 2.7 PF 168 ± 3† 29.5 ± 3.6 1.57 ± 0.13 7.26 ± 0.46 189 ± 3** 51.4 ± 1.3 APAP 158 ± 5**† 32.3 ± 3.6 1.70 ± 0.16 7.58 ± 0.58 163 ± 4†† 57.4 ± 1.2*†† 4
APAP, paracetamol group; CT, control group; PF, pair-fed group; FSR, fractional synthesis rate. Values are means ± S.E.M. * P≤0.10, ** P≤0.05 versus CT, †P≤0.10, ††P≤0.05 APAP versus PF, unpaired Student’s t test.
Table 3. Protein concentrations, fractional synthesis rates, and proteolytic activities of the ubiquitin-proteasome dependent system in control, pair-fed and APAP-treated groups.
mass of GM, on which further measurements were performed, was 12% lower (P = 0.08) in the APAP than the PF group.
There was no significant difference in the liver mass between the APAP and CT groups but it was 27% higher in the APAP group than the PF group (Fig. 1B).
SI mass was 14% lower in the APAP group than the CT group but 9% higher than the PF group (Fig. 1B).
Skeletal muscle and liver protein contents and synthesis rates, and skeletal muscle proteasome activities
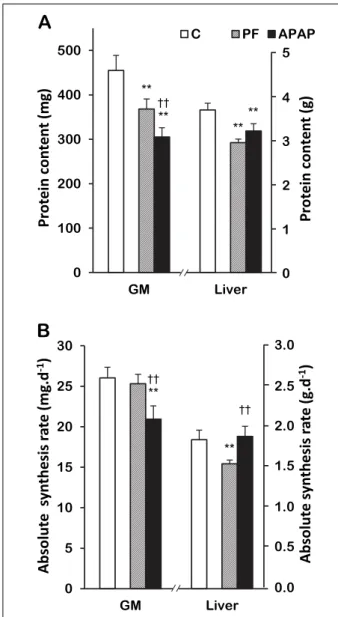
GM protein concentration was 10% lower in the APAP group than the CT group and tended to be lower than the PF group (–6%, P = 0.09) (Table 3). GM protein content was 33% lower in the APAP group than the CT group and 17% lower than the PF group (Fig. 2A). There was no significant difference in chymotrypsin- and the trypsin-like activities and the FSR among the 3 groups (Table 3). However, GM ASR was 20% lower in the APAP group than the CT group and 17% lower than the PF group (Fig. 2B).
There was no significant difference in liver protein concentration between the APAP and CT groups but it was 14% lower in the APAP group than the PF group (Table 3). Liver protein content was 13% lower in the APAP group than the CT group and there was no significant difference between the APAP and PF groups (Fig. 2A). Liver FSR tended to be higher in the APAP group
(12%, P = 0.06) than the CT group and was 12% higher than the PF group (Table 3). There was no significant difference in the liver ASR between the APAP and CT groups (Fig. 2B) but it was 22% higher in the APAP group than the PF group.
Plasma, small intestine, skeletal muscle and liver glutathione Plasma concentrations in total glutathione (all free forms plus protein-bound glutathione) and its free forms were 23 and 26% lower in the APAP group than the CT group and 18 and 25% lower than the PF group, respectively (Fig. 3A). There was no significant difference in the plasma concentration of protein-bound glutathione between the APAP and CT groups. Plasma protein-bound glutathione tended to be higher (44%, P = 0.07) in the APAP group than the PF group.
GSH plus GSSG contents of liver, SI and GM were respectively 68, 22 and 40 % lower in the APAP group than the CT group (Fig. 3B). GSH plus GSSG contents of liver and GM were respectively 49 and 29% lower in the APAP group than the PF group.
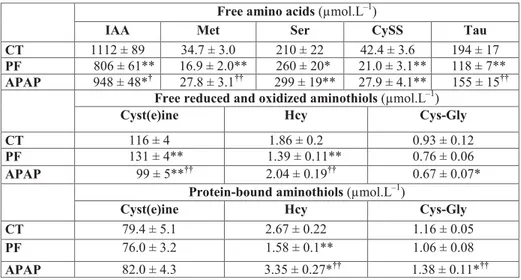
Plasma free amino acid concentrations
Plasma concentration of cystine (CySS) was 34% lower in the APAP group than the CT group and a similar trend was observed for the sum of indispensable amino acids (IAA, -15%, P = 0.10) (Table 3). On the contrary, serine was 42% 763
1
0 5 10 15 20 25 Liver SI M a s s ( g ) 0.0 0.5 1.0 1.5 2.0 2.5 3.0 3.5 4.0 4.5GM TA EDL SOL Total
M a s s ( g ) CT PF APAP ಳ ಳಳ
B
M
a
ss
(
g
)
M
a
ss
(
g
)
ಳ ಳ ಳಳ ಳಳA
Fig. 1. Skeletal muscle and organ masses in control, pair-fed and APAP-treated groups. (A) Skeletal muscles, (B) Organs. Values are means ± S.E.M. APAP, paracetamol group; CT, control group; EDL, extensor digitorum longus; GM, gastrocnemius; PF, pair-fed group; SI, small intestine; SOL, soleus; TA, tibialis anterior. Total is the sum of the 4 muscles, *P≤ 0.10, **P≤ 0.05 versus CT, †P ≤ 0.10, ††P ≤ 0.05 versus PF,
higher in the APAP group than the CT group. Methionine and taurine were respectively 65 and 31% lower and the sum of IAA tended to be higher (18%, P = 0.06) in the APAP group than the PF group.
Plasma free (reduced and oxidized) aminothiol concentrations Plasma concentrations of cyst(e)ine (Cys + CySS + small Cys disulfides) and free Cys-gly were respectively 15 and 28% lower in the APAP group than the CT group (Table 3). Cyst(e)ine was 25% lower and free Hcy 47% higher in the APAP group than the PF group.
Plasma protein-bound aminothiols
Plasma concentrations of protein-bound Hcy and Cys-gly tended to be 26 (P = 0.07) and 20% (P = 0.09) higher in the
APAP group than the CT group, and 112 and 30% higher than the PF group, respectively.
Methionine to cyst(e)ine ratios
Methionine to cyst(e)ine ratios and methionine to total Cys (cyst(e)ine plus protein-bound Cys) ratios were respectively 0.30 ± 0.03 and 0.18 ± 0.02 in the CT group; 0.13 ± 0.01 and 0.08 ± 0.01 in the PF group and 0.30 ± 0.05 and 0.16 ± 0.02 in the APAP group. There was no significant difference between the APAP and CT groups. However, these ratios were 131 and 92% higher in the APAP group than the PF group.
Hepatotoxicity markers
Plasma activities of AST and ALT were not significantly higher in the APAP group (AST: 113 ± 24 IU.L–1, ALT: 80 ± 14
0 5 10 15 20 25 30 GM Liver A S R ( m g /d ) 0 100 200 300 400 500 GM Liver P ro te in s ( m g ) C PF APAP 3.0 0.0 2.0 1.5 1.0 0.5
A
b
so
lu
te
sy
n
th
e
si
s
ra
te
(
g
.d
-1)
2.5 5 0 4 3 2 1P
ro
te
in
co
n
te
n
t
(g
)
A
B
A
b
so
lu
te
sy
n
th
e
si
s
ra
te
(
m
g
.d
-1)
Pr
ot
e
in
con
te
nt
(m
g
)
ಳಳ ಳಳ ಳಳFig. 2. Liver and gastrocnemius protein contents and absolute synthesis rates in control, pair-fed and APAP-treated groups. (A) Protein contents, (B) Absolute synthesis rates. Values are means ± S.E.M. APAP, paracetamol group; CT, control group; GM, gastrocnemius; PF, pair-fed group. **P≤0.05 versus CT, ††P≤
0.05 versus PF, unpaired Student’s t test.
5
0 25 50 75 100 125 150 175 200 Liver SI GM T o ta l G S H c o n te n t ( m o l) 0 5 10 15 20 25 30 35Total Free Protein-bound
P la s m a G S H ( M ) C PF APAP
A
0.0 2.0 1.0 0.5G
S
H
p
lu
s
G
S
S
G
c
o
n
te
n
t
(µ
m
o
l)
2.5 1.5B
P
la
sm
a
g
lu
ta
th
io
n
e
(µ
M
)
G
S
H
p
lu
s
G
S
S
G
c
o
n
te
n
t
(
µ
m
o
l)
ಳಳ ಳಳ ಳ ಳಳ ಳಳFig. 3. Glutathione in control, pair-fed and APAP-treated groups. (A) Plasma concentrations in total, free and protein-bound glutathione. (B) Organ and muscle contents in GSH plus GSSG. Values are means ± S.E.M. APAP, paracetamol group; CT, control group; GM, gastrocnemius; GSH, reduced glutathione; GSSG, glutathione homodisulfide; PF, pair-fed group; SI, small intestine. *P≤0.10, **P≤0.05 versus CT, †P≤0.10, ††P≤0.05
IU.L–1) than the CT group (AST: 153 ± 21 IU.L–1, ALT: 89 ± 11
IU.L–1) or the PF group (AST: 104 ± 18 IU.L–1, ALT: 61 ± 11
IU.L–1).
DISCUSSION
In the context of elderly the present reduction of food intake throughout the whole experiment caused a loss in skeletal muscle mass (i.e. PF versus CT) that is representative of sarcopenia. Indeed, sarcopenia is the progressive ageing-related loss of muscle mass that can be associated with ageing-related anorexia, one of its multiple causal factors (1). Muscle mass and ASR were lower in the APAP group than the CT group. These effects were not totally due to the APAP-induced reduction in food intake since muscle mass and ASR were predominantly lower in the APAP group than the PF group. Thus, the present data support the idea that repeated cures with APAP can worsen sarcopenia when the food intake is suboptimal.
The worsening of sarcopenia by APAP resulted from an imbalance between proteolysis and synthesis of muscle proteins during the experiment. Major alterations in these pathways would have occurred during C1, for which the loss of lean mass was predominant. At the end of the experiment muscle protein turnover seems unaffected since FSR and proteasome activities, known to be the major proteolytic system involved in muscle mass loss (31), were not significantly different among the three groups. A lack of regulation of the proteasome pathway may be explained by the decreased sensitivity of this pathway to regulatory signals during ageing as previously reported (32, 33). More interestingly, ASR that reflects the total amount of protein synthesized in muscles was low in the APAP group. This result emphasizes that protein metabolism responded to APAP cures in the muscle and that response, whatever the mechanism and the time-course, led to the deleterious decrease in muscle protein content and the worsening of sarcopenia.
The APAP-induced decrease in muscle ASR may have resulted from the increased sequestration of amino acids in the liver. Indeed the increased liver ASR suggests an inter-organ competition for the use of Cys under APAP treatment in favour
of the liver and at the expense of muscle. The increase in liver ASR resulted from the increase in FSR, the latter being consistent with the increase in phosphorylated 4E-BP1 (eukaryotic translation initiation factor 4E binding protein 1) reported in primary culture hepatocytes (34). However, liver protein content was unchanged, suggesting that the net sequestration of amino acids by the liver did not increase, unless the exportation of proteins increased.
The APAP-induced decrease in muscle ASR more likely resulted from the shortage of Cys. Indeed, plasma concentration in free cyst(e)ine, the form of Cys exchangeable between plasma and tissues decreased, whereas concentrations in IAA increased. This amino acid pattern strongly suggests that (i) Cys was the limiting amino acid for muscle protein synthesis in the APAP group and (ii) the lower protein synthesis rate in muscle could be responsible for the increase in plasma IAA. Indeed, it is of common knowledge that decreased availability in one IAA can compromise protein synthesis and that other IAA increase in plasma. Moreover, muscle lacking the enzymes necessary to synthetize Cys from methionine (35, 36), the decrease in plasma Cys could not be compensated by an intra-muscular conversion of methionine to Cys.
Another mechanism that could be responsible for alteration in protein metabolism in the course of APAP cures could be the decrease in anti-oxidative defense. Indeed, muscle content of glutathione, the major intra-cellular anti-oxidant, decreased consecutively to the APAP-induced shortage in Cys. The present APAP-induced decrease in muscle glutathione content implies a decrease in GSH, the reduced form being the major form and the anti-oxidative player. This lowered anti-oxidative defense had metabolic impact since oxidized forms of aminothiols, especially protein-bound glutathione, Hcy and Cys-Gly, increased whereas free forms of aminothiols, especially GSH and cyst(e)ine, decreased in APAP-treated rats. These observations are in favor of a global pro-oxidant environment that could have altered protein metabolism towards a loss of muscle proteins. Indeed, increased oxidative stress is known to induce muscle protein metabolism resistance to anabolic factors and is considered to be one of the major factors responsible for sarcopenia development (5, 37). Consequently, the APAP-765
Free amino acids (µmol.L–1)
IAA Met Ser CySS Tau
CT 1112 ± 89 34.7 ± 3.0 210 ± 22 42.4 ± 3.6 194 ± 17
PF 806 ± 61** 16.9 ± 2.0** 260 ± 20* 21.0 ± 3.1** 118 ± 7**
APAP 948 ± 48*† 27.8 ± 3.1†† 299 ± 19** 27.9 ± 4.1** 155 ± 15††
Free reduced and oxidized aminothiols (µmol.L–1)
Cyst(e)ine Hcy Cys-Gly
CT 116 ± 4 1.86 ± 0.2 0.93 ± 0.12
PF 131 ± 4** 1.39 ± 0.11** 0.76 ± 0.06
APAP 99 ± 5**†† 2.04 ± 0.19†† 0.67 ± 0.07*
Protein-bound aminothiols (µmol.L–1)
Cyst(e)ine Hcy Cys-Gly
CT 79.4 ± 5.1 2.67 ± 0.22 1.16 ± 0.05
PF 76.0 ± 3.2 1.58 ± 0.1** 1.06 ± 0.08
APAP 82.0 ± 4.3 3.35 ± 0.27*†† 1.38 ± 0.11*††
APAP, paracetamol group; CT, control group; Cys, cysteine; Cys-Gly, cysteinyl-glycine; CySS, cystine; Hcy, homocysteine; IAA, indispensable amino acids, the sum of histidine, isoleucine, leucine, lysine, methionine, phenylalanine and threonine; Met, methionine; PF, pair-fed group; Ser, serine. Cyst(e)ine is the sum of free Cys, CySS and small Cys disulfides. Values are means ± S.E.M. *P≤0.10, **P≤0.05 versus CT; †P≤0.10, ††P≤0.05 APAP versus PF, unpaired Student’s t test.
induced worsening of sarcopenia could also be partially explained by the overall pro-oxidative environment.
Finally, whether APAP or its metabolites could directly alter the protein synthesis machinery of muscle is unknown so far. Nevertheless, the absence of APAP-induced variation in final FSR and proteolytic activities supports that APAP did not act directly on protein turnover at least at the muscle level.
The shortage in Cys specifically induced by APAP was not due to a lower AA intake since APAP-treated rats ate the same amount of proteins as the PF rats. Cys shortage rather resulted from an imbalance between its utilizations and its endogenous synthesis rate. It is obvious that the quantity of Cys used in the liver to detoxify APAP contributed to the shortage of Cys. We previously reported that 43% of APAP was conjugated to sulphate and 11% to glutathione when rats received a 1% APAP diet (11). Since Cys is the precursor of both sulphate and glutathione (9), detoxification of APAP lead to an extensive use of Cys. In human, we have reported that the sulphur excreted into the urinary APAP metabolites corresponded to 20% of the sulfur amino acids ingested (19). The endogenous synthesis of Cys could also be impaired in APAP-treated rats compared to PF rats. Methionine is typically converted to Hcy through the transmethylation pathway. Then, Hcy is converted to Cys through the transsulfuation pathway: Hcy is condensed with serine to produce cystathionine that is hydrolyzed to form Cys. Transsulfuration occurs mainly in the liver. The present important increases in plasma methionine and Hcy associated with the increase in the methionine to total cyst(e)ine ratio suggest a lowered conversion of methionine to cysteine through the transsulfuration pathway in the APAP-treated rats. This was not due to a shortage in serine because its plasma concentration was not significantly different between the APAP and PF groups. Impairment of the transsulfuration pathway has been reported in cirrhosis (38) and methionine adenosyltransferase activities can be reduced by oxidative stress (39). Such an impairment might result from APAP-protein adducts and other protein alterations that we recently reported in the liver from rats under similar APAP exposure (40). Moreover, APAP-induced protein alterations could rationalize the increase in liver protein synthesis without significant increase in protein content between the APAP and PF groups. Indeed, altered nonfunctional proteins need to be degraded and replaced by newly synthesized proteins to ensure liver functions.
APAP detoxification was associated with the typical decrease in liver glutathione (41). This decrease is usually explained by an insufficient synthesis to cover its increased uses for detoxification purposes and to defend against oxidative stress (42). APAP has been shown to stimulate the turnover of hepatic glutathione in human (43) and to increase the activity of γ -glutamyl-cysteine synthetase, the limiting step in the glutathione synthesis pathway, in liver derived cells (44). However, the effect of APAP on the absolute synthesis rate of glutathione has never been quantified in the liver under treatment with APAP. We question whether a decrease in methionine conversion to Cys could be consistent with an increase in the absolute synthesis rate of glutathione. Liver glutathione concentration normally fluctuates with food intake, with storage during the postprandial period and export towards the other tissues during the post absorptive period (45). Liver is known to be a significant supplier of plasma glutathione (46) and this mechanism is important for the maintenance of peripheral glutathione and Cys homeostasis. The present decrease in glutathione hepatic content likely contributed to decreases in plasma free glutathione and Cys concentrations and contributed to the decrease in muscle protein and glutathione contents. Alternatively, muscle glutathione decrease may have resulted from a potential net release of glutathione by muscle in response to the persistent
shortage in Cys (47-49). Deep investigation of glutathione metabolism with labelled amino acid could provide clues regarding variations of glutathione contents in liver and muscle under treatment with APAP.
The present study provides new data concerning the effect of APAP on muscle in old rats that could be of value for older persons, for whom APAP is the first prescribed pain reliever (21). The present daily dose (260 mg.kg–1 rat body weight), after
conversion with adequate formulas that take into account body surface area (50), was equivalent to 43 mg.kg–1of body weight
for human. For a 70 kg human, 43 mg.kg–1correspond to 3 g.d–1.
The APAP dose used in the present study is definitively within the range of human therapeutic treatment. The present worsening effect of APAP on sarcopenia is consistent with our and another work in adults (11, 12). Our data provides additional data regarding elderly, for which mitigated effects of APAP were reported and protein intake not systematically documented (13-17). Altogether, it seems that the impact of APAP treatment in ageing muscle depends on the dose of the drug, the level of physical activity and the dietary protein intake. With the limit that rats were not their own controls, the present study emphasizes that sarcopenia could be worsened with APAP treatment when food intake is suboptimal, and Cys availability for muscle is reduced. Further clinical studies are needed to clarify the effect of repeated curative treatments with APAP on skeletal muscle mass in older persons having suboptimal or insufficient dietary intake. These studies should encompass the potential beneficial effect of paracetamol on the level of physical activity after pain relief.
Abbreviations: ALT, alanine transaminase; APAP, N-acetyl-para-aminophenol (acetaminophen, paracetamol); ASR, absolute synthesis rate; AST, aspartate transaminase; C, cure; Cys, cysteine; CySS, cystine; Cys-Gly, cysteinyl-glycine; CT, control group; EDL, extensor digitorum longus; FSR, fractional synthesis rate; GM, gastrocnemius; GSH, reduced glutathione; GSSG, glutathione homodisulfide; Hcy, homocysteine; IC, inter-cure; PF, pair-fed group; SOL, soleus; TA, tibialis anterior.
Acknowledgments: The authors thank Medhi Djelloul-Mazouz, Philippe Lhoste, Arlette Cissoire and Philippe Denis from the Installation Experimentale en Nutrition (INRA Clermont-Ferrand-Theix, France) for their excellent assistance with animal care.
This work was supported by Institut National de la Recherche Agronomique (INRA, France).
Conflicts of interest: None declared.
REFERENCES
1. Cruz-Jentoft AJ, Baeyens JP, Bauer JM, et al. Sarcopenia: European consensus on definition and diagnosis: Report of the European Working Group on Sarcopenia in Older People. Age Ageing 2010; 39: 412-423.
2. Walrand S, Guillet C, Salles J, Cano N, Boirie Y. Physiopathological mechanism of sarcopenia. Clin Geriatr Med 2011; 27: 365-385.
3. Fearon K, Evans WJ, Anker SD. Myopenia-a new universal term for muscle wasting. J Cachexia Sarcopenia Muscle 2011; 2: 1-3.
4. Cesari M, Landi F, Vellas B, Bernabei R, Marzetti E. Sarcopenia and physical frailty: two sides of the same coin. Front Aging Neurosci 2014; 6: 192. doi: 10.3389/fnagi.2014.00192
5. Dardevet D, Remond D, Peyron MA, Papet I, Savary-Auzeloux I, Mosoni L. Muscle wasting and resistance of muscle anabolism: the ‘anabolic threshold concept’ for adapted nutritional strategies during sarcopenia. ScientificWorldJournal 2012; 2012: 269531. doi: 10.1100/2012/269531
6. Nimni ME, Han B, Cordoba F. Are we getting enough sulfur in our diet? Nutr Metab (Lond) 2007; 4: 24. doi: 10.1186/1743-7075-4-24
7. Forrest JA, Clements JA, Prescott LF. Clinical pharmaco-kinetics of paracetamol. Clin Pharmacokinet 1982; 7: 93-107. 8. Hodgman MJ, Garrard AR. A Review of acetaminophen
poisoning. Crit Care Clin 2012; 28: 499-516.
9. Courtney-Martin G, Ball RO, Pencharz PB. Sulfur amino acid metabolism and requirements. Nutr Rev 2012; 70: 170-175.
10. Obled C, Papet I, Breuille D. Metabolic bases of amino acid requirements in acute diseases. Curr Opin Clin Nutr Metab Care 2002; 5: 189-197.
11. Mast C, Joly C, Savary-Auzloux I, Remond D, Dardevet D, Papet I. Skeletal muscle wasting occurs in adult rats under chronic treatment with paracetamol when glutathione-dependent detoxification is highly activated. J Physiol Pharmacol 2014; 65: 623-631.
12. Trappe TA, White F, Lambert CP, Cesar D, Hellerstein M, Evans WJ. Effect of ibuprofen and acetaminophen on postexercise muscle protein synthesis. Am J Physiol 2002; 282: E551-E556.
13. Wu MZ, Liu H, Fannin J, et al. Acetaminophen improves protein translational signaling in aged skeletal muscle. Rejuvenation Res 2010; 13: 571-579.
14. Wu M, Desai DH, Kakarla SK, et al. Acetaminophen prevents aging-associated hyperglycemia in aged rats: effect of aging-associated hyperactivation of p38-MAPK and ERK1/2. Diabetes Metab Res Rev 2009; 25: 279-286. 15. Wu MZ, Katta A, Gadde MK, et al. Aging-associated
dysfunction of Akt/protein kinase B: s-nitrosylation and acetaminophen intervention. PLoS One 2009; 4: 9. doi: 10.1371/journal.pone.0006430
16. Jankowski CM, Gozansky WS, MacLean PS, et al. N-acetyl-4-aminophenol and musculoskeletal adaptations to resistance exercise training. Eur J Appl Physiol 2013; 113: 1127-1136. 17. Trappe TA, Carroll CC, Dickinson JM, et al. Influence of
acetaminophen and ibuprofen on skeletal muscle adaptations to resistance exercise in older adults. Am J Physiol 2011; 300: R655-R662.
18. Deutz NE, Bauer JM, Barazzoni R, et al. Protein intake and exercise for optimal muscle function with aging: recommendations from the ESPEN Expert Group. Clin Nutr 2014; 33: 929-936.
19. Pujos-Guillot E, Pickering G, Lyan B, et al. Therapeutic paracetamol treatment in older persons induces dietary and metabolic adaptations related to sulfur amino acids. Age 2012; 34: 181-193.
20. Won AB, Lapane KL, Vallow S, Schein J, Morris JN, Lipsitz LA. Persistent nonmalignant pain and analgesic prescribing patterns in elderly nursing home residents. J Am Geriatr Soc 2004; 52: 867-874.
21. Ferrell B, Argoff CE, Epplin J, et al. Pharmacological management of persistent pain in older persons. Pain Med 2009; 10: 1062-1083.
22. Muth-Selbach US, Tegeder I, Brune K, Geisslinger G. Acetaminophen inhibits spinal prostaglandin E2release after
peripheral noxious stimulation. Anesthesiology 1999; 91: 231-239.
23. Nolin TD, McMenamin ME, Himmelfarb J. Simultaneous determination of total homocysteine, cysteine,
cysteinylglycine, and glutathione in human plasma by high-performance liquid chromatography: application to studies of oxidative stress. J Chromatogr B Analyt Technol Biomed Life Sci 2007; 852: 554-561.
24. Slimani L, Micol D, Amat J, et al. The worsening of tibialis anterior muscle atrophy during recovery post-immobilization correlates with enhanced connective tissue area, proteolysis, and apoptosis. Am J Physiol Endocrinol Metab 2012; 303: E1335-E1347.
25. Sayed RK, de Leonardis EC, Guerrero-Martinez JA, et al. Identification of morphological markers of sarcopenia at early stage of aging in skeletal muscle of mice. Exp Gerontol 2016; 83: 22-30.
26. Malmezat T, Breuille D, Pouyet C, Patureau Mirand P, Obled C. Metabolism of cysteine is modified during the acute phase of sepsis in rats. J Nutr 1998; 128: 97-105.
27. Smith PK, Krohn RI, Hermanson GT, et al. Measurement of protein using bicinchoninic acid. Anal Biochem 1985; 150: 76-85.
28. McNurlan MA, Tomkins AM, Garlick PJ. The effect of starvation on the rate of protein synthesis in rat liver and small intestine. Biochem J 1979; 178: 373-379.
29. Savary-Auzeloux I, Magne H, Migne C, et al. A dietary supplementation with leucine and antioxidants is capable to accelerate muscle mass recovery after immobilization in adult rats. PLoS One 2013; 8: e81495. doi: 10.1371/journal.pone.0081495
30. Fang CH, Sun X, Li BG, et al. Burn injuries in rats upregulate the gene expression of the ubiquitin-conjugating enzyme E2(14k) in skeletal muscle. J Burn Care Rehabil 2000; 21: 528-534.
31. Jagoe RT, Goldberg AL. What do we really know about the ubiquitin-proteasome pathway in muscle atrophy? Curr Opin Clin Nutr Metab Care 2001; 4: 183-190.
32. Dardevet D, Sornet C, Taillandier D, Savary I, Attaix D, Grizard J. Sensitivity and protein turnover response to glucocorticoids are different in skeletal muscle from adult and old rats. Lack of regulation of the ubiquitin-proteasome proteolytic pathway in aging. J Clin Invest 1995; 96: 2113-2119.
33. Wilkes EA, Selby AL, Atherton PJ, et al. Blunting of insulin inhibition of proteolysis in legs of older subjects may contribute to age-related sarcopenia. Am J Clin Nutr 2009; 90: 1343-1350.
34. Mezera V, Kucera O, Moravcova A, et al. Comparison of acetaminophen toxicity in primary hepatocytes isolated from transgenic mice with different apolipoprotein E alleles. J Physiol Pharmacol 2015; 66: 863-873.
35. Ishii I, Akahoshi N, Yu XN, et al. Murine cystathionine gamma-lyase: complete cDNA and genomic sequences, promoter activity, tissue distribution and developmental expression. Biochem J 2004; 381: 113-123.
36. Stipanuk MH, Ueki I. Dealing with methionine/homocysteine sulfur: cysteine metabolism to taurine and inorganic sulfur. J Inherit Metab Dis 2011; 34: 17-32.
37. Derbre F, Gratas-Delamarche A, Gomez-Cabrera MC, Vina J. Inactivity-induced oxidative stress: a central role in age-related sarcopenia? Eur J Sport Sci 2014; 14 (Suppl. 1): S98-S108. 38. Horowitz JH, Rypins EB, Henderson JM, et al. Evidence for
impairment of transsulfuration pathway in cirrhosis. Gastroenterology 1981; 81: 668-675.
39. Pajares MA, Alvarez L, Perez-Sala D. How are mammalian methionine adenosyltransferases regulated in the liver? A focus on redox stress. FEBS Lett 2013; 587: 1711-1716. 40. Mast C, Lyan B, Joly C, et al. Assessment of protein
modifications in liver of rats under chronic treatment with paracetamol (acetaminophen) using two complementary mass 767
spectrometry-based metabolomic approaches. J Proteomics 2015; 120: 194-203.
41. Buttar HS, Chow AYK, Downie RH. Glutathione alterations in rat-liver after acute and subacute oral-administration of paracetamol. Clin Exp Pharmacol Physiol 1977; 4: 1-6. 42. McGill MR, Jaeschke H. Metabolism and disposition of
acetaminophen: recent advances in relation to hepatotoxicity and diagnosis. Pharm Res 2013; 30: 2174-2187.
43. Lauterburg BH, Mitchell JR. Therapeutic doses of acetaminophen stimulate the turnover of cysteine and glutathione in man. J Hepatol 1987; 4: 206-211.
44. Geenen S, du Preez FB, Snoep JL, et al. Glutathione metabolism modeling: a mechanism for liver drug-robustness and a new biomarker strategy. Biochim Biophys Acta 2013; 1830: 4943-4959.
45. Jaeschke H, Wendel A. Diurnal fluctuation and pharmacological alteration of mouse organ glutathione content. Biochem Pharmacol 1985; 34: 1029-1033. 46. Ookhtens M, Kaplowitz N. Role of the liver in interorgan
homeostasis of glutathione and cyst(e)ine. Semin Liver Dis 1998; 18: 313-329.
47. Cho ES, Johnson N, Snider BCF. Tissue glutathione as a cyst(e)ine reservoir during cystine depletion in growing rats. J Nutr 1984; 114: 1853-1862.
48. Cotgreave IA, Goldschmidt L, Tonkonogi M, Svensson M. Differentiation-specific alterations to glutathione synthesis in and hormonally stimulated release from human skeletal muscle cells. FASEB J 2002; 16: 435-437.
49. Moriarty-Craige SE, Jones DP. Extracellular thiols and thiol/disulfide redox in metabolism. Annu Rev Nutr 2004; 24: 481-509.
50. Guidance for Industry. Estimating the Maximum Safe Starting Dose in Initial Clinical Trials for Therapeutics in Adult Healthy Volunteers. U.S. Dept. of Health and Human Services, FDA, CDER, (eds.) 2005.
Received: June 24, 2016 Accepted: October 31, 2016
Author’s address: Isabelle Papet, Unite de Nutrition Humaine, INRA Theix, 63122 Saint-Genes-Champanelle, France.