HAL Id: hal-02929047
https://hal.inrae.fr/hal-02929047
Submitted on 3 Sep 2020
HAL is a multi-disciplinary open access
archive for the deposit and dissemination of
sci-entific research documents, whether they are
pub-lished or not. The documents may come from
teaching and research institutions in France or
abroad, or from public or private research centers.
L’archive ouverte pluridisciplinaire HAL, est
destinée au dépôt et à la diffusion de documents
scientifiques de niveau recherche, publiés ou non,
émanant des établissements d’enseignement et de
recherche français ou étrangers, des laboratoires
publics ou privés.
Distributed under a Creative Commons Attribution| 4.0 International License
Diverse indica-aus Rice Panel
Aditi Bhandari, Nitika Sandhu, Jérôme Bartholome, Tuong-Vi
Cao-Hamadoun, Nourollah Ahmadi, Nilima Kumari, Arvind Kumar
To cite this version:
Aditi Bhandari, Nitika Sandhu, Jérôme Bartholome, Tuong-Vi Cao-Hamadoun, Nourollah Ahmadi,
et al.. Genome-Wide Association Study for Yield and Yield Related Traits under Reproductive Stage
Drought in a Diverse indica-aus Rice Panel. Rice, Springer Open, 2020, 13 (1), pp.53.
�10.1186/s12284-020-00406-3�. �hal-02929047�
O R I G I N A L A R T I C L E
Open Access
Genome-Wide Association Study for Yield
and Yield Related Traits under
Reproductive Stage Drought in a Diverse
indica-aus Rice Panel
Aditi Bhandari
1,2, Nitika Sandhu
1,3, Jérôme Bartholome
1,4,5, Tuong-Vi Cao-Hamadoun
4,5, Nourollah Ahmadi
4,5,
Nilima Kumari
2and Arvind Kumar
1,6*Abstract
Background: Reproductive-stage drought stress is a major impediment to rice production in rainfed areas. Conventional and marker-assisted breeding strategies for developing drought-tolerant rice varieties are being optimized by mining and exploiting adaptive traits, genetic diversity; identifying the alleles, and understanding their interactions with genetic backgrounds for their increased contribution to drought tolerance. Field experiments were conducted in this study to identify marker-trait associations (MTAs) involved in response to yield under
reproductive-stage (RS) drought. A diverse set of 280 indica-aus accessions was phenotyped for ten agronomic traits including yield and yield-related traits under normal irrigated condition and under two managed
reproductive-stage drought environments. The accessions were genotyped with 215,250 single nucleotide polymorphism markers.
Results: The study identified a total of 219 significant MTAs for 10 traits and candidate gene analysis within a 200 kb window centred from GWAS identified SNP peaks detected these MTAs within/ in close proximity to 38 genes, 4 earlier reported major grain yield QTLs and 6 novel QTLs for 7 traits out of the 10. The significant MTAs were mainly located on chromosomes 1, 2, 5, 6, 9, 11 and 12 and the percent phenotypic variance captured for these traits ranged from 5 to 88%. The significant positive correlation of grain yield with yield-related and other agronomic traits except for flowering time, observed under different environments point towards their contribution in
improving rice yield under drought. Seven promising accessions were identified for use in future genomics-assisted breeding programs targeting grain yield improvement under drought.
Conclusion: These results provide a promising insight into the complex genetic architecture of grain yield under reproductive-stage drought in different environments. Validation of major genomic regions reported in the study will enable their effectiveness to develop drought-tolerant varieties following marker-assisted selection as well as to identify genes and understanding the associated physiological mechanisms.
Keywords: Reproductive-stage drought, Rice, Genetic diversity, Association mapping, Quantitative trait loci
© The Author(s). 2020 Open Access This article is licensed under a Creative Commons Attribution 4.0 International License, which permits use, sharing, adaptation, distribution and reproduction in any medium or format, as long as you give appropriate credit to the original author(s) and the source, provide a link to the Creative Commons licence, and indicate if changes were made. The images or other third party material in this article are included in the article's Creative Commons licence, unless indicated otherwise in a credit line to the material. If material is not included in the article's Creative Commons licence and your intended use is not permitted by statutory regulation or exceeds the permitted use, you will need to obtain permission directly from the copyright holder. To view a copy of this licence, visithttp://creativecommons.org/licenses/by/4.0/.
* Correspondence:a.kumar@irri.org
1Rice Breeding Platform, International Rice Research Institute, DAPO Box,
7777 Metro Manila, Philippines
6IRRI South Asia Regional Centre, Varanasi 221006, India
Background
Drought is one of the major pervasive and limiting fac-tors affecting rice productivity in the Asian-Pacific re-gion under rainfed lowland (46 million hectares; Mha) and upland (10Mha) rice ecosystems (Pandey et al.
2007). Each year, varying intensities of drought stress at different crop stages- seedling, vegetative and reproduct-ive (Price and Courtois 1999; Tripathy et al. 2000; Xu et al. 2011; Nguyen and Bui 2008) affect approximately 34 Mha of rainfed lowland and 8 Mha of upland rice production in Asia (Huke and Huke1997) as the popu-lar high-yielding green revolution varieties, bred primar-ily for yield under high input conditions, experience drastic yield reductions even under mild drought stress (O’Toole 1982; Kumar et al. 2008; Torres and Henry
2018). Drought is particularly damaging in the repro-ductive stage (RS), especially during flowering (Venupra-sad et al. 2007; Serraj et al. 2009) reducing both the number of grains per panicle and grain weight and in-creasing grain sterility. Worldwide, rice production is predicted to be further challenged by an erratic and in-creasing frequency and severity of drought due to cli-mate change (Wassmann et al. 2009). Combining high productivity with climate resilience is thereby essential to stabilize production by developing climate-smart var-ieties for adverse ecologies.
Over the years, efforts at International Rice Research Institute (IRRI) for improving yield under drought have documented the effectiveness and response of direct se-lection for grain yield under drought in upland rice (Venuprasad et al. 2007) and lowland rice (Kumar et al.
2008, 2009), proving the effectiveness of direct selection for grain yield over secondary traits under drought, as a result of which many varieties have been developed (Kumar et al.2014; Sandhu and Kumar 2017). The dif-ferent breeding methods followed to improve drought tolerance ranged from marker-assisted breeding (MAB) wherein numerous studies (Fernando and Grossman
1989; Lande and Thompson 1990; Zhang et al. 1992; Howes et al. 1998; Bonnett et al. 2005; Bernardo and Charcosset 2006; Xu and Crouch 2008) used different strategies for increasing favorable alleles in breeding populations for quantitative traits to genomics-assisted breeding (GAB) for improving breeding efficiency by exploiting genome characterization for diversity and function (Varshney et al.2005, 2014; Abbai et al. 2019) and transgenic breeding (Bhatnagar-Mathur et al. 2008; Yang et al.2010a), all of which have helped obtain yield gains and ensured both yield and grain quality improve-ments over existing varieties. However, complex quanti-tative traits like grain yield under drought, resistance to other existing and emerging abiotic and biotic stresses are a challenge as they are characterized by interactions of several large and small effect genes for a single trait;
of genes for different traits as well as of genes with the environment and genetic backgrounds (Xue et al. 2009; Wang et al.2012; Kumar et al.2014; Yadav et al.2019). To tackle the restrictive applicability of breeding for complex traits, studies conducted have exploited germ-plasm for desirable variability (Dixit et al.2014; Mondal et al.2016; Kumar et al.2018) and applied precise selec-tion in experiments under different environments and stress intensity levels to emulate farmers’ field conditions.
Genome-wide association study (GWAS) is an import-ant tool in GAB with enormous potential to accelerate breeding for stress tolerance as it enables breeders to make selection based on marker-trait associations (MTAs) as a response to combined effect of all favorable alleles. The transfer of well-characterized genes/ QTLs in breeding programs for varietal development was ini-tially low as the genomic regions of interest were being identified in biparental populations. Subsequently, iden-tification of genomic regions associated with agronomic traits has been accelerated by association mapping in panels with larger genetic background allowing the use of ancestral recombination events, which led to non-random association of alleles at different loci across the genome, and that too at a higher mapping resolution than the biparental linkage analysis (Zhu et al.2008).
Using different methods, GWAS has been successfully employed in rice for a wide range of traits like yield and yield components (Agrama et al.2007), harvest index (Li et al. 2012), flowering time (Ordonez Jr et al. 2010) among others. GWAS in diversity panels (unrelated di-verse germplasm) including locally adapted breeding ma-terial is highly advantageous to breeders (Bernardo
2008) for incorporation of detected beneficial alleles to develop climate-smart varieties (Pauli et al. 2014) as maximum allelic diversity contributing to agronomic traits is identified, as exemplified by Huang et al. (2012) for flowering time and grain yield in worldwide rice germplasm collection; Zhao et al. (2011) and Yang et al. (2010b) for revealing the rich genetic architecture and natural variants of complex traits. Effective population size to select for desired plant type and high yield under upland ecosystem with tolerance to moderate drought stress in lowland ecosystem (Gu et al.2012) is essential for crossing and successful selection in breeding pro-grams that integrate modern and affordable strategies for varietal development across environments (Kondo et al.2000; Samejima et al.2016; Xia et al.2016).
In the present study, GWAS was performed on ten agronomic traits including grain yield and its compo-nents in a diverse set of 280 indica-aus accessions to identify the significant MTAs/ QTLs/ genes to study the effect of trait architecture in identifying genomic regions associated with traits of interest across seasons and
environments. The analysis was conducted using differ-ent model algorithms and results reported include the consistent MTAs detected by two multi-locus methods-SUPER and Farm-CPU. The diverse set used in the study included accessions from both lowland and upland ecosystems with the premise to identify highly drought-tolerant rice accessions in either ecosystem or having at least moderate drought-tolerance in the other to breed for reproductive stage drought-tolerant rice varieties for different growing environments.
Results
Phenotypic and Genotypic Characteristics of the Population
Distribution, Heritability and Correlation of the Measured Phenotypic Traits
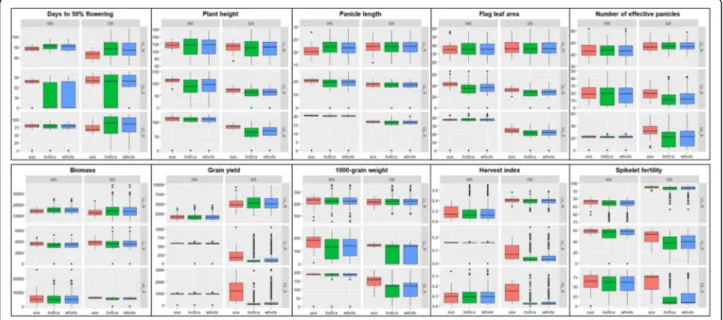
Box-plots of the adjusted means of the ten phenotypic variables - days to 50% flowering (DTF), plant height (PH), panicle length (PL), flag leaf area (FlgLA), number of effective panicles (NBP), biomass at maturity (BMDW), grain yield (GY), 1000-grain weight (TGW), harvest index (HI) and spikelet fertility (SPKFT) under three environments (control condition or non-stress ex-periment in lowland- LL_N; reproductive-stage drought-stress experiments in lowland- LL_S and upland- UL_S) in two seasons- 2014 wet season (WS) and 2015 dry sea-son (DS) are presented in Fig. 1. The plots depicted at two levels- whole population and genetic subgroup,
highlight that the mean phenotypic performances of dif-ferent levels (whole population with 280 lines, indica genetic subgroup with 245 lines and aus genetic sub-group with 35 lines) in each environment and season were not significantly different except for DTF, HI, TGW and SPKFT. Overall, trait range was higher in DS than WS; PH, FlgLA, BMDW and NBP exhibited a rea-sonably symmetric distribution while DTF, GY and SPKFT exhibited skewed distributions across environ-ments and seasons. Under drought, all traits values ex-cept for DTF decreased as compared to the LL_N environment. Multidimensional analysis of phenotypic data for WS and DS was performed with experiment-wise data projected on the space defined by the first two axes of factorial discriminant analysis (FDA) using the Yadj values for the 10 agronomic traits. In general, the
phenotypic distribution was greater in DS than WS (Additional file 1: Figure S1a). Fisher distances were highly significant (p < 0.001) between the experiments of WS and DS. The projection of the ten traits across ex-periments revealed different degrees of relatedness be-tween the traits measured at different growth stages of life cycle (Additional file 1: Figure S1b). PH, PL, GY, SPKFT and NBP were the major factors affecting about 80% variance explained in both WS and DS. Higher grain yield reduction was observed in DS lowland stress experiment (98%) followed by upland stress experiment (94%) (Additional file1: Table S1). Significant effects of
Fig. 1 Boxplots of ten phenotypic variables within diverse set. Days to 50% flowering, Plant height (cm), Panicle length (cm), Flag leaf area (cm2),
Number of effective panicles, Biomass dry weight at maturity (kg ha−1), Grain yield (kg ha-1), 1000 grain weight (g), Harvest index and Spikelet
fertility (percentage ratio by weight) for each of the six experiments (lowland non stress-LL_N, lowland stress-LL_S and upland stress-UL_S) in the two seasons- wet season-WS and dry season-DS. The boxplots are divided into population and subpopulation levels for each trait-whole population level (with all 280 indica-aus accessions): 245 accessions representing the four major genetic subgroups of indica genetic background and 35 accessions of aus genetic background. Within the boxplots, bold line represents the median, box edges represent upper and lower quantiles, and whiskers are 1.5 times the quantile of the data. Open dots represent the outliers
drought stress were observed on DTF as reflected by early flowering in WS but late flowering in DS for toler-ant accessions. Heritability was in medium and high range for all the 10 traits in the two seasons, with rela-tively higher trait heritability in DS than WS (Table 1). The phenotypic variance was partitioned into different sources of variations using the mixed model analysis. As shown (Table 1), genotype effect contributed signifi-cantly to the observed variation for all traits across environments.
Trait correlation within DS and WS was studied for the 10 traits for each experiment (Fig. 2). As expected, DTF was negatively correlated to grain yield and yield-related traits under drought stress in both seasons (in the range of − 0.03 to − 0.72). The grain yield related traits such as NBP, BMDW, TGW and HI as well as PL showed significant positive correlation with GY across seasons and experiments; for the LL_S and UL_S envi-ronments, this correlation was positive (0.06–0.91) while for LL_N condition, the range of this correlation was from 0 to 0.51. Overall, the correlation was strong in DS as compared to WS. Seasonal variation was observed in trait correlations between environments- while in DS, the correlations between all three environments was sig-nificantly positive for all traits (range of− 0.18-0.72), the correlations between two drought environments was negligible in WS, in the range of− 0.11-0.12 (Additional file1: Figure S2).
Phenotypic Effect of the Drought Stress on Tolerance and Susceptibility in the Diverse Set
Differences in response to RS drought at agronomic level are presented in Table1. Significant effect of treatments (control and RS drought stress), environments (lowland and upland) and seasons (WS and DS) was observed on the traits measured in the present study. The DTF in-creased under both, lowland and upland reproductive-stage drought stress in DS (from 87.83 days in LL_N to 88.09 days and 93.07 days in LL_S and UL_S, respect-ively) while in WS, early flowering was observed under both stress environments (from 90.4 days in LL_N to 79.66 days and 80.28 days under LL_S and UL_S, re-spectively). Moreover, as shown in Fig.1, effect of sub-population on DTF was significant in LL_S in WS and UL_S in DS. In both WS and DS, plant height, panicle length and spikelet fertility reduced significantly under the two stress environments. The extent of reduction was more under very severe stress levels realized in DS (Additional file1: Table S1) under both LL_S and UL_S, where PH was reduced by 39.54 cm and 37.6 cm, spectively; PL was reduced by 4.28 cm and 5.7 cm, re-spectively and SPKFT was reduced by 49% and 71%, respectively. SPKFT was quite variable at subpopulation level as well, especially in DS under LL_S and UL_S;
while under LL_S, SPKFT at population level (280 acces-sions) and in the indica subset (245 accesacces-sions) was re-duced to 47% and 40%, respectively, it was interestingly greater in the aus subset (35 accessions) at 60% and similarly, these figures under UL_S in DS were 25%, 16% and 70%, respectively. Yield was markedly reduced under RS drought in both lowland and upland stress environ-ments and this was reflected in the various component trait measurements, especially in NBP and SPKFT. The reduction in GY under LL_S and UL_S was more in DS; in WS, GY was reduced by 64% in LL_S and 57% in UL_ S while in DS, it was reduced by 98% in LL_S and 93% in UL_S.
Consequently, analysis of variance for all traits mea-sured in the present study revealed high significant dif-ferences between the two treatments (control and RS drought stress) for all traits (Table 2). However, the growing environment (lowland and upland) did not sig-nificantly affect the PL and SPKFT measurements while the growing season (WS / DS) had the least effect on the differences in genotypic trait performances for DTF, NBP and BMDW. The drought susceptibility index (DSI) calculated for each genotype under both lowland and upland environments for the selected traits (Add-itional file 1: Table S2). indicated that the accessions with high levels of drought tolerance and good recovery ability (recorded by leaf rolling scores) could still pro-duce some grains even under severe level of drought stress at reproductive stage. The number of tolerant ge-notypes differed by DSI under different growing environments.
Population Structure Analysis
The density, distribution of allele frequencies and het-erozygosity of the working set of 215,250 loci (215 k) is summarized in Additional file1: Table S3. For this 215 k SNP set, there is an uneven distribution of markers along the genome. Average density of markers per Mb of the genome was 503 SNPs. High-density marker re-gions were observed on chromosomes 2 and 4, with a magnitude of about 493 and 438 SNPs per Mb and on chromosome 11 with a magnitude of about 1231 SNPs between 22 and 27 Mb region. The distribution of markers along each chromosome is depicted as heatmap in Additional file1: Figure S3.
For the 215 k marker set, average observed heterozy-gosity (Ho) at the accession level was 0.86% with a mini-mum and maximini-mum of 0.4% and 4.81%, respectively. The distribution of Ho varied among the 12 rice chro-mosomes in the working set and with an average of 0.36%, chromosomes, more heterozygous calls were mainly on chromosomes 7, 9, 10 and 12 (Additional file
Table 1 Summary statistics and sources of variation for the ten phenotypic traits under three different environments and two seasons for the diverse set of 280 lines
Trait Env Wet Season Dry Season
Mean (SD) Phenotypic variance Mean (SD) Phenotypic variance
Fixed Random H2 Fixed Random H2
Genotype Residual Genotype Residual
DTF LL_ N 90.4 (8.69) 0.36 22.55NS 52.22 0.34 87.83 (9.53) 0.12 76.31d 23.49 0.75 LL_S 79.66 (6.7) 2.29 37.89d 6.02 0.90 88.09 (16.68) 5.96 212.92d 68.03 0.85 UL_ S 80.28 (9.64) 0.01 55.82d 39.41 0.72 93.07 (20.09) 4.78 357.44d 51.19 0.93 PH LL_ N 113.79 (24.23) 1.18 579.55d 42.06 0.93 108.63 (21.2) 0.08 538.47d 21.62 0.96 LL_S 102.42 (26.61) 8.70 605.08d 104.52 0.92 69.09 (16.67) 3.34E-15 191.30d 90.86 0.79 UL_ S 110.23 (29.58) 20.55 241.92NS 616.22 0.43 71.03 (15.55) 8.56 196.20d 46.21 0.88 PL LL_ N 21.75 (3.41) 0.01 1042d 1.86 0.91 22.15 (3.16) 0.02 9.29d 2.05 0.81 LL_S 20.05 (3.12) 0.07 5.65d 4.13 0.79 17.87 (3.35) 0.04 5.19d 5.88 0.63 UL_ S 20.41 (3.22) 0.64 1.64NS 8.13 0.16 16.45 (2.09) 0.41 1.45d 2.58 0.50 FlgLA LL_ N 36.0 (10.92) 0.02 83.89d 36.74 0.68 36.73 (9.74) 0.09 98.77d 12.34 0.89 LL_S 40.19 (13.46) 1.31 79.15d 101.37 0.68 29.85 (9.81) 1.65 43.95d 50.54 0.71 UL_ S 37.77 (11.95) 6.51 24.81NS 111.33 0.19 22.96 (6.04) 1.67 17.56d 17.99 0.63 BMDW LL_ N
15.57E + 03 (92E + 02) 0.05 3.13E + 07d 5.48E + 08 0.34 14.78E + 03 (67.81E +
02)
1.92E + 05
4.23E + 07d 9.9E + 06 0.82
LL_S 36.13E + 02 (14.4E + 02) 1.11E + 05 4.86E + 05a 15.06E + 05 0.40 36.50E + 02 (15.49E + 02) 3.37E + 04 6.6E + 05d 1.75E + 06 0.50 UL_ S
54.61E + 02 (56.5E + 02) 2.07E + 05
5.87E + 07NS
3.18E + 07 0.35 55.29E + 02 (18.14E + 02) 3.65E + 05 7.29E + 05NS 2.34E + 06 0.42 NBP LL_ N 46.99 (18.24) 0.03 214.91b 126.33 0.70 54.81 (17.02) 1.93 130.23c 162.03 0.44 LL_S 20.38 (14.57) 2.38 15.81NS 211.05 0.20 14.99 (13.59) 2.91 102.80d 83.08 0.76 UL_ S 23.32 (16.38) 11.35 0.22NS 255.78 0.23 24.84 (14.38) 2.9 136.37d 73.28 0.78 GY LL_ N 16.66E + 02 (10.03E + 02)
0.05 7.94E + 05d 2.28E + 05 0.84 5.21E + 02 (16.8E + 02) 2.41E + 04
3.92E + 06d 1.55E + 06
0.68 LL_S 5.73E + 02 (6.28E + 02) 7.79E +
03
3.68E + 04NS
3.52E + 05 0.20 1.58E + 02 (2.89 E + 02) 1.4E + 03 4.91E + 04d 3.49E +
04
0.74 UL_
S
9.42E + 02 (9.24E + 02) 0.02 3.26E +
04NS 8.23E + 05 0.13 3.36E + 02 (6.1 E + 02) 2.29E +09 8.12E + 09 d 2.52E+ 04 0.91 TGW LL_ N 198.13 (77.77) 79.37 2221.13b 3824.46 0.37 218.53 (39.82) 112.63 1528.06d 191.65 0.89 LL_S 149.2 (80.97) 75.33 0.01NS 6481.26 0.20 113.26 (79.5) 158.25 2139.19d 4015.32 0.52 UL_ S 177.96 (84.55) 96.99 0.01NS 7100.32 0.10 83.69 (78.41) 138.69 4111.16d 1870.32 0.81 HI LL_ N 0.17 (0.15) 0.01 0.001NS 0.02 0.30 0.39 (0.11) 2.4E-04 0.006d 0.005 0.61
LL_S 0.15 (0.17) 4.8E-06 2.03E-03NS 0.03 0.21 0.05 (0.08) 5.2E-05 0.004d 0.003 0.76
UL_ S
0.11 (0.1) 0.001 8E-05NS 0.01 0.14 0.05 (0.09) 8.2E-05 0.006d 0.003 0.82
Phylogenetic diversity illustrated by the unweighted NJ tree (Fig.3a) validated the population structure analysis of diversity panel clustering into three main groups (Fig.
3b): Cluster-I with indica subgroups of ind2, ind3 and indx, Cluster-II aus background and Cluster-III with indica subgroups of ind1A, ind1B, ind3 and indx genetic background. The ideal K value with the least cross-validation error detected by the population structure
analysis was determined as 3 (Fig.3c). PCA output of R/ GAPIT illustrated accessions clustering in 3 distinct groups when plotted against the first three PC compo-nents (Fig. 3d). The decay of linkage disequilibrium along the physical distance is depicted in Additional file
1: Figure S4. The rapid decay of r2 of 0.145 between markers with distance of 0–25 kb to half of the initial level was observed around 200 kb.
Table 1 Summary statistics and sources of variation for the ten phenotypic traits under three different environments and two seasons for the diverse set of 280 lines (Continued)
Trait Env Wet Season Dry Season
Mean (SD) Phenotypic variance Mean (SD) Phenotypic variance
Fixed Random H2 Fixed Random H2
Genotype Residual Genotype Residual
N
LL_S 57.49 (29.94) 29.36 106.46NS 762.52 0.22 47.03 (31.33) 81.07 315.92d 615.27 0.60
UL_ S
61.19 (29.59) 0.01 86.21NS 892.48 0.15 25.19 (34.85) 27.01 809.67d 349.53 0.81
SD standard deviation, Env environment (lowland non-stress, LL_N; lowland stress, LL_S and upland stress, UL_S), Fixed effects block (rep), Random effects genotype and residual, H2
broad sense heritability for single environment analysis, DTF days to 50% flowering, PH plant height (cm), PL panicle length (cm), FlgLA flag leaf area (cm2
), BMDW biomass dry weight at maturity (kg ha−1), NBP number of effective panicles, GY grain yield (kg ha−1), TGW 1000 grain weight (g), HI harvest index and SPKFT spikelet fertility from each of the six experiments in two seasons (wet and dry).a
significant at 5%,b
significant at 1%,c
significant at 0.1%,
d
significant at 0.01% levels and NS- Non-significant
Fig. 2 Plots of Pearson’s r-values showing correlation between each of the ten traits in each of the six experiments (LL_N_WS-lowland non-stress 2014WS, LL_N_DS-lowland non-stress 2015DS, LL_S_WS-lowland stress 2014WS, LL_S_DS-lowland stress 2015DS, UL_S_WS-upland stress 2014WS and UL_S_DS-upland stress 2015DS). Blue color indicates positive correlation and red color indicates negative correlation among different traits, with color intensity variance depicting the strength of correlation. *significant at < 0.05 level, **significant at <0.01 level, *** significant at < 0.001 level, blank for non-significant
Effect of Trait Architecture and Heritability on MTA Identification Across Seasons and Environments
The phenotypic variance (PV) captured for the ten traits by the GWAS models reveal that severity of drought stress realized in the experiment and correlation of trait to grain yield cause significant differences in variations across seasons. For DTF, high heritability and negative correlation to GY under reproductive-stage drought in upland environment and zero to negligibly positive cor-relation in lowland environment, the PV ranged from 15 to 29% in the wet season while in the dry season, it was between 19 and 42% across lowland and upland environ-ments. Similarly, for PH which is another highly herit-able trait, the PV ranged uniformly between 34 and 53% across seasons, environment and stress. However, for GY, highly heritable but polygenic trait, variation be-tween wet and dry season was quite apparent. While PV ranged from 5 to 17% only in WS, it was in range of 12–
55% for DS. Similarly, for some yield related traits, NBP (55–63%), PL (at least 80% in LL_N and UL_S and 6– 29% in LL_S) and FlgLA (at least 80% in non-stress and WS and less than 15% in DS stress), the model explained significant variance for the traits. However, for traits with either low heritability or narrow range of pheno-typic values like BMDW (6–27%), HI (5–17%), TGW (5–16%) and SPFKT (5–30%), very minimal phenotypic variance was captured by markers across environments and seasons.
GWAS Identified Significant Genomic Regions Associated with Yield and Yield Components under Different Growing Environments for RS Drought
Several significant MTAs and QTLs were identified in the present study for the 10 traits. Among the 219 sig-nificant MTAs identified in the study, 95 were associated with grain yield across different environments, seasons
Table 2 Analysis of variance (F-values) for grain yield, yield components and agronomic traits among treatments, conditions and seasons for the diverse set of 280 lines
Sources of variations Df DTF PH PL FlgLA NBP BMDW GY HI TGW SPKFT
Treatment 1 348.69c 497.02c 403.82c 227.76c 3136.14c 4062.87c 4524.94c 1856.72c 652.32c 2508.07c
Condition 1 173.25c 19.93c 0.5NS 8.07b 58.63c 76.61c 30.86c 12.14c 21.2c 2.61NS
Season 1 4.35a 223.68c 40.59c 155.89c 7.19b 1.31NS 430.86c 50.45c 51.74b 166.89c
Treatment:Season 1 19.73c 67.91c 29.64c 94.02c 84.76c 4.69a 1951.55c 1045.64c 100.08c 241.19c
Condition:Season 1 42.3c 11.62c 19.1c 30.39c 18.88c 0.85NS 3.51. 9.1b 39.13c 57.03c
Sources of variation analysed using two treatment levels (control, stress); two growing conditions (lowland, upland) and two seasons (wet and dry) for ten traits at
a
significant at 5%,bsignificant at 1%,csignificant at 0.1% levels and NS- Non-significant levels
Fig. 3 Genetic relatedness and population structure of the diversity panel; a Genetic diversity depicted through the unweighted neighbour-joining tree method within the population as indica (ind1A, ind1B, ind2, ind3 and indx) and aus accessions, as established in the 3k rice genome project; b Ancestory proportions from ADMIXTURE analysis represented for k = 3, the optimal with the lowest cross-validation error for K = 2–8 and visualized using R/pophelper package; c Cross-validation error for k = 2–8 from ADMIXTURE analysis; d Variation captured by the PCs using R/ GAPIT corresponding to the 3 clustered distribution along the first three PC components
and stress levels, 20 with DTF, 34 with PH, 8 with BMDW, 13 with NBP, 25 with HI, 10 with TGW and 20 with SPKFT while no significant association was de-tected for PL and FlgLA (Additional file 1: Table S4). Circular manhattan plots and qq-plots for MTAs de-tected using two p-value thresholds (1e-6 and 1e-4) to draw out common regions associated with trait across seasons and environments at season-level (WS and DS) and combined-season level are presented in Figs. 4, 5,6
for DTF, PH, GY, respectively and in Additional file 1: Figure S5 a-g for PL, FlgLA, BMDW, NBP, HI, TGW and SPKFT.
Among the 16 identified QTLs (Additional file 1: Table S4), four QTLs (qGY1–1, qGY1–2, qPH1–1 and
qPH1–2) showed consistent effect across both seasons
and under different environments; two QTLs showed consistent effect under lowland stress (qBMDW8–1 and
qDTF11–1), six QTLs under upland stress (qGY2–1,
qGY2–2, qGY5–1, qGY5–2, qPH9–1 and qGY12–1), two
QTLs under both lowland non-stress and stress (qSPKFT9–1 and qBMDW-NBP9–1) and two under
low-land non-stress across seasons (qDTF6–1 and qDTF6–2).
Significant MTAs were reported for GY on chr 1 and 12 under LL_N, on chr 1, 2, 5, 6, 7, 8, 11 and 12 under LL_ S, while on chr 1, 2, 4, 5, 6, 7, 8, 11 and 12 under UL_S. Out of these, consistent across experiment level and combined level were on chr 10 for LL_N, on chr 1, 7, 8 and 12 for LL_S and on chr 2, 5, 7 and 8 for UL_S. In about 0.403 Mb interval region on long arm of chr 1 and 4.27 Mb interval region on long arm of chr 2, MTAs were found to be associated with GY under non stress and reproductive stage drought stress conditions for both lowland and upland across seasons, in previously reported major grain yield QTLs under drought– qDTY1.1 and qDTY2.3. Three SNPs in a region of 5.06
Mb interval on long arm of chr 11 are reported to be linked with reproductive stage drought stress under low-land and uplow-land conditions across seasons from this study. The 0.941 Mb interval region below centromere on chr 12 showed association with GY under different level of stresses in upland environment (Fig. 6). Under different environmental stresses, the MTAs for DTF were reported on chr 6 (7611279–7,749,410 bp, 9,539, 728–10,371,528 bp), chr 7 (19598023–20,159,780 bp), chr 11 (6525213–7,215,940 bp) and chr 12 (7712803–9, 203,018 bp). Comparison of experiment level and com-bined analysis showed consistent effect of MTAs for DTF on chr 6 (7611279–7,749,410 bp) under lowland non-stress and on chr 11 (6525213–6,602,990 bp) for lowland stress (Fig. 4). The long arm of chr 1 (33418648–34,400,345 bp, 37,960,019–39,044,781 bp), chr 3 (33600040–33,600,989 bp), chr 6 (30802585–30, 807,826 bp), chr 9 (13423222–16,154,337 bp) and chr 11 (20143839–24,761,315 bp, 25,597,507–28,789,891 bp)
was observed to be associated with plant height trait under different environments, stress levels and seasons, with MTAs on chr 1 consistent at both individual ex-periment and combined levels (Fig. 5). Some SNPs such as S5_352058, S5_4140355, S5_4266313, S8_857745, S9_ 19316065 and S9_20944019 with very high and almost similar levels of significance were associated with more than one grain yield and yield related traits. However, the SNP S1_3440034 and S12_1642245 were associated with PH and GY, respectively under different environ-mental stresses.
Subpopulation Specific GWAS for Grain Yield under Different Growing Environments and Seasons
Aus-type rice is closely related to indica-type rice but constitutes a distinct genetic group (McNally et al.
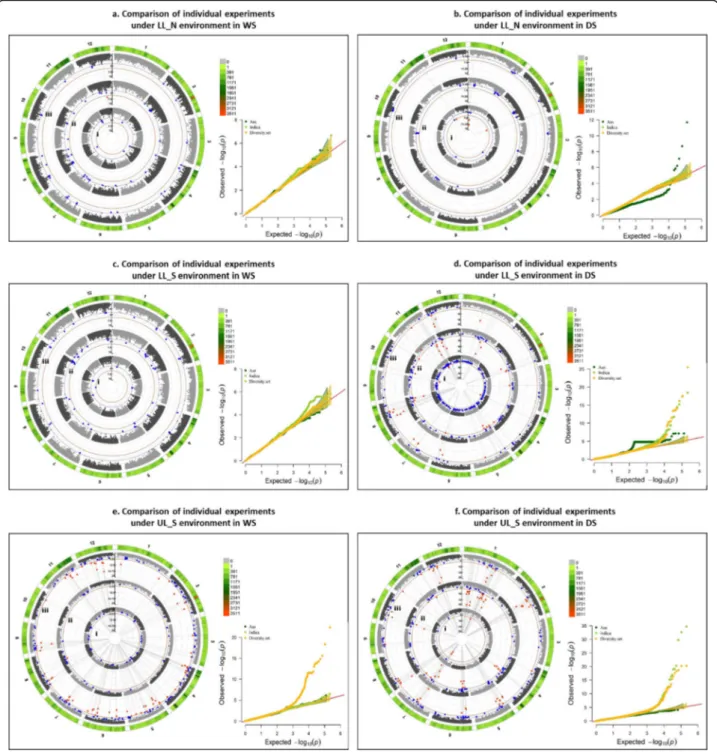
2009). The superiority of aus accessions over indica ac-cessions in the present study was established by the sub-population based GWAS performed for GY wherein upland-adapted aus accessions yielded consistent yields under RS drought, especially in DS (Additional file 1: Table S5). While significant loci associated with GY under different environments and seasons at complete diversity set level (280 lines) corresponded to those de-tected at aus subpopulation level (35 accessions) (as shown in Fig.7), 25 additional MTAs were detected at indica subpopulation level (245 accessions) in DS-mainly on chr 1 and 11 under LL_S (Fig.7d) and on chr 1 and 4 under UL_S environment (Fig.7f).
Candidate Gene Analysis for Drought Tolerance under Different Growing Environments
Candidate gene analysis of the 219 MTAs with a 200 kb window centered from the MTA detected 101 of these MTAs within/ in close proximity to 38 genes from MSU database and 4 earlier reported major grain yield QTLs under drought (qDTY1.1,
qDTY2.3, qDTY9.1 and qDTY12.1.). Summary of these
results is presented in Table 3 wherein we also re-port 6 novel QTLs of about 0.5–1 Mb for DTF on chr 6, 11; for GY on chr 1, 2, 5 and for BMDW on chr 8 identified with strong peak markers across drought environments, associated mainly with puta-tive retrotransposon proteins. An overview of the re-sults for validation of MTAs for 7 traits out of 10 is presented in Fig. 8 which depicts the genomic loca-tions of 101 MTAs validated from MSU database and literature for previously reported QTLs under drought. The significant MTAs/ QTLs were mainly located on chr 1, 2, 5, 6, 9, 11 and 12 and the per-cent phenotypic variance captured for these traits ranged from 5 to 88%.
Fig. 4 Circular manhattan plot and qq plot for Days to 50% flowering (DTF). a. Each of the six experiments (from centre of the plot- 1. lowland non-stress 2014WS(LL_N_WS); 2. lowland non-stress 2015DS (LL_N_DS); 3. lowland stress 2014WS (LL S WS): 4. lowland stress 2015DS (LL_S_DS); 5. upland stress 2014WS (UL_S_WS) and 6. upland stress 2015DS (UL_S_DS) for p-values obtained using Farm-CPU method at two significance thresholds of 1e-4 (blue) and 1e-6 (red). The outermost ring depicts the SNP distribution in the 215,250 SNP working set. Individual experimental results are compared to the combined analysis for each of the three environments- b. LL_N, c. LL_S and d. UL_S, to detect seasonal variation between WS and DS, from centre of the plot- i. WS, ii. DS and iii. Combined analysis
Fig. 5 Circular manhattan plot and qq plot for Plant height (PH)- a. each of the six experiments (from centre of the plot- 1. lowland non-stress 2014WS (LL_N_WS); 2. lowland non-stress 2015DS (LL_N_DS); 3. lowland stress 2014WS (LL_S_WS); 4. lowland stress 2015DS (LL_S_DS); 5. upland stress 2014(UL_S_WS) and 6. upland stress 2015DS (UL_S_DS) for p-values obtained using Farm-CPU method at two significance thresholds of 1e-4 (blue) and 1e-6 (red). The outermost ring depicts the SNP distribution in the 215,250 SNP working set. Individual experimental results are compared to the combined analysis for each of the three environments- b. LL_N, c. LL_S and d. UL_S, to detect seasonal variation between WS and DS, from centre of the plot-i. WS, ii. DS and iii. Combined analysis
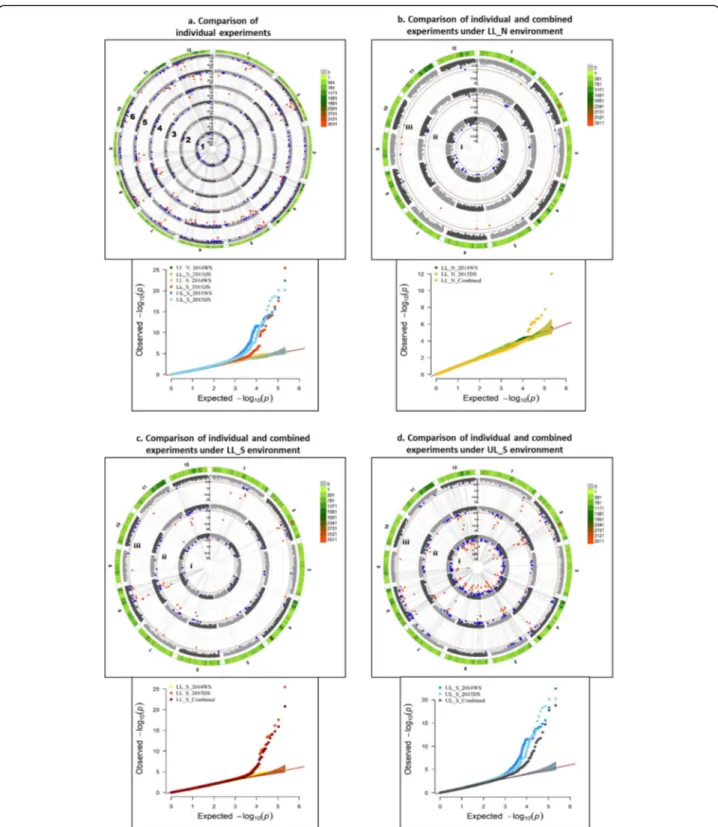
Fig. 6 Circular manhattan plot and qq plot for Grain yield (GY)- a. each of the six experiments (from centre of the plot- 1. lowland non-stress 2014WS (LL_N_WS); 2. lowland non-stress 2015DS (LL_N_DS); 3. lowland stress 2014WS (LL-S_WS); 4. lowland stress 2015DS (LL_S_DS); 5. upland stress 2014WS (UL_S_WS) and 6. upland stress 2015DS (UL_S_DS) for p-values obtained-using Farm-CPU method at two significance thresholds of 1e-4 (blue) and 1e-6 (red). The outermost ring depicts the SNP distribution in the 215,250 SNP working set. Individual experimental results are compared to the combined analysis for each of the three environments- b. LL_N, c. LL_S and d. UL_S, to detect seasonal variation between WS and DS, from centre of the plot-i. WS, ii. DS and iii. Combined analysis
Grain Yield under Drought in Different Environments as Selection Criterion for Promising Accessions to Develop High Yielding Drought Tolerant Varieties
Seven promising accessions viz. Aus 329, Aus 344, Chungur Bali, Dangar, Lalsaita, Para Nellu and Simul Khuri posses-sing better yield and yield related traits across different
seasons under lowland and upland stress in combination of the favourable allele for yield and yield related traits were identified using two parameters- phenotypic performance evaluated using DSI and yield advantage over checks, and genotypic profile characterised by presence of favourable al-leles contributing to high yield under drought.
Fig. 7 Circular manhattan plot and qq plot for Grain yield (GY) for- a. lowland non-stress 2014WS (LL_N_WS); b. lowland non-stress 2015DS (LL_N_DS); c. lowland stress 2014WS (LL_S_WS); d. lowland stress 2015DS (LL_S_DS); e. upland stress 2014WS (UL_S_WS); f. upland stress 2015DS (UL_S_DS) divided into two levels- subgroup level with i. aus lines and ii. indica lines and iii. comlpete diversity set of 280 lines for p-values obtained using Farm-CPU menthod at two significance thresholds of 1e-4 (blue) and 1e-6 (red). The outermost ring depicts the SNP distribution in the 215,250 SNP working set; to explore the effect of population structure in detection of significant marker trait associations
Table 3 Summary of candidate gene analysis for seven traits in different seasons and environments validated for genes and qDTY regions
Trait MTA/ QTL detected QTL span (Mb) SNP start (chrom_pos (bp))
SNP end (chrom_pos (bp))
Env Season Locus name (MSU 7.0) /
Drought QTL (qDTY) BMDW – – S2_17808669 S2_17808669 LL_N DS LOC_Os02g30270 BMDW qBMDW8–1 0.075 S8_00466752 S8_00541934 LL_S WS,DS – BMDW qBMDW-NBP9–1 2.021 S9_19316065 S9_20944019 LL_N WS,DS LOC_Os09g36290, LOC_Os09g36330 DTF qDTF6–1 0.138 S6_07611279 S6_07749410 LL_N WS,DS – DTF qDTF6–2 0.832 S6_09539728 S6_10,371,528 LL_N WS,DS – DTF – – S7_19,598,023 S7_19,598,023 LL_N WS LOC_Os07g32800 DTF – – S7_20,159,780 S7_20,159,780 LL_N DS LOC_Os07g32820 DTF – – S9_13934171 S9_13934171 LL_S DS qDTY9.1 DTF qDTF11–1 0.691 S11_06525213 S11_07215940 LL_S WS,DS – DTF – – S11_18836588 S11_18836588 LL_S DS LOC_Os11g31980 GY qGY1–1 0.351 S1_03473291 S1_03824622 LL_S,UL_S WS,DS – GY – – S1_24304274 S1_24304274 UL_S DS LOC_Os01g43450
GY qGY1–2 0.403 S1_39987434 S1_40390527 LL_S,UL_S WS,DS qDTY1.1
GY qGY2–1 4.271 S2_18794394 S2_23065933 UL_S WS,DS LOC_Os02g33620,
LOC_Os02g36190
GY qGY2–2 3.18 S2_25979458 S2_29167141 UL_S WS,DS qDTY2.3
GY – – S3_28646420 S3_28646420 UL_S WS LOC_Os03g49650 GY – – S4_01441702 S4_01441702 UL_S WS LOC_Os04g25400 GY – – S4_25920763 S4_25920763 LL_S DS LOC_Os04g37410 GY – – S4_31088649 S4_31088649 LL_S DS LOC_Os04g50150 GY qGY5–1 0.365 S5_04502747 S5_04505637 UL_S WS – GY – – S5_12494100 S5_12494100 UL_S WS LOC_Os05g20900 GY – – S5_19224697 S5_19224697 LL_S DS LOC_Os05g32660
GY qGY5–2 5.205 S5_24708194 S5_29913640 UL_S WS OsRPK1, OsCCaMK,
OsHAP3B, OsTPS1, OsSTN8
GY – – S6_06025083 S6_06025083 UL_S WS LOC_Os06g11540 GY – – S6_22794237 S6_22794237 UL_S WS LOC_Os06g37850 GY – – S6_23132086 S6_23132086 UL_S WS LOC_Os06g39690 GY – – S6_27655258 S6_27655258 UL_S WS LOC_Os06g47030 GY – – S6_31179920 S6_31179920 UL_S WS LOC_Os06g49910 GY – – S7_13019061 S7_13019061 UL_S DS LOC_Os07g23450 GY – – S7_16180595 S7_16180595 UL_S WS LOC_Os07g27900 GY – – S7_16181810 S7_16181810 UL_S WS GY – – S7_16183053 S7_16183053 UL_S WS GY – – S9_03032058 S9_03032058 UL_S WS LOC_Os09g06650 GY – – S9_05467194 S9_05467194 UL_S WS LOC_Os09g10300
GY – – S11_16248710 S11_16248710 UL_S WS qGP-11, qGI-11, yld11.1,
gpl11.1, gl11.1
GY – – S11_20668615 S11_20668615 UL_S WS LOC_Os11g35310
GY – – S11_21311326 S11_21311326 UL_S WS LOC_Os11g36200
GY – – S12_02835650 S12_02835650 UL_S DS LOC_Os12g06020
GY qGY12–1 0.941 S12_18165164 S12_19106346 UL_S WS,DS qDTY12.1
GY / HI qGY5–1 0.365 S5_04140355 S5_04266313 UL_S DS –
HI – – S2_24797737 S2_24797737 LL_N DS LOC_Os02g40920
Table 3 Summary of candidate gene analysis for seven traits in different seasons and environments validated for genes and qDTY regions (Continued)
Trait MTA/ QTL detected QTL span (Mb) SNP start (chrom_pos (bp))
SNP end (chrom_pos (bp))
Env Season Locus name (MSU 7.0) /
Drought QTL (qDTY) HI – – S5_05891992 S5_05891992 LL_N DS LOC_Os05g10700 HI – – S11_10053723 S11_10053723 UL_S DS LOC_Os11g18366 HI – – S11_10351950 S11_10351950 LL_N DS LOC_Os11g19230 HI – – S11_23022593 S11_23022593 LL_N DS – HI – – S12_23250434 S12_23250434 LL_N WS LOC_Os12g37850 NBP – – S1_37770897 S1_37770897 LL_N DS qDTY1.1 NBP qBMDW-NBP9–1 2.021 S9_20908000 S9_21337553 LL_N WS,DS – PH qPH1–1 0.982 S1_33,418,648 S1_34,400,345 LL_N, LL_S, UL_S WS,DS LOC_Os01g53670, LOC_Os01g59760 PH qPH1–2 1.085 S1_37,960,019 S1_39,044,781 LL_N, UL_S WS,DS qDTY1.1 PH – – S3_33,600,040 S3_33,600,040 LL_S WS LOC_Os03g58220 PH – – S3_33,600,989 S3_33,600,989 LL_S WS
PH – – S6_13439145 S6_13439145 LL_N WS OsPT9, OsPT1055,OsGLK1, nyc3
PH qPH9–1 2.731 S9_13,423,222 S9_16,154,337 LL_N,UL_S WS,DS qDTY9.1 PH – – S11_20,143,839 S11_20,143,839 LL_N DS LOC_Os11g34364 PH – – S11_22175365 S11_22175365 UL_S DS qGP-11,qGl-11, yld11.1, gpl11.1, gw11.1 SPKFT – – S6_28876857 S6_28876857 UL_S DS LOC_Os06g49060 SPKFT qSPKFT9–1 2.411 S9_09426722 S9_11838142 LL_N WS,DS –
Fig. 8 Genomic locations of 101 significant MTAs detected within a 200 kb window in reported genes and drought QTLs (qDTYs). Colored circles show the position of each MTA for 7 traits: Days to 50% flowering-DTF, Plant height-PH, Biomass-BMDW, Number of effective panicles-NBP, Grain yield-GY, Harvest index-HI and Spikelet fertility-SPKFT from each of the six experiments (lowland non stress-LL_N, lowland stress-LL_S and upland stress-UL_S) in the two seasons (WS and DS) and combined season analysis. Exact genomic locations are shown in Table S4
DSI estimated for each genotype based on six import-ant traits (DTF, PH, BMDW, GY, TGW and SPKFT) for each of the two stress conditions (LL_S and UL_S) in both WS and DS (6 traits * 2 stress conditions * 2 sea-sons) generated maximum of 24 DSI variables for each genotype used as selection criteria, to effectively deter-mine the most tolerant and susceptible genotypes (Add-itional file 1: Table S2). Significant variability in genotypes exhibiting drought tolerance and susceptibility under different growing conditions was observed. Twelve accessions with DSIs close to zero for at least 20 DSI variables for each genotype were identified, highlighted in green in Additional file 1: Table S2. Sub-sequently, yield advantage of these 12 selections com-puted against the traditional varieties used as checks in the experiments narrowed selections down to seven ac-cessions across environments and seasons. The grain yield improvement in these selected accessions ranged from 188 to 508 kg ha− 1 under lowland stress, to under 403 to 1645 kg ha− 1lowland non-stress and 846 to 1800 kg ha− 1 under upland stress over the best performing checks in DS (Table4).
Validation of phenotype-based selection performed using set of 101 (on 94 unique loci with 4 having co-localization for multiple traits) significant MTAs (vali-dated from database and earlier reported literature for grain yield QTLs) for DTF, PH and GY is presented in Fig.9a, b and c, respectively. Favorable alleles associated with DTF included major alleles in 45.74% loci contribut-ing to both LL_S and UL_S (Class I abbreviated hereby as cl-I), major alleles in 9.57% loci contributing to only UL_S (cl-II) and major alleles in 5.32% loci contributing to only LL_S (cl-III). Interestingly, among favorable minor alleles, 8.5% of loci contributed to DTF under both LL_S and
UL_S (cl-IV). Similarly, for PH, favorable alleles comprised 43.6%, 4.26%, 9.57% and 10.64% of 94 loci corresponding to classes I, II, III and IV, respectively while for GY, these figures were 36.17%, 7.45%, 5.32% and 12.7% for the four classes of loci respectively. The results imply that at least 44.67% loci (36.17% with major allele of the panel and 8.5% with minor allele of the panel) of the significant 94 loci can be useful in marker development, haplotype block construction for improving yield and yield related traits under both LL_S and UL_S; at least 4.26% of loci have fa-vorable alleles to target UL_S for trait-based breeding and at least 5.3% of loci from panel have alleles for improving trait performance under LL_S.
Additionally, each selected accession was validated for presence of favorable alleles by computing their percent composition in the set of 94 loci, corresponding to the four classes established (Additional file 1: Table S6). The selected accessions belong predominantly to aus genetic sub-group (Aus329, Aus344, Chungur Bali, Dangar, Lal-saita and Simul Khuri) while Para Nellu belongs to indica genetic sub-group. The percentage of favorable alleles in their genotypic profile varied from 60 to 70% (Fig. 9d) which establishes usefulness of phenotype-based selection which is validated by a moderate to high percentage of genotypic profile of each accession possessing favorable al-leles contributing to improved yield under RS drought.
Interestingly, about 38.29% of loci (cl-V) in the se-lected seven promising accessions did not contribute to high yield under drought (Fig.9c). Analysis of these loci in 12 most susceptible accessions (detected having ex-tremes of DSIs, highlighted in red in Additional file 1: Table S2) across lowland and upland stress environ-ments, established variable allelic contribution to suscep-tibility under RS drought. The 12 accessions were
Table 4 Selected promising accessions on basis of grain yield advantage across seasons and environments
S.No Taxa Name DTF PH GY
LL_N LL_N LL_S UL_S WS DS WS DS WS DS WS DS WS DS 1 AUS 329::IRGC 29116–1 89 83 114 116 1171 4966 616 313 975 1224 2 AUS 344::IRGC 29131–1 87 84 105 125 1379 4943 575 335 994 1907 3 CHUNGUR BALI::IRGC 25855–1 86 77 124 115 1083 7107 592 569 987 1537 4 DANGAR::IRGC 76296–1 86 75 125 105 1785 5865 592 569 980 1059 5 LALSAITA::IRGC 43915–1 88 83 109 112 3465 4899 590 451 965 1778 6 PARA NELLU::IRGC 50009–1 87 75 144 127 3719 5925 582 633 975 953 7 SIMUL KHURI::IRGC 35154–1 91 86 120 118 1174 4844 574 340 994 1399 Check1 IRRI 154 – 93 – 93 – 5462 – 7 – 65 Check2 MTU1010 – 93 – 94 – 4323 – 2 – 60 Check3 Sabitri – 90 – 101 – 3761 – 124 – 107 Trial Mean 90 89 114 109 1666 5214 573 158 942 336 LSD 1 2 3 3 140 280 82 32 100 62
divided into two categories, viz. Hodarawala, Eloni, Fei Gai 122, IR 75870–5–8-5-B-1, E-2024, Chandna (suscep-tible under different environments in DS only) and Muttu Samba, Race Perumal, Kalabail, Muta Ganje, Altamira-9 and Bak Tulsi (susceptible under different environments in both WS and DS). Validation of allelic contribution in these 12 susceptible accessions using 94 significant loci established a variable range of 19–33% loci with minor allele associated with low yield under drought, as depicted in the Fig.9c.
Discussion
Phenotypic Characterization under Different Environments
In both the environments i.e. lowland and upland and across seasons, the yields of the accessions were lower under reproductive stage drought stress compared to the control non-stress indicating the severity of the drought stress imposed. Numerous studies point towards negative relation between yield potential and yield under drought and this has been used to establish response indices under
different levels of stress severity (Raman et al. 2012; Kumar et al. 2014; Palanog et al. 2014). Positive correl-ation between moderate and severe stress response indices are informative of the genotypes with yield gain under all stress severities. In our study, different levels of stress se-verity were observed across seasons (Additional file 1: Table S1). Such differential levels of stress were useful in identifying the potential drought tolerant lines under vari-able growing environments. Verulkar et al. (2010) docu-mented that yield reduction under reproductive stage drought is significant even at moderate stress severity and even lower under severe stress. The premise to use indica-aus diversity panel in the study was to identify the donors/accessions that can be directly used in breeding programs targeting grain yield improvement under drought for South-Asian and South-East Asian region.
Effect of Trait Architecture for MTA Validation across Seasons and Environments
PV validation within the diversity panel in our study was affected by trait architecture and seasonal variation,
Fig. 9 Allelic variation at the significant GWAS-identified loci analysed to detect percentage composition of allelic profile in the selected 7 promising accessions based on presence of major or minor allele contibuting the phenotypic performance for tolerance under reproductive stage drought in lowland- LL_S and upland- UL_S in the two seasons for a. DTF; b. PH; c. GY. The five classes identified include three with loci where major allele present in all selected accessions contributed to trait mean under– LL_S + UL_S(cl-l); only UL_S (cl-ll) and only LL_S (cl-lll) while the fourth class comprises loci with minor allele present in selected accessions contributing to trait mean under both LL_S + UL_S(cl-IV). Class V (cl-V) comprises all the remaining loci out of the analysed 94, with neither major nor minor allele contributing to phenotypic performance for tolerance under drought in the selected accessions. The ClassV loci were analysed for contribution to low yield in 12 susceptible lines across LL_S and UL_S in either or both WS and DS. The variability in allelic variation for GY in the 12 susceptible accessions is depicted in the bar graph, divided in two categories-susceptible in both stress environments in DS only and in both seasons-WS and DS. d. Validation of selected accessions based on percentage of allelic variation contributing to grain yield under LL_S and UL_S- loci with favorable allele in each the selected
accessions is divided along the first four classes and loci with unfavourable allele in each acession is represented by class V. The cumulative favourable allelic percentage of each accession associated with higher yield under drought is depicted by the percentage value mentioned on top of the bar columns. Details for loci associated with GY are mentioned in Table S6
where for example the range of variance captured by Farm-CPU is narrow for simple quantitative traits like flowering time (0.15–0.52) and plant height (0.34–0.63) as compared to that for a complex quantitative trait like GY with range of 0.02–0.55. In our study, the correlation among the two seasons (DS and WS) is of lower magni-tude which warrants the variable PV for traits across seasons. Our results draw similar interpretations with re-cent studies that conclude the effectiveness of multi-locus methods, especially Farm-CPU over single-multi-locus methods (like MLM) for association analysis of traits with either high or low heritability by adequately con-trolling false positives and negatives, indicated by sharp deviations observed for p-value distribution in qq plots (Xu et al.2018; Kaler and Purcell2019).
The significant and positive correlation among grain yield and other agronomic traits except for DTF and the colocation of MTAs associated with these traits indicates the contribution of grain yield related traits in contribut-ing to yield improvement under drought stress. Most of the important economic traits such as grain yield, grain quality, biotic and abiotic stresses in different crop spe-cies are polygenic in nature. These complex quantitative traits being the focal for the breeding programs, genome wide analysis has proven to be advantageous in captur-ing the genetic variance of the diverse germplasm, subsequently contributing to improving crop productiv-ity. Identification of marker-trait associations, QTLs, haplotypes, candidate genes and the functional characterization of the identified candidate genes under-lying QTLs/genes will help plant breeders to design and develop drought tolerant rice varieties. In the present study, among the detected significant marker-trait asso-ciations, some were novel while the others were located near or co-located with the previously reported genes/ QTLs.
Recently, GWAS studies conducted on 180 Vietnam-ese rice landraces identified a total of 17 QTLs associ-ated with vegetative stage drought tolerance under greenhouse conditions (Hoang et al.2019). Different sig-nificant MTAs in the two subpanels of the study, indica and japonica were detected using mixed model approach with structure control and kinship among the studied landraces. GWAS performed by Subedi et al. (2019) re-ported 37 highly significant MTAs for 20 traits including plant and root morphological traits, nutrient uptake, yield and its components in MAGIC population of 5 di-verse parents for increased adaptability in dry direct seeded rice (DDSR) system.
MAS Optimization Based on Significant Genomic Regions Identified
The QTLs; qGY1–2 and qPH1–2 and the MTAs (S1_
37770897 for NBP) mapped on chromosome 1; qGY2–2
on chromosome 2; qPH9–1 and qSPKFT9–1 on
chromo-some 9 and qGY12–1 mapped on chromosome 12 in
both the years and environments were located near the earlier reported major grain yield QTLs namely qDTY1.1,
qDTY2.3, qDTY9.1 and qDTY12.1 respectively (Table 3).
These findings indicate the consistency of the effects of drought grain yield QTLs across diverse germplasm. It is important to take note here that the qDTY1.1 was
re-ported to have significant effect on the grain yield under control non-stress and reproductive stage drought stress in different genetic backgrounds such as Swarna, IR64, MTU1010 under lowland and upland environments (Vikram et al. 2011; Sandhu et al. 2014; Sandhu et al.
2015). The qGY2–1 and qGY2–2 reported in the present
study were found to be present in the upstream and downstream region of earlier reported qDTY2.3,
respect-ively (Sandhu et al. 2014; Palanog et al.2014). Interest-ingly, the qGY5–2 reported in the present study was
located near the earlier reported genes OsRPK1 gene (Chen et al. 2013 for root development), OsCCaMK (Bao et al. 2014 for microbial symbiosis), OsHAP3B, OsTPS1 (Miyoshi et al. 2003 for chloroplast biogenesis), OsSTN8 (Nath et al. 2013) for protein phosphorylation of photosystem II) and MTAs for nutrient uptake (Sandhu et al. 2019). The colocation of identified QTLs in the present study with the earlier reported genes for root development, photosynthetic traits, and the stress-responsive genes further indicate the complex nature of grain yield traits in addition to the contribution of these traits/genomic regions in enhancing yield under drought. After validation, the identified significant marker-trait associations and the selected promising accessions pos-sessing the QTLs/MTAs could be used further in GAB program. The seven selected accessions from this panel may provide novel donors in developing drought toler-ant rice varieties for variable growing environment.
Research Prospective for Breeders
Diversity panels are a valuable source for exploiting gen-etic variation to potentially raise gengen-etic gain in an inte-grative pre-breeding approach. Association studies help in detecting genetic variants associated with agronomi-cally important traits and identifying underlying candi-date genes and establishing haplotypes to accelerate development of climate-smart cultivars. In our present study, we detected 94 significant loci associated with 38 genes and 4 major grain yield QTLs. Analysing pheno-typic performances of various haplotype combinations of these in post-GWAS study and functional characterization of candidate gene expressions can help ascertain superior haplotype combinations for improved grain yield under RS drought in different ecosystems. Exploiting such superior performance haplotypes in dif-ferent genetic backgrounds; detecting presence of such
multiple haplotypes in accessions can aid genomic selec-tion for tailoring development of high-yielding climate-smart varieties. The seven accessions selected based on grain yield and analysed for allelic variation, can serve as potential donors for improving yield under reproductive-stage drought in different ecosystems, as favourable alleles contributing to yield under drought comprised 60–70% genotypic profile in significant loci. Moreover, these selected accessions belong to aus and indica genetic backgrounds, hence can be exploited to identify consistent, superior haplotypes for yield and yield related traits with potential to strengthen rice pro-duction by deployment of tailored climate-smart varieties.
Conclusions
The diverse indica-aus panel possessing wide range of phenotypic variability combined with the already avail-able genomic information was exploited to identify the MTAs/QTLs associated with grain yield improvement under reproductive stage drought. A total of 219 signifi-cant MTAs were detected in the present study. Candi-date gene analysis within 200 kb window centred from GWAS identified SNP peaks detected 101 of these MTAs within/ in close proximity to 38 reported genes, 4 earlier reported major grain yield QTLs and 6 novel QTLs for 7 traits. Two QTLs each for plant height and grain yield showed consistent effect across seasons and environments under both control non-stress and stress conditions. The significant positive correlation of the grain yield with grain yield related traits was further con-firmed with the colocation of QTLs/MTAs associated with these traits. The introgression of the identified QTLs into elite genetic background, functional characterization of candidate genes identified in or near QTLs regions would be the next step in improving grain yield of rice under reproductive stage drought stress conditions. The identified promising accessions may serve as novel donors in drought breeding program tar-geting grain yield improvement.
Methods
Plant Material and Genotypic Data
The study used data evaluated for a diverse indica-aus rice panel of 280 accessions, of which 245 represent the four major genetic subgroups belonging to indica gen-etic background and 35 to aus gengen-etic background (Additional file 1: Table S7). They were selected from the 3000 accessions recently re-sequenced within the framework of the Rice Genome Project (Li et al. 2014), for their potential to breeding programs targeting rainfed lowland and upland drought environments in South and South-East Asia. In the selected panel, 215 accessions are landraces originating mainly from Asia
and 65 accessions are improved lines. Seeds of the acces-sions were obtained from the IRRI gene bank.
The genotypic data for the 280 accessions were ob-tained from the International Rice Informatics Consor-tium (IRIC) database for the 3000 rice genomes project (http://oryzasnp.org/iric-portal). The raw genotypic data extracted from the database contained 962 k SNPs. The filtering for missing data (≤ 20%), minor allele frequency (MAF)≥ 2% and rate of heterozygosity (Ho) ≤ 5% led to a working set of 215,250 SNPs, referred to as 215 k set. This panel and the associated genotypic data were previ-ously described in Bhandari et al. (2019).
Phenotyping of Population
Experimental Design and Crop Management
Six experiments (Additional file 1: Table S1) were con-ducted in the 2014 wet season (WS) and 2015 dry sea-son (DS) at IRRI (14.18°N, 121.25°E), Philippines. In each season, the experiment was conducted under control conditions or non-stress experiment (LL_N) in lowland (under flooded, puddled, transplanted and an-aerobic conditions) while the reproductive-stage drought-stress experiments were conducted in lowland and upland (under direct-sown, puddled, non-flooded and aerobic conditions in leveled fields) environments, referred as LL_S and UL_S, respectively. The LL_N experiments were established in augmented randomized complete block design in single-row plots with 5 m row length. The LL_S and UL_S experiments were established in a α-lattice design with two replica-tions in single or two-row plots with 5 m row length in lowland and 2–3 m row length in upland. The crop management practices were as described in Kumar et al. (2014).
Drought Application Procedure
RS-drought phenotyping was as described in Kumar et al. (2014). Briefly, in the LL_S experiments, the field was drained 30 days after transplantation and irrigation was withheld to impose the RS-drought stress. Stress was continued until severe leaf rolling was observed in at least 75% of the accessions and water table depth remained below 100 cm for more than 2 weeks. Fields were thereafter re-irrigated (flash-flooding -WS and sprinklers - DS) and the water was drained after 24 h to impose a subsequent cycle of drought stress. This cyclic pattern was implemented until harvest. In the UL_S ex-periments, where the crop was established by direct-seeding, RS-drought stress was initiated 45 days after sowing, by withholding sprinkler irrigation until the soil water tension fell below− 50 kPa at 30 cm depth. There-after, sprinkler-irrigation and subsequent drainage after 24 h for the imposition of drought stress were done in a cyclic pattern till harvest.
Traits Measured
For each experiment, days to 50% flowering (DTF, in days), plant height (PH, in cm, the average for 3 mea-surements per plot), panicle length (PL, in cm, the average for 3 measurements per plot), flag leaf area (FlgLA, in cm2, the average for 3 measurements per plot), dry biomass at maturity (BMDW, in kg ha− 1), number of effective panicles (NBP), grain yield (GY, in kg ha− 1), 1000-grain weight (TGW, in g) and spikelet fertility (SPKFT, in percentage) were mea-sured in individual plots and harvest index (HI) was calculated as GY/BMDW. Details of measurement procedures of each trait are given in Additional file 1: Table S8.
Analysis of Phenotypic Data for each Trait
For each trait from each of the six experiments, best lin-ear unbiased predictors (BLUP) were estimated using the restriction maximum likelihood method (REML) in the PROC MIXED procedure of SAS v9.0 (Statistical Analysis Systems 2002). Within a season, the perform-ance of a genotype was modeled as Yij= μ + ßi+ cj+ αi+
εij for augmented randomized complete block design
where Yij is the phenotype of the ith genotype in jth
block, μ the overall mean, ßithe block effect which was
considered as random, cj the checks effect in jth block
which was considered as fixed, αi the random effect of
the ith genotype and εij is the residual considered as a
random effect. We constructed two variables- “checks” and “genotypes” variables in both WS and DS. Checks refer to the control genotypes included additionally in the experiment to compare the performance of geno-types being tested and were used to recover the block ef-fects. For α-lattice design, genotype performance was modeled as Yijk = μ + αi + rj+ bkj+ εijk where Yijk is the
phenotype of the ithgenotype in kthblock of jthreplicate, μ the overall mean, αi is the genotype effect considered
as random, rj is the replicate effect considered as fixed,
bkjis the random effect of the kthblock within jth
repli-cate and εijk is the residual considered as a random
effect.
The variance components were estimated using the REML method to extract Yadj(μ + Yij(k)) values for each
genotype which were used in GWAS for analysis at both individual experiment level and combined analysis for each environment- lowland non-stress, lowland stress, and upland stress, to detect genomic regions associated with traits of interest. For each of the studied trait, the broad-sense heritability was estimated using the formula
H2¼ σ2g=σ2p
whereσ2gis the genotypic variance obtained from the
experimental data (assuming only additive genetic
variance among accessions) and the phenotypic variance isσ2p=σ2g+σ2e/r, whereσ2eis the residual variance
ob-tained from the ANOVA and r is the number of replication.
The corrplot package in R (R. v.1.2.5001) (Wei and Simko2017) was used to estimate the correlation among the measured traits.
The drought susceptibility index (DSI) was calculated for DTF, PH, BMDW, GY, TGW and SPKFT. Drought intensity (DI) was calculated according to (Lazar et al.
1995) as
follows-DI¼ 1 - YD=YN
Where YDis the average all genotypes for a given trait
under drought stress, while, the YN is the average of all
genotypes for the same trait under normal condition. The drought susceptibility index (DSI) was estimated for each genotype and calculated according to (Lazar et al.
1995) as
follows-DSI¼1‐XD=XN DI
Where XD is the mean performance of each genotype
for a given trait under drought stress, while, the XN is
the mean performance of each genotype for the same trait under normal condition.
Methods for Characterizing the Population Experimental Evaluation
Multi-dimensional analysis of the phenotypic data by FDA was performed on phenotypic data (280 acces-sions × 10 trait variables × 6 experiments) to estimate the pairwise Fisher distance between the experiments using the XLSTAT package [Internet] 2012. (http:// www.xlstat.com/en/products-solutions/pro.html)
XLSTAT (2012). Using mean grain yield as criterion, each experiment was re-classified based on the grain yield reduction compared to the control-lowland-non-stress experiment (Kumar et al.2009) (Additional file 1: Table S1).
Genetic Structure
The genetic diversity among the 280 accessions was studied with the working set of 215 k markers using the Neighbor-joining (NJ) clustering method in TASSEL 5 (Bradbury et al. 2007) and visualization using FigTree v1.4.3 (Rambaut and Drummond 2016). The population structure was assessed using ADMIXTURE v.1.3.0 (Alexander et al. 2009) and results visualized using R/ pophelper (Francis2017) package for 280 accessions and 215 k SNPs. Series of models for K value ranging from 2 to 8 were run with 5 fold cross-validation to prime the main algorithm- QuasiNewton for convergence
acceleration. Accuracy and precision were ensured by performing 20 runs for each value of K and the optimal number of clusters was determined by the K value with the least cross-validation (CV) error. Principal compo-nents (PC) explaining genetic variation were estimated using R/GAPIT 3.0 package (Lipka et al.2012). The esti-mated population structure covariates (Q) and kinship matrix (K) were used to improve the statistical power of the GWAS models used.
Pairwise Linkage Disequilibrium (LD)
LD between SNP loci at the individual chromosomal level was calculated and plotted by computing r2 estima-tors between all pairs of SNP markers using the PopLD-decay (Zhang et al.2019).
Methods for Identifying Associations at the Population Level
In our study, we implemented GWAS with MLM, SUPER and Farm-CPU methods using R/GAPIT 3.0 package and visualization of circular manhattan and qq plots using rMVP package (0.99.17) (https://github.com/ xiaolei-lab/rMVP)(R/MVP package 2019). The false pos-itives in GWAS study were corrected using“Bonferroni Correction” factor. Using the Bonferroni multiple test correction (0.05/215,250; at 5% level of significance), the calculated threshold value was 2.32 × 10− 7. Only the MTAs that exceed the threshold value and which were consistent across multi-locus methods- SUPER and Farm-CPU methods have been reported in this study. To detect seasonal variations, we explored two p-value thresholds (1e-6 and 1e-4).
The percent phenotypic variance (PV) explained by all significant SNPs detected in each environment and sea-son was output from all models used in the study. PV explained by each significant SNP was calculated as the squared correlation between the phenotype and geno-type of the SNP.
Candidate Genes Discovery
The candidate genes were searched within the 200-kb region around (100 kb upstream and 100 kb down-stream) the detected significant SNP. The literature searches were also performed using QTARO and MSU databases (http://qtaro.abr.affrc.go.jp (QTARO database
2019) and http://rice.plantbiology.msu.edu (MSU data-base2019)) to identify the earlier reported QTLs present in the LD region.
Selection of Accessions as Potential Donors in Breeding Programs
Promising accessions were selected from the population based on yield advantage over non-stress condition in WS for both lowland and upland stress environments
and over checks in each environment in DS. The prem-ise was to identify a set of accessions that can be incor-porated in breeding programs for drought tolerance under both lowland and upland environments with the advantage of early flowering and short plant type under RS drought.
These selected accessions were analyzed for allelic ef-fect using 101 (on 94 unique loci with 4 having colocali-sation for multiple traits) significant MTAs validated from database and earlier reported literature for grain yield QTLs. Allelic variation was studied for effect of al-lelic contribution to trait mean for DTF, PH and GY under LL_S and UL_S in both seasons. Five classes of loci were established– three based on presence of major allele in all seven accessions contributing to phenotypic performance for tolerance under LL_S + UL_S (class I abbreviated as cl-I); under UL_S only (class II abbrevi-ated as cl-II) and under LL_S only (class III abbreviabbrevi-ated as cl-III) while the fourth class (cl-IV) contained loci with minor allele associated to phenotypic performance for tolerance under both LL_S + UL_S. The fifth class (cl-V) consisted of loci with neither the major nor minor allele associated to phenotypic performance for tolerance under RS drought in the selected accessions. Further, validation of phenotypic-based selection of each acces-sion was done by computing the percentage composition of favorable alleles in the set of 94 loci.
Supplementary information
Supplementary information accompanies this paper athttps://doi.org/10. 1186/s12284-020-00406-3.
Additional file 1. Table S1. Field experiments conducted at IRRI, Philippines between the 2014 wet season and 2015 dry season. Table S2. Drought susceptibility index (DSI) calculated for each genotype for the four stress experiments for selected traits (with green for tolerance and red for susceptibility). Table S3. Characterization of the marker set of 215,250 SNPs. Table S4. Significant MTAs detected for ten traits in the population and the gene validation results. Table S5. Yadj. values used for GWAS of the ten traits measured for the 280 diverse set in three environments and two seasons. Table S6. Allelic variation at the GWAS-identified significant loci in the selected 7 accessions for grain yield under lowland and upland drought. Table S7. Details of the 280 diversity panel accessions. Table S8. Description of phenotypic data recording. Figure S1. Projection of 280 lines of the indica-aus diversity panel on the first plane of factorial discriminant analysis using phenotypic data for ten traits. Figure S2. Plots of Pearson’s r-values showing correlation between each of the six experiments (LL_N_WS– lowland non-stress 2014WS, LL_S_DS– lowland non-stress 2015DS, LL_S_WS – lowland stress 2014WS, LL_S_DS– lowland stress 2015DS, UL_S_WS – upland stress 2014WS and UL_S_DS– upland stress 2015DS) at trait level for all the ten phenotypic variables. Figure S3. Heat map showing the uneven marker distribution along each of the 12 chromosomes using the 215,250 SNP working set. Figure S4. Pattern of rapid decay in linkage disequilibrium decay in the population of 280 accessions genotyped with 215,250 SNPs. Figure S5. Circular manhattan plots and qq-plots for each of the 6 ex-periments and comparison of season-wise analysis to combined analysis for each of the 3 growing environments for a. PL, b. FlgLA, c. BMDW, d. NBP, e. HI, f. TGW and g. SPKFT.