AT SEISMIC FREQUENCIES
by
HERMAN WILLIAM COOPER
B.Sc., Queen's University at Kingston (1973)
M.Sc., Queen's University at Kingston (1975)
SUBMITTED IN PARTIAL FULFILLMENT OF THE REQUIREMENTS FOR THE
DEGREE OF
DOCTOR OF PHILOSOPHY at the
0 MASSACHUSETTS INSTITUTE OF TECHNOLOGY August 1979
//7
Signature of Author... ... Department of Ear4h and Planetayy Sciences, August 28, 1979
Certified by.. . . --- ... ... ...
/1
Thesis SupervisorAccepted by. -. ... --... ...
Chairmanp pardeym - tee on Graduate Students
rK MASSACHUSETTS NI
indgref
ATTENUATION IN IGNEOUS ROCKS AT SEISMIC FREQUENCIES
by
Herman William Cooper
Submitted to the Department of Earth and Planetary Sciences August 28, 1979, in partial fulfillment of the requirements
for the degree of Doctor of Philosophy.
ABSTRACT
Torsional attenuation measurements have been made on a set of igneous rocks at frequencies between 0.5 and 3.5 Hz under room dry and saturated conditions. Empirical relations between the specific dissipation factor Q-1 and crack
poros-ity, nc, of the rocks were found: Q-1 = 0.17IV c ±30% for the room dry rocks, and Q-1 = 0.39V/c ±40% for the saturated rocks. A model of attenuation due to friction on crack
surfaces lubri ated by thin films of adsorbed water is pre-sented that ca qualitatively account for the attenuation in nominally dry ocks and the effects of confining pressure, temperature, v cuum, and strain amplitude. A crack density and crack aspe t ratio distribution for Westerly granite is used to show t- at a model of fluid flow between cracks, or squirt flow, cin adequately account for the attenuation in saturated rocko at frequencies between 1 and 105 Hz. Attenu-ation mechanis s associated with cracks are important in the earth only in he upper 10 to 20 km. Inversions of surface wave attenuati n data show that Q-1 of the crust under
North America ]etween 20 and 40 km is approximately 10
-consistent wit laboratory measurements on essentially crack free rocks. A era e crack porosities between 20 and 200x 10- 6 can explain the Q-i of the upper 20 km of the crust.
ACKNOWLEDGEMENTS
I would like to express my gratitude to my advisor, Professor Gene Simmons, who proposed the topic of research amd made many helpful comments and suggestions during the preparation of this thesis.
During my first year at MIT I was supported by a Sloan Research Traineeship. This research was supported by the Division of Earth Sciences, National Science Foundation Grant 76-22130 EAR.
CONTENTS
1. INTRODUCTION
1.1 Objectives . . . . . . . . . . . . . . . . . . . . 12
1.2 Measures of attenuation . . . ... 12
1.3 Previous experimental work . ... 14
1.4 Theory ... ... . . . . 25
2. ATTENUATION DUE TO FRICTION IN CRACKS 2.1 Introduction ... . .. . .. ... .... ... . 29
2.2 Summary of Walsh's model of attenuation in rock due to friction . ... .... .... 30
2.3 Criticism of the frictional attenuation model . . 31
2.4 Occurrence of water in rocks .. . ... 35
2.5 Boundary lubrication . ... 43
2.6 A model of attenuation based on friction in cracks lubricated with water . ... o . ... ... 46
2.7 Summary ... . ... ... . 48
3. MATERIALS AND PROCEDURES 3.1 Samples .. . ... . . 50
3.2 Apparatus . . . ... . . . 50
3.3 Procedures . .... ... ... 59
3.4 Error analysis ... ... . ... 66
4. RESULTS 4.1 Attenuation in eighteen igneous rocks ... 68
4.2 Attenuation in thermally cycled rocks .... . . 72
4.3 Anisotropy of attenuation . . ... 73 4.4 Effect of temperature on Q-1 . . . . . . ... 81 4.5 Effect of frequency on Q-1 ... 86 4.6 Effect of amplitude on Q- ... 86 5. DISCUSSION 5.1 Dry rocks . ... . . 92 5.2 Saturated rocks ... ... 97
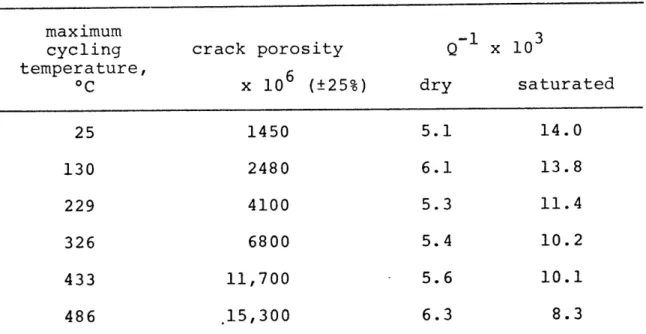
5.3 Thermally cycled rocks ... 104
5.6 Implications for the earth . . . . . . 6. CONCLUSION S. . 110 117 118 REFERENCES
Appendix A. TORSION OF A CYLINDER . . . . . 125
Appendix B. DETERMINATION OF AMPLITUDE
DEPENDENT Q FROM TORSIONAL OSCILLATIONS . . . . Appendix C. SHEAR MODULI OF SOME OF THE SAMPLES .
GLOSSARY . . . . . . . . . . . . . . . . . . . . .
131
134 139
TABLES
2.1. Effect of temperature on adsorbed water
thickness on glass wool . ... 36 2.2. Effect of relative humidity on adsorbed
water thickness . ... . .. .. . . . 37 3.1. Sample locations and physical properties . . .. 51 3.2. Modal analysis ... . 52 4.1. Attenuation of dry and saturated rocks . ... . 69 4.2. Attenuation of thermally cycled
Westerly granite . ... . . 74 4.3. Attenuation of thermally cycled
Frederick diabase . . ... . ... 77 4.4. Anisotropy of attenuation in Westerly
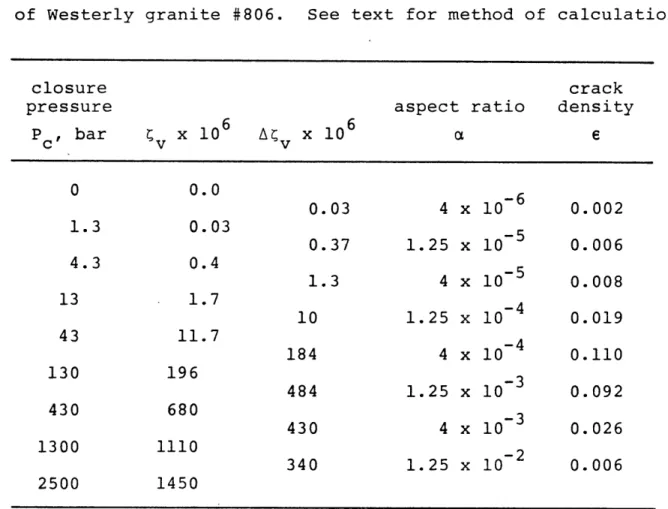
granite and Chelmsford granite . ... 80 5.1. Crack density versus aspect ratio
distribution of Westerly granite . ... 100 -i
5.2. Regional variation of Q-1 of the crust and interpretation as regional
variation in crack porosity .. . . . ... 113 C.1. Shear modulus of sample 1401 as a
func'.ion of temperature . ... 135 C.2. Shear modulus of sample 1407, Middlebrook
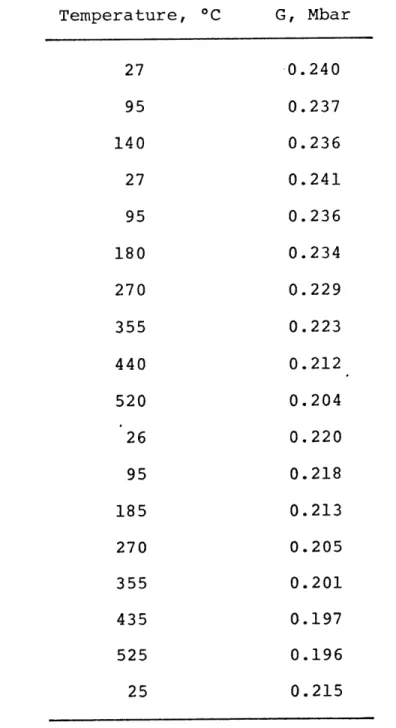
felsite, as a function of temperature . ... 136 C.3. Shear modulus and crack density of
1.1. Variation of the ratio Q-1 saturated
to Q-1 dry with frequency . .. ... 17 1.2. Variation of extensional decrements
of a Berea sandstone with overburden
pressure at fixed water saturations . ... 20 1.3. Variation of Q-1 with temperature. . . . . . . 24
-i
2.1. Relationship between Q , friction coefficient 1, and material constants
for longitudinal and transverse waves . ... 33 2.2. Capillary and adsorbed water in a crack .. . . . 40 3.1. Schematic of the apparatus ... . . . . . 55 3.2. Schematic of the recording system ... . 57 3.3. Schematic of the furnace and sample
arrangement for attenuation measurements
at elevated temperatures . . . . . . . . . . . . 62 3.4. Temperature profiles in the furnace . ... 65 4.1. Q-1 of dry and saturated rocks . . . . . . . . . 71
-1
4.2. Q- of thermally cycled Westerly granite . . . . 76 4.3. Q-1 of thermally cycled Frederick diabase . . . . 79 4.4. Variation of Q-1 with temperature
for sample 1-401 . . . 83 4.5. Variation of Q-1 with temperature
for Middlebrook felsite . ... . . . .. ... .. 85 4.6. Variation of Q-1 with frequency . ... 88 4.7. Variation of Q-1 with strain amplitude ... 90 5.1. Variation of crack density
5.2. Predicted variation of Q of saturated Westerly granite
with frequency ... .. 103 A.l. Torsion of a cylinder . ... .... . . . . . . . 127 A.2. Cross section of a cylinder in torsion . . ... 127
Symbols used only in Sec. 1.2 are not listed a half-length, or radius of a crack
a sample radius
a fraction of contact area S consisting of solid to solid contacts
A oscillation amplitude A area of a crack
c half-width of a crack c4 4, c5 5' c6 6 elastic moduli
E Young's modulus of rock matrix
E effective Young's modulus of rock containing cracks F friction force
G shear modulus
Seffective shear modulus of rock containing cracks J moment of inertia
K bulk modulus
K torsional stiffness of cylinder L sample length
M molecular weight N twisting couple
N number of cracks per unit volume p vapour pressure
P perimeter of a crack Pc crack closure pressure P yield stress
-i
Q-1 specific dissipation factor
-1 -1
Q Q for shear waves
-1 -1
QpI Q for compressional waves
rm mean radius of curvature of a liquid surface R universal gas constant
s4 4' s55' s66 elastic compliances
s shear strength of solid junctions
s shear strength of boundary lubricant film S area of real contact between surfaces S. strain components 1 T temperature T. stress components 1 Ul, u2, u3 displacements v volume of a crack w crack width
W stored elastic energy AW energy loss per cycle
W load
Xl, x2' x3 coordinates
z thickness of adsorbed water layer
a crack aspect ratio 8 compressibility
effective compressibility of rock containing cracks y surface tension
6 angle
E.. strain components e crack density
e' density of cracks contributing to friction
linear strain attributable to the closure of cracks Cv volumetric strain attributable to crack closure 'n fluid viscosity
nc crack porosity 0 angle of rotation
8c contact angle between a liquid and a solid
c coefficient of friction
Ps coefficient of dry friction
coefficient of friction when load is totally supported by lubricant film
v Poisson's ratio of rock matrix
V effective Poisson's ratio of rock containing cracks p fluid density
a normal stress acting on crack
shear stress in the plane of a crack
7T relaxation time for equalization of fluid pressure differences between cracks
T2 relaxation time for shear relaxation in pore fluid function describing the warping of the cross section of a cylinder in torsion
twist per unit length W angular frequency
Chapter 1
INTRODUCTION
1.1 Objectives
The objectives of this work are:
1. To aid in understanding the mechanisms that cause seismic attenuation in rocks at temperatures and pressures corresponding to conditions in the upper crust of the earth. Much theoretical work has been done on the effects of cracks
on attenuation, but few data have been available for rocks with well known crack characteristics.
2. To provide a set of data on cracked rocks to aid in the interpretation of seismic attenuation data. Detailed inversions of surface wave attenuation have shown that there
-1
are regional variations in Q-1 of the crust (Mitchell 1975, Canas and Mitchell 1978, Lee and Solomon 1979). The varia-tions are probably due to regional differences in crack content or saturation.
1.2 Measures of attenuation
Several measures of attenuation are in general use. The one used here is Q-1 , sometimes called the specific
dissipation factor. Its inverse, the seismic quality factor Q, used in earthquake seismology literature, is defined for a sinusoidal oscillation or travelling wave as
Q
2W AW (1.1)where W is the maximum value of the elastic energy stored during a cycle and AW is the energy dissipated per cycle. From laboratory measurements, Q-1 can be defined either by
the forced vibration method as
Q- Af (1.2)
f
n
where Af is the frequency width at half power of the
resonance peak at frequency f n; or from the decay of free vibrations, as in this work, as
-1 1 dlnA
0 d (1.3)
= f dt
where f is the frequency and A is the amplitude of the
vibration. Also used for free vibration measurements is the log decrement
in (A1 /A2) (t 2-t 1 ) f
where Al and A2 are the amplitudes of the vibration at times
tl and t 2 . Comparing (1.3) with (1.4), we see that Q- = /7r. For small values of Q-1 (<10-1 ), that is, Q > 10, the
definitions (1.1), (1.2), and (1.3) are equivalent. The parameter used in wave propagation measurements is the
attenuation coefficient a (y is also used). For a plane wave,
In(A 1/A2)
a= (1.5)
x2 - x1
where Al and A2 are the amplitudes of the wave at distances
-1
Q-1 _v (1.6) Trrf
where v is the phase velocity of the wave. For a more
detailed discussion of the various measures of attenuation, the experimental methods used to measure them, and their use in phenomological theories of anelastic behaviour, see
Nowick and Berry (1972) and O'Connell and Budiansky (1978).
1.3 Previous experimental work
The following generalizations about attenuation in rocks can be made from the data reported in various studies, as has been pointed out by several authors (Knopoff 1964, Bradley and Fort 1966, Johnston et al 1979):
Frequency dependence. Q-1 has been found to be independent of frequency in dry rocks by many investigators:
1. between 10- 3 and 6 x 10- 2 Hz for a granite and a quartzite (Gordon and Davis 1968);
-3
2. between 10- 3 and 0.5 Hz for a granite and a diabase (Brennan and Stacey 1977);
3. between 40 and 120 Hz for six igneous and sedimentary rocks, with perhaps a 10% increase between 40 and 70 Hz (Bruckshaw and Mahanta 1954);
4. between 20 and 125 Hz for shear waves and between 50 and 450 Hz for compressional waves by field measure-ments in Pierre shale (McDonal et al 1958);
5. between 1 kHz and 10 kHz for shale and sandstone (Born 1941); and
(Knopoff and Porter 1963).
For fluid filled rocks fewer data are available. Born (1941) found that in Amherst sandstone containing 0.25% and 0.4% water by volume, Q-1 increased linearly with
frequency between 600 and 1700 Hz. In contrast, Hamilton -l1
(1972) found a constant Q-1 between 3.5 kHz and 100 kHz from field measurements of compressional waves in marine sediments. A variation of Q-1 with frequency in saturated rocks is
expected from fluid flow models of attenuation. A comparison of data at various single frequencies by several workers
-i
confirms this expectation. The ratios of Q-1 for saturated and dry rocks from Gardner et al (1964), Gordon and Davis
(1968), Winkler and Nur (1979), and Toksoz et al (1979) are plotted in Fig. 1.1. If we assume that Q-1 for dry rocks is
-l
constant, then Q-1 for saturated rocks increases from the dry value at very low frequencies, reaches a peak between 103 and 105 Hz, then decreases again. The scatter may be due to differences in rock type, crack and pore porosity and geometry, amplitude of signals, and type of measurement. Gardner et al (1964) and Winkler and Nur (1979) found a
larger ratio of Q-1 saturated to dry for extensional vibrations than for torsional vibrations in sandstones.
Effect of fluid. As shown in Fig. 1.1, the addition of
fluid to a rock increases Q-1 except at very low frequencies. The amount of increase in Q-1 depends on the frequency and also on the degree of saturation. Gardner et al (1964)
observed that most of the increase in Q-1 as fluid was added observed that most of the increase in Q as fluid was added
Fig. 1.1. Variation of the ratio Q-1 saturated to Q-1 dry with frequency. Sources of the data: 0, O Gardner et al (1964); A Gordon and Davis (1968); E, Q Winkler and Nur (1979);
*,
O Toksoz et al (1979); V this study. Filled symbols are measurements of shear oscillations or S waves; open symbols are measurements of extensional oscillations or P waves.8 I I1 r8 I 6 - 0 -1 Osaturated 0-14 Odry 20 -2 0 2 4 6 log (frequency, Hz)
to Berea sandstone occurred between saturations of 2% and 11% (see Fig. 1.2). Winkler and Nur (1979) observed that as saturation was changed from 95% to 100% in Massilon sandstone, Q-1 increased slightly for torsional vibrations but decreased slightly for extensional vibrations. Johnston (1978) found no significant difference in Q-1 between fully saturated and 37% saturated Berea sandstone for both shear and compressional
-i waves, and in a gas release experiment found that Q for
-1
compressional waves, Qp, increased slightly as a few percent -I
gas bubbles were released into the pore fluid, but Q for -l
shear waves, Q , remained constant. Frisillo and Stewart -1
(1979) found that Q in Berea sandstone was greatest at a fluid saturation of 65%.
The viscosity of the fluid also has an effect on attenuation. Gordon and Davis (1964) found no significant difference in Q-1 between dry and water saturated granite
at 1.4 x 10- 2 Hz, but granite saturated with glycerine had a
-i -3 -2
higher, frequency dependent Q between 10 and 1.4 x 10 Hz. By changing the temperature, Nur and Simmons (1969) varied
the viscosity of glycerol saturating Barre granite. At -1
500 kHz they found a peak in QS at a viscosity of
approxi--1
mately 0.2 poise, but no significant variation in Qp .
Gordon (1974) reported a similar experiment using longitudinal -i
oscillations at 50 kHz in which a peak in Q-1 occurred at a viscosity of 40 poise. In all theoretical models of fluid
flow attenuation, viscosity enters as the product of viscosity and frequency. Therefore, variation of viscosity can also be
Fig. 1.2. Variation of extensional decrements of a Berea sandstone with overburden pressure at fixed water saturations. From Gardner et al (1964).
pressure, 103 psi 0.4 0.3 0.2 0.1 0
considered as variation of the frequency for a given fluid viscosity. The effect of using a high viscosity fluid such as glycerine is to shift the fluid flow attenuation shown in Fig. 1.1 to lower frequencies.
At the other extreme of water content, Tittman et al
-i -2
(1975) reduced the Q of a lunar basalt from 10 in lab atmosphere to 3 x 10- 4 in a vacuum of 10- 1 0 torr, with
similar results for a terrestrial basalt (Tittman et al 1974). -l
Recovery of the initial high value of Q-1 by re-exposure to lab atmosphere or water vapour shows that the attenuation in rocks normally called dry is caused somehow by adsorbed
water vapour.
Effect of pressure. Several investigators have shown that -i
Q decreases for both rocks and unconsolidated sand as pressure is increased to between 300 bars to 1 kbar, after
-i
which Q-1 remains relatively constant as pressure is increased further (Gardner et al 1964, Gordon and Davis 1968, Winkler and Nur 1979, Toksoz et al 1979). The decrease in Q-1 is less pronounced for dry rocks than for saturated rocks. Figure 1.2 from Gardner et al (1964) shows typical results.
Effect of non-hydrostatic stress. Lockner et al (1977) applied an axial stress to a cylinder of Westerly granite and measured the changes in attenuation of P and S waves propagating normal to the stress axis. The attenuation of the S wave polarized parallel to the stress axis decreased as axial stress was increased until near failure, while the
attenuation of the P wave and the S wave polarized perpendic-ular to the stress axis remained relatively constant up to approximately half the failure strength and then increased at larger stress. Others have reported similar results. Gowd (1970) found that for propagation perpendicular to the
-1
stress axis, Q decreased with stress up to half the failure strength and then increased with stress. Merkulova et al
(1972) measured Q-1 of longitudinal oscillations in samples of gabbro, granite, and quartzite under axial compression. Q-1 remained constant as axial stress was increased up to
300 bars, then started decreasing with stress. However, Rao and Ramana (1974) found that in metamorphic rocks,
Q-for axial P waves decreased as stress was increased to half the failure strength, then increased. Lockner et al (1977) explained these results as being due to changes in frictional dissipation on crack surfaces as the crack distribution is modified by the axial stress.
Effect of temperature. Volarovich and Gurvich (1957) and Kissel (1972) investigated the effect of temperature on attenuation in igneous and sedimentary rocks in air. Some of their results are shown in Fig. 1.3. Kissel (1972) found that Q-1 had a peak near room temperature and decreased at lower and higher temperatures. He observed that his samples lost 0.1% to 2% of their weight by heating to 600 OC.
Volarovich and Gurvich (1957) only made measurements above room temperature, but they went to higher temperatures, up to 1000 OC. Q-1 was found to have a minimum near 300 *C and
-l
Fig. 1.3. Variation of Q-1 with temperature. v Barre granite (Kissel 1972); o Kutaisi basalt, o gabbro, a quartzite (all from Volarovich and Gurvich 1957).
20 10 5 Q'1x10³ 0 500
temperature, OC
1000to increase at higher temperatures. Rocks containing quartz -l
had a peak in Q-1 near the a-8 quartz transition, 573 OC, especially the quartzites. Granites had a smaller peak near
-i
600 OC and the diabases had no increase in Q until 900 OC. Tittmann et al (1978) measured the attenuation of a basalt
-7
in a vacuum of 2 x 10- torr between -100 OC and 450 OC. -l
They found a maximum Q-1 at 100 OC and a minimum at -100 OC.
Effect of amplitude. For rocks, Q-1 is independent of strain amplitude in the range 10 to 10- 6 , but increases at higher
strains (Gordon and Davis 1968, Winkler et al 1979). -l Winkler et al (1979) showed that the increase in Q-1 as
strain amplitude is increased was approximately the same for room dry and saturated samples, but was much less for a
sample dried in a vacuum oven.
1.4 Theory
In this section, attenuation mechanisms that may be important under laboratory and upper crustal conditions are summarized. Jackson and Anderson (1970) reviewed attenuation mechanisms that may be important in the earth's mantle.
The observations that Q-l is independent of frequency in dry rocks have led to the postulation of friction between crack surfaces as the mechanism of attenuation, since the classic Coulomb friction, and therefore the energy dissipated by friction, are independent of the velocity of sliding of the surfaces. Walsh (1966) calculated the attenuation of P and S waves in rocks with random distributions of cracks
by approximating the cracks as thin elliptical voids in plane stress. As the stress wave passes, those cracks
oriented so that the shear stress acting on them is greater than the frictional shear stress will slide and so dissipate energy. The attenuation depends on the friction coefficient
3
and the crack density e = N a , where N is the number per
v v
unit volume of cracks of half-length a that are just in contact. For reasonable values of the friction coefficient
-1 -1
his analysis gives a ratio of QS /QP between 0.4 and 1.0, which agrees with laboratory measurements, but the model
requires rather high values of crack density. The friction mechanism and the arguments that have been made against it
are considered in Chap. 2.
In a partially or fully saturated rock, motion of the fluid also causes attenuation. Two types of mechanism have been proposed. One is viscous shear relaxation in the fluid. Walsh (1969) analyzed this mechanism and concluded that it could be important at seismic frequencies for
partial melt conditions in the upper mantle. For water in crustal rocks, viscous relaxation is probably important only at frequencies greater than 106 Hz. The second type of mechanism is flow between cracks, sometimes called
squirt flow (Mavko and Nur- 1975, O'Connell and Budiansky 1977). As a stress wave passes through a rock, cracks of different orientations with respect to the applied stress are deformed by different amounts. The resulting fluid
energy near the frequency at which the period of the wave is equal to the relaxation time T1 required for the flow. If the rock has a wide range of crack geometries, the
attenuation can be spread over a broad range of frequencies. O'Connell and Budiansky (1977) give several estimates for the relaxation time, one of which is T1 = n/Ka3 , where n is
the fluid viscosity, K is the matrix bulk modulus, and a is the crack aspect ratio. For crack aspect ratios between 10- 4 and 10- 2, this expression predicts that fluid flow attenuation is important between 10 and 106 Hz. Johnston et al (1979) derive a different expression for the relaxation time for flow between cracks and equant pores that predicts that fluid flow attenuation is important at frequencies of
103 and higher.
If the rock is not completely saturated the resis-tance to fluid flow from saturated cracks to empty cracks or pores is reduced and fluid flow losses should be enhanced. This situation has been analyzed from two points of view. Johnston (1978) considered the case of gas bubbles in a mostly saturated rock and Mavko and Nur (1979) considered
fluid drops in cracks. The relaxation times depend on the shapes and sizes of the fluid drops or gas bubbles.
In addition to physical attenuation mechanisms,
scattering of elastic waves can cause an apparent attenuation when the wavelength is similar to the size of the inhomoge-neities in the rock. Scattering can be important in
when the wavelength is on the order of millimeters or less, comparable to the grain size of most rocks. Scattering may also be important in the earth at lower frequencies in regions where larger scale inhomogeneities occur.
Chapter 2
ATTENUATION DUE TO FRICTION IN CRACKS
2.1 Introduction
The mechanism of attenuation by friction on crack surfaces described by Walsh (1966) accounts for the
observa--i
tions that Q-1 is constant with respect to frequency over the range 10- 3 to 105 Hz in dry rocks. Two criticisms of this mechanism, considered in detail below, are: (i) that the number of cracks required to provide the measured atten-uation is unreasonably high (Savage 1969), and (ii) that frictional attenuation should be amplitude dependent and since amplitude dependent Q-l is found only at strains above
-6
10- 6, friction is unimportant at the much lower strain levels of seismic waves in the earth (Mavko 1979, Winkler et al 1979). These criticisms are valid only for cracks that are completely dry, a condition that is unlikely to occur in the crust and does not occur in laboratory measure-ments of attenuation in rocks in normal atmosphere. In this chapter we present evidence that in most rocks there are
significant numbers of very narrow cracks that are filled with water under room dry conditions. Therefore, the two
criticisms are based on invalid assumptions and do not apply. We then extend Walsh's (1966) theory by including the concept
of boundary lubrication and show that the improved theory of attenuation due to friction in cracks lubricated with water is a reasonable mechanism for explaining attenuation in nominally dry rocks.
2.2 Summary of Walsh's model of attenuation in rock due to friction
The following is a summary of Walsh's (1966) analysis of attenuation in rock due to friction between crack surfaces in contact. The cracks are assumed to behave as thin
elliptical cracks in plane stress and are assumed to be equidimensional in plan view. As a stress wave passes through the rock, sliding occurs between opposite crack
faces in those cracks that are barely closed and are oriented so that the applied shear stress on the crack surfaces is greater than the frictional shear stress. Work done against
friction is dissipated as heat, resulting in attenuation of the wave.
For a crack on which friction does occur, the energy dw dissipated due to an increase in applied stress is
dw= 2~ )pad(T-cp) (2.1)
where
a = half-length of the crack
E = Young's modulus of the rock matrix
= coefficient of friction between the crack surfaces a= applied stress normal to the plane of the crack
T = applied shear stress in the plane of the crack The condition that sliding occurs is
ITj > ia, (2.2)
and for the crack to be closed,
a > 0 (2.3)
The total energy loss per cycle is found by integrating (2.1) for each crack and summing the result for cracks of all
orientations which contribute to frictional dissipation, as defined by the bounds (2.2) and (2.3). When the integration
-i
is done for P and S waves, the expressions for Q are too long to be presented conveniently in closed form, but they are plotted in Fig. 2.1. Q-1 depends on the density of
barely closed cracks e' = N a ; p, the friction coefficient; E/E, the ratio of effective to matrix Young's modulus of the rock; and v, the effective Poisson's ratio of the rock. The crack density e' refers only to those cracks contributing to friction (i.e., those barely closed in this analysis) and not to the total crack density.
2.3 Criticism of the frictional attenuation model
In more detail, the first criticism mentioned above is as follows (Savage 1969). Only cracks that are "barely closed" contribute to friction. A small hydrostatic pressure applied to the rock would clamp those cracks so that a small amplitude stress wave could not cause them to move and they would no longer contribute to frictional dissipation. A new
-I
Fig. 2.1. Relationship between Q -, friction coefficient n, and material constants for longitudinal and transverse waves. E/E is the ratio of effective to intrinsic
Young's modulus, e' is the crack density contributing to friction, and v is the effective Poisson's ratio. From Walsh (1966).
0.2 0.4 0.6 0.8
Triction
coefficient,
p
0.03 0.02w
1w lu T 0 0.01 0 1.0required to account for the attenuation at this small
hydrostatic pressure. Since cracked rocks have significant attenuation at pressures up to several hundred bars, on the basis of this argument, an extremely large number of sets of cracks would be required to account for the observed
attenuation, each set being barely closed at a particular small increment of pressure. Since Walsh (1966) and Gordon and Davis (1968) showed that essentially all the cracks need to be contributing to explain the observed attenuation at
zero confining pressure, Savage (1969) concluded that the frictional model required crack densities much higher than actually found in rocks and that friction therefore could not explain low-amplitude attenuation in rocks.
The second criticism is based on the analysis of frictional energy loss under combined normal and shear loading of spheres (Mindlin and Deresiewicz 1953) and of cracks with smooth surfaces and tapered ends (Mavko 1979).
In both cases frictional energy loss is calculated to be proportionsl to the cube of the shear stress amplitude.
Since the stored energy is proportional to the square of the stress amplitude, the resulting Q-1 is proportional to
amplitude. Mavko (1979) generalized from these specific geometries and concluded that attenuation due to friction on crack surfaces is inherently amplitude dependent. In that case friction is unimportant for low amplitude seismic waves
-i such as occur in the earth since amplitude-dependent Q is
observed in the laboratory only at strains greater than 10-6 observed in the laboratory only at strains greater than 10•
Interestingly, experimental determinations of energy loss in shear between spheres in contact by Mindlin et al (1952) and Johnson (1955) showed that at low amplitudes energy loss was
-i proportional to the square of the amplitude, i.e. Q was independent of amplitude, and only at higher amplitudes was the energy loss proportional to the cube of the amplitude as predicted by theory. These observations cast doubt on the validity of the theory at low amplitudes and imply that
-i friction may indeed produce an amplitude independent
Q-Both criticisms are implicitly based on the assump-tions that cracks in rocks are dry and that actual contact between opposite crack faces is required for friction to occur. Actually, because of the strong affinity of water
for silicate surfaces, in normal atmosphere all cracks with widths less than 100 to 200 A will be filled with water.
2.4 Occurrence of water in rocks
Two effects tend to hold water in the cracks in
rocks: the adsorption of water on surfaces, and capillarity. The thickness of the adsorbed water layer depends on the
temperature, humidity, and material. Holland (1964) reported measurements of the thickness of adsorbed water on glass
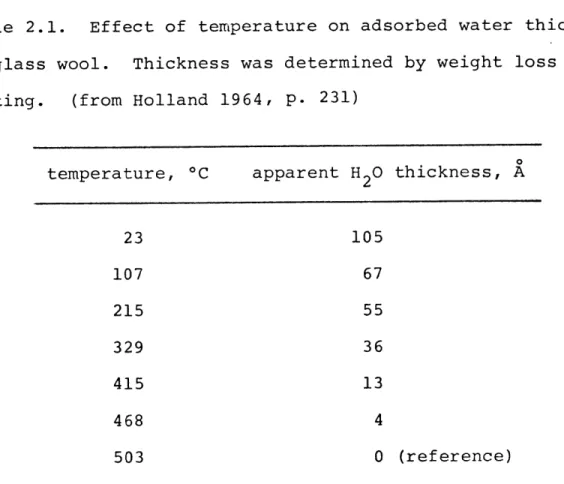
wool determined by weight loss on heating, which are given in Table 2.1. The thickness of the adsorbed water was 105 A at room temperature and decreased as temperature was raised. The measurements of several authors of water thickness at different relative humidities are given in Table 2.2. The
Table 2.1. Effect of temperature on adsorbed water thickness on glass wool. Thickness was determined by weight loss on heating. (from Holland 1964, P. 231)
temperature, OC 23 107 215 329 415 468 503 apparent H20 thickness, A 105 67 55 36 13 4 0 (reference)
Table 2.2. Effect of relative humidity on adsorbed water thickness. Frazer (1929), Hall (1970), and Tittmann et al
(1977) used the ellipsometry method, in which the thickness of the surface film is estimated from its effect on the polarization of a beam of plane polarized light reflected near the Brewster angle. Hagymassy et al (1969) used the adsorption isotherm method.
reference Frazer Hagymassy Hall Tittmann (1929) et al (1970) et al
(1969) (1977)
material glass quartz, fused basalt
fused silica silica P/ps apparent H20 thickness,
A
1.0 20 80 <60 (uneven 0.95 24 12 7 coverage) 0.9 20 0.85 9 0.6 6 6 0.4 3 0.05 <30variability is probably due to differences in surface preparation, especially surface roughness. Perhaps the best values from the point of view of this discussion are the ones of Tittmann et al (1977), since they used a rock. We will thus assume that the thickness of the adsorbed water
layer in cracks in rocks is between 30 and 60
K.
For comparison, a monolayer of water has a thickness of 3K.
As a result of the surface tension of a liquid, the vapour pressure is different over a curved liquid surface
than over a plane surface. This effect is called capillarity. The vapour pressure is lower over a concave surface than a plane and therefore liquid condenses in narrow cracks and capillaries. In a humid atmosphere, water fills all cracks narrower than width w = 2r cose + 2z, where r is the
m c m
equilibrium radius of curvature of the water-air interface at a given water vapour pressure, 8c is the contact angle between water and the solid surface, and z is the thickness of the adsorbed water layer (see Fig. 2.2). For water on silicate surfaces, 68 is approximately zero. The relation between rm and the vapour pressure is called the Kelvin equation, which has been experimentally verified for rm as
small as 40
K
by Fisher and Israelachvili (1979):In(ss) p).' (p - Ps) (2.4)
[ p RRT p r (P - s)
s m
where
p = vapour pressure
Fig. 2.2. Capillary and adsorbed water in a crack. Water will condense in cracks narrower than w = 2r cose m c + 2z, and will evaporated from wider cracks, where rm is the mean radius of curvature of the water-air interface, 8c is
the contact angle between water and the crack surface and z is the adsorbed water thickness.
rm W
OCt
////////////////////t//////////////.
M = molecular weight of the liquid p = density of the liquid
R = gas constant T = temperature, OK
y = liquid-vapour interfacial tension
1 _ 1 + where r1 and r are the principal radii of
rm r r2 1 2
curvature of the surface.
For a planar crack, r2 is infinite (into the plane of Fig. 2.2), so rm = rl. For water, (2.4) gives rm = 25
K
at 80% relative humidity, and rm = 10 A at 60% relative humidity.Combining the results for capillary water and
adsorbed water, water will fill those cracks in rocks that have widths less than 80 to 170 A in normal atmosphere.
Densities of cracks less than 200 A have not been measured, although such cracks must exist in rocks in the laboratory. Hadley (1976) measured numbers and sizes of cracks in Westerly granite using a scanning electron
microscope. The width of visible cracks was limited by the thickness of the gold coating applied to the specimen, about 200 A. However, approximately 1/8 of the cracks she counted had widths of 300 A or less, suggesting that many cracks of smaller width exist. Such narrow cracks must also exist in order to account for the surface conduction contribution to electrical conductivity measurements (Madden 1976). The crack density e that Hadley (1976) measured for cracks of width greater than 200 A was 0.18. The total e required
to account for the compressibility of Westerly is 0.35 (see Table 3.1). This value is a lower limit since the equations for dry rocks were used to calculate it. The narrow cracks we are interested in for friction are filled with water and cracks filled with water have a smaller effect on compressi-bility than empty cracks (Kuster and Toksoz 1974, Budiansky and O'Connell 1976). Therefore, the e of thin cracks, that is, those contributing to frictional dissipation, could be 0.17 or higher, if the area chosen for counting was repre-sentative of the whole rock and the uncertainty in relating the measured dimensions of cracks to the parameter e deter-mined from a theoretical model is not too large. For a
friction coefficient of 0.2 to 1.0, Walsh (1966) gives Q-1 for shear waves as (see Fig. 2.1)
Q-1 = 0.01(E/E)e (2.5)
S
where E/E is the ratio of effective to intrinsic Young's modulus. For Westerly granite E/E is 0.67 (Simmons and
-il-Brace 1965). The Q-1 of room dry Westerly is 5.7 x l0-3 (Table 4.1). Using these values in (2.5) gives a crack density of 0.85, or 5 times too high. The discrepancy may be because (i) the density of narrow cracks is underestimated because they are filled with water, as mentioned above, or
(ii) as Walsh (1966) suggested, actual cracks are connected and therefore less stiff than the isolated elliptical cracks used in the derivation of (2.5). Sliding displacements and therefore frictional dissipation in the real rock would be
greater than in the model, thus requiring a smaller crack density than the prediction.
2.5 Boundary Lubrication
Friction between surfaces separated by thin films, termed boundary lubrication, was reviewed by Ling et al
(1969). In boundary lubrication a small fraction of the load is supported by solid-solid contacts, but most of the load is supported by the boundary film, which may be an
oxide layer or a thin film of lubricant (in this case, water). Friction arises from the shearing of both the solid contacts and the boundary film. Measured friction coefficients are in the range 0.1 to 1.0, and depend on the composition of the solid, surface finish, lubricant, 'and interaction between the lubricant and the solid, but not on the bulk viscosity of the lubricant. Although most friction research
is done at high loads and high speeds, a Coulomb friction -5 law has been shown to be valid at small loads, from 10 to
-2
10- 2 gram (Whitehead 1950, Bowden and Tabor 1964); at low speeds, down to 10- 6 cm/sec over displacements as small as
-5
10- 5 cm, much smaller than an average asperity contact size of the surfaces used (Heymann et al 1955).
Bowden and Tabor (1964) proposed that boundary lubrication could be described by the equation
F = S[ass + (1 - a)s/] (2.6)
where
S = area of real contact (not the same as the apparent contact area)
a = fraction of S consisting of solid to solid contacts ss = shear strength of solid junctions
sZ = shear strength of boundary lubricant film
For materials that can deform plastically, such as metals, the area of real contact is
S W (2.7)
where W is the load and P is the yield stress of the contact asperities. Brittle materials obey (2.7) approximately
(Tabor 1975). Under the local conditions that exist at the contacts of asperities, the stress field includes a large hydrostatic component which in many cases is sufficient to inhibit brittle failure and the asperities deform in a plastic manner, although some cracking may also occur.
From the definition of the coefficient of friction and (2.6) and (2.7) we obtain
_ F _ l[aP P s s + (1 - a)s ] (2.8)
If the ratios ss/P and s /P are denoted by vs and l , then
v = aps + (1 - a)pi (2.9)
where ps is the dry friction coefficient and pI is the
friction coefficient when a = 0, that is, in the absence of true solid contact. Bailey and Courtney-Pratt (1955)
measured the friction force between sheets of mica and measured the true contact area by optical interferometry.
They determined that the shear strength of an unlubricated mica contact was 1 kb and that the shear strength of the
contact between mica sheets each covered by a single mono-layer of calcium stearate was 25 bars, or one fortieth as large. The shear strength of six monolayers of calcium stearate was still lower. The experiments were carried out in atmosphere a brief time after cleavage of the mica sheets, so it is likely that in the unlubricated case the mica
surfaces were covered by at least a monolayer of water. They thus demonstrated that thin lubricant films have significant shear strength, explaining why a boundary
lubricant reduces the coefficient of friction only a factor of 10 while decreasing wear by a factor of up to 104 or more. Tamai and Rightmire (1965) showed that (2.9) was consistent with the differences in friction coefficient between fresh copper surfaces and copper surfaces with two different thicknesses of oxide. For twelve lubricants,
I/P s , or s /Ss ranged from 0.02 to 0.06; the larger values
of P were found for the lubricants with the more complicated molecular structures. The calculated values of a ranged
from 0 to 3% for lubricants with dipole moments between 1.7 and 3.1 debye and was 23% for a non-polar liquid. For
comparison, the dipole moment of water is 1.87 debye. Other studies have also shown that for a good lubricant a is a few percent or less (Bowden and Tabor 1964). A good lubricant is one that forms a continuous film separating the solid
surfaces and has strong lateral adhesion so that it resists penetration by asperities of the solid surfaces during
sliding. Water is a polar liquid and is strongly bound to silicate surfaces, so that it should be a good lubricant for silicate minerals, although we do not know of any experiments for which s or a for water has been determined. If, however, in the experiments of Bailey and Courtney-Pratt (1955) it is true that in the unlubricated case a monolayer or more of water covered the mica surfaces, their results indicate that very thin water films have significant shear strength.
The important points of this discussion of boundary lubrication are that (i) most of the friction force is due to the shearing of the boundary lubricant film, and not to
the shearing of actual solid contacts, and (ii) the coefficient of friction is in the range 0.1 to 1.0.
2.6 A model of attenuation based on friction in cracks lubricated with water
With the understanding that the cracks contributing to frictional dissipation are not those that are barely closed but instead narrow cracks filled with water in which friction occurs by boundary lubrication, the analysis of W.alsh (1966), summarized in Sec. 2.2, can be used for an
improved model of attenuation in nominally dry rocks, in which the crack density e' now refers to the density of narrow cracks lubricated by water. This improved model of frictional attenuation can be used to account for the
observed effects of hydrostatic pressure and strain amplitude on Q- , thus obviating the two criticisms given in Sec. 2.3, and can also account for the effects of temperature and high vacuum. As hydrostatic pressure is increased, the rough surfaces of the cracks are pressed together. As more
asperities come into contact the crack becomes stiffer (Walsh and Grosenbaugh 1979), and the sliding displacement due to an applied stress wave decreases. Therefore,the frictional dissipation on each crack surface decreases. It is not necessary for the rock to contain many different sets of cracks that become barely closed at successive increments of pressure. The same cracks contribute to frictional dissi-pation at all pressures, but each crack contributes less as
pressure is increased and the cracks become stiffer. Two processes may contribute to the amplitude
-1
-dependence of Q-1 at strains greater than 106 :
1. For a shear modulus of 0.2 Mb (Westerly granite, -6
Simmons and Brace 1965) a shear strain of 10-6 corresponds to a stress of 0.2 bar. At smaller stresses there is
probably negligible deformation of asperity contacts between crack surfaces, relatively few asperities are in actual
contact, and Q-1 is constant. At higher stresses more asperities come into contact and the attenuation due to friction at these contacts may be amplitude dependent as predicted by contact theory.
lower strains were not contributing to friction may be closed sufficiently for their adsorbed water layers to come into contact and so increase the number of cracks on which fric-tional dissipation occurs; thus Q-1 would increase.
As temperature rises or the water vapour pressure decreases, the thickness of the adsorbed water layer on crack surfaces decreases (Tables 2.1 and 2.2). Simmons
(personal communication) has shown that water is driven off by heating a rock up to 200 OC. As the thickness of the adsorbed water layers is decreased, the crack surface area contributing to friction is reduced as some cracks previously
saturated are no longer bridged by water films. As the crack -l
area contributing to friction decreases, Q decreases.
2.7 Summary
This chapter can be summarized as follows. Cracks in rocks contain adsorbed and capillary water. Frictional dissipation thus occurs over large areas of crack surfaces and not only the small fractional area of actual asperity contact. Friction on crack surfaces lubricated by thin films of water can account for the observed attenuation in nominally dry rocks and the effects of pressure, strain amplitude, temperature, and vacuum on attenuation.
The friction mechanism has been discussed in this
chapter as applied to nominally dry rocks. The data presented in Fig. 1.1 show that for a broad frequency range attenuation due to fluid flow is more important than friction in labora-tory measurements on saturated rocks. However, in the crust
of the earth as depth increases, lithostatic confining press-ure tends to close cracks, so that it is likely that
micro-cracks in the crust are narrower in general than the micro-cracks in rocks collected at the surface. As the cracks become
narrower, a larger proportion of them contribute to frictional dissipation. In addition, since the water in very narrow
cracks is mostly adsorbed water and thus bound to the crack surfaces, fluid flow becomes less important. Therefore, we believe that in the crust, friction is an important attenua-tion mechanism, and may in fact be the dominant attenuaattenua-tion mechanism, even under saturated conditions.
Chapter 3
MATERIALS AND PROCEDURES
3.1 Samples
The samples used in this study are mainly Precambrian igneous rocks from central Wisconsin and southeast Missouri. Also included are Westerly and Chelmsford granites and
Frederick and Pageland diabases. Locations and selected physical properties of the rocks are given in Table 3.1 and their modal compositions are given in Table 3.2.
3.2 Apparatus
Attenuation was measured with a torsional pendulum shown schematically in Fig. 3.1, that was also used by Jackson (1969). The flywheel has a mass of 50 kg and is
suspended from the ceiling. The sample is attached to the flywheel and to the base by face-plate collett chucks.
The optical system used to measure the rotation of the flywheel is shown schematically in Fig. 3.2. A beam of light is reflected by a mirror on the flywheel onto a beam splitting lens. The outputs of the two phototubes are subtracted and the result amplified and plotted by a chart recorder. The sensitivity of the recording system is
approximately 120 volts per radian and it is possible to
measure oscillation amplitudes as small as 105rad-5 ians, the
1368, 1370, 1407, 1409, 1410, 1411, and 1415 were published in Feves et al (1977). Crack porosities for the other rocks were determined from DSA data collected by M. L. Batzle, M. Feves, and H. W. Cooper. Compressi-bilities were determined from the same DSA data as the crack porosities. Crack densities were calculated from the compressibilities by the method described in Sec. 5.1.
-1
sample # name location crack porosity compressibility, Mb crack density x 106 8(0 kb) 8(2 kb) 6
A757 granite Chelmsford, Ma 2370 9.92 2.09 0.39
806 granite Westerly, RI 1450 7.67 2.08 0.35 812 diabase Pageland, SC 25 1.37 1.28 0.02 1242 diabase Frederick, Md <5 1.30 1.30 0.00 1328 gabbro Hurley, Wi 805 3.52 1.81 0.18 1331 gabbro Mellen, Wi 70 1.44 1.24 0.04 1336 granite Wausau, Wi 370 2.86 2.02 0.12 1343 granite Wausau, Wi 860 5.14 1.85 0.29 1368 gabbro Tigerton, Wi 60 1.50 1.40 0.02
1370 quartz monzonite Red River, Wi 830 3.98 2.10 0.20
1381 gabbroic anorthosite Mellen, Wi 190 1.46 1.08 0.09
1401 diabase Fredericktown, Mo 75 1.62 1.46 0.03
1403 felsite Fredericktown, Mo 185 2.36 2.02 0.05
1407 felsite Middlebrook, Mo 155 1.67 1.49 0.04
1409 granite Graniteville, Mo 885 4.42 2.45 0.19
1410 granite Graniteville, Mo 615 3.68 2.24 0.16
1411 rhyolite Stouts Creek, Mo 605 3.18 2.05 0.14
sample # A757 1 1 34a 812 890 b 1331 1336 1343 1368 1370 1407 1409 1410 1411 1415 plagioclase 28.5 39.2 63.7 47.3 53.7 23.8 10.0 52.0 33.7 0.3 29.3 26.9 16.1 66.9 K feldspar 34.8 30.7 44.8d 49.6d 25.7e 30.4d 39.3d quartz 30.1 22.5 28.9 39.1 28.5 6.7 39.8 32.8 8.3 pyroxene 29.2 46.9 30.1 24.3 0.9 8.8 olivene 2.0 0.4 1.1 0.3 14.2 biotite 2.1 5.0 0.8 tr 18.0 9.5 2.3 opaque 0.1 0.9 1.1 2.5 '3.1 1.0 tr 4.1 0.7 tr tr 0.4 4.7 secondary 1.2 0.4 4.0 2.2 12.2 1.5 0.8 1.1 0.3 1.0 tr 0.5 2.5 3.1 matrixc 77.5 72.7 others 3.1 1.3 tr 0.3 0.2 0.7 14.5 0.5 tr total 99.9 100.0 100.0 100.1 100.2 100.0 99.8 100.0 100.0 100.0 100.0 99.5 100.0 100.0 number of 2730 1000 1000 2413 1002 1000 1200 1000 1000 1000 1000 1200 1000 1000 counts avg. grain 1.5 0.8 0.6 0.5 0.6 1.0 2.0 0.6 0.8 <0.1 1.0 0.9 0.4 1.2 size, mm reference f g h g g g 9 g 9 g g g g g for mode ref. for petrographic i j k 1 1 1 1 1 1 1 1 description
see next page for footnotes
tr denotes trace
aThe mode given for Westerly granite is for sample 1134. Sample 806 was used for the physical property measurements of Table 3.1. These two samples were collected at different times from the same
locality and have similar properties.
bThe mode given for Frederick diabase is for sample 890. Sample 1242 was used for the physical property measurements of Table 3.1. These two samples were collected at different times from the same
locality and have similar properties.
fine grained quartz and feldspar matrix. perthite.
e .
microcline. f
Cooper and Simmons (1977) Feves et al (1977)
Simmons and Cooper (1978) 'Dale (1923)
3Fairbairn et al (1951) Raglan et al (1968) 1
Richter and Simmons (1977)
Un
3/32"
steel
wire
-.
mirror
flywheel
face plate-chucks
sample
.////// IrFig. 3.2. Schematic of the recording system. From Jackson (1969).
light source
noise level of the system. The strain at the surface of the sample is aO/L where a is the sample radius, L is the sample length, and 6 is the angle of rotation, so that oscillations
-6
at sample strains of 10-6 or less can be measured, for samples of radius to length ratio of 0.1 or less.
The equation of motion of an ideal torsional pendulum is
Jde+ K =0 (3.1)
dt where
J = moment of inertia of the flywheel
K = stiffness of the shaft = (T/2)Ga4/L G = shear modulus of the shaft
a = shaft radius L = shaft length
6 = angle of rotation
A solution of the form 6 = A cos(wt) where A is the amplitude of the oscillation and w is the angular frequency, requires that
-w JA + KA = 0 (3.2)
Therefore,
2 K _ 'Ga (3.3)
J 2JL
Since w = 27f, the frequency of oscillation f is given by
f Ga4 4=
J
(3.4)The moment of inertia of the flywheel was determined from
7 2
Since f varies as a , the frequency of oscillation can be varied most easily by using samples of different radii. A practical range of frequencies was found to be
from about 0.5 Hz for samples 0.5 cm diameter and 20 cm long to about 3 Hz for samples 1.2 cm diameter and 10 cm long. Samples thinner than 0.5 cm diameter were too fragile for easy handling with this equipment. At frequencies above
3 Hz, since the strain also depends on sample radius, it was not possible to accurately measure attenuation at strains
-l
low enough to be in the constant Q-1 range.
3.3 Procedures
-i
The procedure used to calculate Q was to measure the amplitude A at a number of times on the strip chart, plot InA versus time and then fit in the least squares
sense a straight line to the low amplitude portion of the points where the slope was constant. Then
-1 _ 1 dlnA Trrf dt
At strains higher than approximately 5 x 10- 6, dlnA/dt was found not to be constant. In that case, Q-1 can be calcu-lated as a function of strain amplitude using the following equation, derived in Appendix B:
-l(aA) _ 1 dlnA + 1 dlnA d nA (36)
L rf dt 4Trf dt dt
Measurements were made under conditions called room dry and saturated. For room dry conditions, cores were
-2
residual free water, then the samples were exposed to labo-ratory air for at least 72 hours to assure equilibration at laboratory humidity. As explained previously the term room dry does not imply that the cores are completely dry. The various cores do not necessarily have the same degree of
saturation nor is the saturation in a single core necessarily homogeneous since that depends on the widths of the cracks.
-2
The cores were saturated by evacuating them to 10 torr pressure, then filling the vacuum chamber with distilled water. It is probably not possible to fully saturate a rock without applying some pore fluid pressure to dissolve resid-ual air, so the saturation of the samples is estimated to be between 95 and 100%. The sample to be measured was kept saturated during the time needed to mount it in the equip-ment and to stabilize the electronics; it was wrapped in a wet cloth and then unwrapped just before the measurement was made. The surface of the sample would stay wet (as judged
from visual appearance) long enough for the measurement of Q-1 to be made. Analysis of the data proved this simple procedure sufficient. If the degree of saturation of the
sample had decreased during the measurement, then Q-1 would have changed with time and a constant rate of decay of InA would not have been observed. In fact, for all saturated cores a constant value was obtained.
-i
Measurements of Q-1 at elevated temperatures were made with a ceramic tube furnace around the sample, as shown
Fig. 3.3. Schematic of the furnace and sample arrangement for attenuation measurements at elevated temperatures.
0
sample0
furnace coils 0 0.22 0.375"0
chuckmeasuring attenuation of polycrystalline alumina, mullite, and forsterite. To concentrate the strain energy in that part of the sample in the center of the furnace, where the temperature in nearly uniform, he used samples ground into "dogbone" shapes, that is, with a central piece of smaller diameter than the ends. Because the central piece is of smaller diameter it is less stiff than the ends and most of the twist of the sample is concentrated there. Rock
samples are not as strong as the ceramics Jackson (1969) used and tend to break at the point where the diameter of the sample changes, so a different sample arrangement was used in this study. Instead of dogbones ground from a core sample, the same geometry was obtained by using samples 0.22" diameter held in brass ends of 0.375" diameter by set screws. For the diameters of sample and end pieces, a sample length of 1.6" was used so that at least 90% of the strain energy would be in the sample. Using a longer work zone than Jackson (1969) did meant that temperature variations along the sample were greater than for his measurements. Three temperature profiles are shown in Fig. 3.4. The temperatures reported in Sec. 4.4 are mean values along the sample. At low mean temperatures, temperature variation along the sample is not very great, but at high temperatures the variation along the sample is so great that the mean temperature is not very meaningful. For the top curve in Fig. 3.4, the tempera-ture difference between the middle and the ends of the sample
position of o--- sample -0 position, inches 600 F-400 T, C 200
F
Sec. 4.4 must be regarded as being very approximate.
3.4 Error analysis
The procedure for the measurement of attenuation as described above will be valid provided that (i) all energy loss is due to the anelasticity of the sample and not due to losses in the sample clamping assemblies, the suspension of the flywheel, or air resistance of the flywheel; (ii) that all the elastic energy of the pendulum is stored in the
sample, and none in the rest of the system; and (iii) that other modes of vibration are not excited. Measurements on samples of three low-loss materials, aluminum, brass, and fused silica gave a value of Q of 3.3 x 10 . The actual values of Q-1 of these materials are not known at 1 Hz, but
the measured value is probably due to system losses since (i) it is unlikely that three different materials would have the same Q-I at 1 Hz and (ii) aluminum has a Q- of less than 10- 5 between 840 Hz and 102 kHz (Zemanek and Rudnick 1961). Measurements of attenuation of rock samples were corrected for the system losses by subtracting this value of
-4 -i
3.3 x 10 from the measured Q. For most samples the correction was less than 10%. Jackson (1969) stated that he designed the system so that at 1 Hz the elastic energy stored in the flywheel and suspension wire is less than
-5
2 x 10- 5 of the energy stored in the sample, and so that unwanted modes are energetically unfavorable compared to the torsional mode and thus are not excited.
The uncertainty in an individual measurement of Q-1 can be estimated in two ways:
-l
1. From the differences in Q-1 measured on different cores from one block of rock. This estimate will include the effect of sample variability. Table 4.4 gives measured values of Q-1 of several cores in each of three orthogonal
directions in Westerly and Chelmsford granites. The standard deviation of Q-1 from the mean for the samples in the same direction is 5.3% for the Westerly samples and 10.3% for the Chelmsford samples, or 8.1% for the combined data.
2. From the change in Q-1 on repeated measurements of one sample. Six cores of Chelmsford granite were measured twice under room dry conditions, as shown in Table 4.4. Each sample was first measured dry, then saturated and
measured again, and then dried once more and Q-1 remeasured
-i
in the room dry condition. The changes in Q range from -i
-9.5% to +22.7%. The standard deviation of Q-1 calculated from the differences from the mean of the two measurements of each core is 8.8%.
The two estimates agree closely. We will use a value of ±10% as an estimate of the uncertainty of a measurement of
Q-Chapter 4
RESULTS
4.1 Attenuation in eighteen igneous rocks
-i
Room dry and saturated values of Q for the rocks described in Sec. 3.1 are given in Table 4.1. The measure-ments were made at frequencies between 0.5 and 3.5 Hz. The data are plotted against the crack porosity of the rocks in Fig. 4.1 Q-1 varies from 8.8 x 10- 4 to 7.6 x 10- 3 for the
-4 -2
room dry rocks and from 9.1 x 10 to 2.3 x 10 for the saturated rocks. For both dry and saturated cases, there is an increase in Q-1 with increasing crack porosity, but the amount of scatter about the general trend is greater than the estimated uncertainty of ±10% in each measurement. The upper dashed line in Fig. 4.1 is a least squares straight
-i
line fit between log(Q- ) and log(crack porosity) for the saturated rocks. It has a slope of 0.47 with a correlation coefficient of 0.93. The equation of the line is
log(Q- 1) = -0.53 + 0.47 log(nc ) (4.1)
where nc is the crack porosity. The stindard deviation of -l
Q-1 from the line is 40%. The lower dashed line in Fig. 4.1 is a least squares line for the dry Q-1 values except for the three points for the lowest crack porosities. These