EUROPEAN ORGANISATION FOR NUCLEAR RESEARCH (CERN)
Phys. Lett. B 777 (2018) 303
DOI:10.1016/j.physletb.2017.12.043
CERN-EP-2017-151 8th January 2018
Measurement of the exclusive
γγ → µ
+
µ
−
process
in proton–proton collisions at
√
s
= 13 TeV with
the ATLAS detector
The ATLAS Collaboration
The production of exclusive γγ → µ+µ− events in proton–proton collisions at a centre-of-mass energy of 13 TeV is measured with the ATLAS detector at the LHC, using data corresponding to an integrated luminosity of 3.2 fb−1. The measurement is performed for a dimuon invariant mass of 12 GeV < mµ+µ− < 70 GeV. The integrated cross-section is determined within a fiducial acceptance region of the ATLAS detector and differential cross-sections are measured as a function of the dimuon invariant mass. The results are compared to theoretical predictions both with and without corrections for absorptive effects.
c
2018 CERN for the benefit of the ATLAS Collaboration.
1 Introduction
When proton–proton (pp) beams collide at the LHC, typically rare photon–photon induced (γγ) inter-actions occur at perceptible rate and provide a unique opportunity to study high-energy electroweak processes [1]. Compared to other final states, the dilepton production is a standard candle process of the photon-induced production mechanism, thanks to its sizeable cross-section. Using pp collisions at a centre-of-mass energy of √s = 7 TeV, measurements of pp(γγ) → µ+µ−ppproduction (referred to as exclusive γγ→ µ+µ−) were performed by the ATLAS and CMS collaborations [2,3]. The exclusive γγ → e+e−process was also measured [3,4]. A similar experimental signature has been used to study the γγ→ W+W−reaction [5–7].
The exclusive γγ → µ+µ− production process competes with the two-photon interactions involving single- or double-proton dissociation due to the virtual photon exchange (Figure1 (a–c)). The electro-magnetic (EM) break-up of the proton typically results in a production of particles at small angles to the beam direction, which can mimic the exclusive process. However, the proton-dissociative processes have significantly different kinematic distributions compared to the exclusive reaction, allowing an effective separation of the different production mechanisms.
p p p p p p p p p ' X X + − γ γ γ γ γ γ X ' '' µ µ + − µ µ + − µ µ p p ' X γ γ X '' + − µ µ X (a) (b) (c) (d)
Figure 1: Schematic diagrams for (a) exclusive, (b) single-proton dissociative and (c) double-proton dissociative two-photon production of muon pairs in pp collisions. The effect of additional interactions between the protons is shown in (d).
In general, the photon-induced production of lepton pairs contributes up to a few percent to the inclusive dilepton production at LHC energies [8–10].
In order to reproduce the data, the calculations of such photon-induced reactions, in particular exclusive γγ → µ+µ− production, need to take into account the proton absorptive effects [3]. They are mainly related to additional gluon interactions between the protons (or proton remnants), shown in Figure1(d), which take place in addition to the QED process. The size of the absorption is not expected to be the same for exclusive and dissociative processes; it may also depend on the reaction kinematics. These effects lead to the suppression of exclusive cross-sections (typically around 10–20%) by producing extra hadronic activity in the event besides the final-state muons. Recent phenomenological studies suggest that the exclusive cross-sections are suppressed, with a survival factor that decreases with mass [11,12]. In this paper, a measurement of exclusive dimuon production in pp collisions at √s = 13 TeV is presen-ted for muon pairs with invariant mass 12 GeV < mµ+µ− < 70 GeV. The differential cross-sections, dσ/dmµ+µ−, are determined within a fiducial acceptance region. In the region 30 GeV < mµ+µ− < 70 GeV, the minimum transverse momentum of each muon is required to be 10 GeV. For 12 GeV < mµ+µ− < 30 GeV, the minimum muon transverse momentum is reduced to 6 GeV by taking advantage of the lower trigger thresholds available by making additional requirements on muon-pair topology. In addition, both
muons are measured in the pseudorapidity range of|ηµ| < 2.4. The measurements are compared to theor-etical predictions both with and without corrections for absorptive effects.
2 ATLAS detector
The ATLAS experiment [13] at the LHC is a multi-purpose particle detector with a forward-backward symmetric cylindrical geometry and nearly 4π coverage in solid angle.1 It consists of inner tracking devices surrounded by a superconducting solenoid, EM and hadronic calorimeters, and a muon spectro-meter. The inner detector (ID) provides charged-particle tracking in the pseudorapidity region|η| < 2.5 and vertex reconstruction. It comprises a silicon pixel detector, a silicon microstrip tracker, and a straw-tube transition radiation tracker. The ID is surrounded by a solenoid that produces a 2 T axial magnetic field. Lead/liquid-argon (LAr) sampling calorimeters provide EM energy measurements with high granu-larity. A hadron (steel/scintillator-tile) calorimeter covers the central pseudorapidity range|η| < 1.7. The end-cap and forward regions are instrumented with LAr calorimeters for both the EM and hadronic en-ergy measurements up to|η| = 4.9. The muon spectrometer (MS) is operated in a magnetic field provided by air-core superconducting toroids and includes tracking chambers for precise muon momentum meas-urements up to|η| = 2.7 and trigger chambers covering the range |η| < 2.4.
A two-level trigger system [14] selects the events used in the analysis. The first level is implemented in custom electronics, while the second trigger level is a flexible software-based system.
3 Data, simulated event samples and theoretical predictions
This analysis uses a data set of pp collisions collected at a centre-of-mass energy √s = 13 TeV during 2015 under stable beam conditions. After applying data quality requirements, this data sample corres-ponds to an integrated luminosity of 3.2 fb−1.
Calculations of the cross-section for exclusive γγ → µ+µ− production in pp collisions are based on the Equivalent Photon Approximation (EPA) [15, 16]. The EPA relies on the property that the EM fields produced by the colliding protons can be treated as a beam of quasi-real photons with a small virtuality of Q2< 0.1 GeV2. This flux of equivalent photons is determined from the Fourier transform of the EM field of the proton, taking into account the EM form factors [17]. The cross-section for the reaction pp(γγ)→ µ+µ−ppis calculated by convolving the respective photon fluxes with the elementary cross-section for the process γγ → µ+µ−. The signal events for exclusive γγ → µ+µ− production were generated using the Herwig 7.0 [18,19] Monte Carlo (MC) event generator, in which the cross-section for the process is computed by combining the pp EPA with the leading-order (LO) formula for γγ → µ+µ−. It is found that the predictions for exclusive γγ→ µ+µ−production from Herwig are identical to those from Lpair 4.0 [20] generator.
The dominant background, photon-induced single-dissociative (S-diss) dimuon production (Figure1(b)), was simulated using Lpair 4.0 with the Brasse [21] and Suri–Yennie [22] structure functions for proton 1ATLAS uses a right-handed coordinate system with its origin at the nominal interaction point in the centre of the detector and
the z-axis coinciding with the axis of the beam pipe. The x-axis points from the interaction point to the centre of the LHC ring, and the y-axis points upward. The pseudorapidity is defined in terms of the polar angle θ as η =− ln tan(θ/2), and φ is the azimuthal angle around the beam pipe with respect to the x-axis. The angular distance is defined as ∆R = p(∆η)2+ (∆φ)2.
dissociation. For photon virtualities Q2 < 5 GeV2and masses of the dissociating system m
N < 2 GeV, low-multiplicity states from the production and decays of ∆ resonances are usually created. For higher Q2 or mN, the system decays into a variety of resonances, which produce a large number of forward particles. The Lpair package was interfaced to JetSet 7.408 [23], where the Lund [24] fragmentation model is implemented.
The Herwig and Lpair generators do not include any corrections to account for proton absorptive ef-fects. Hence the normalisation of these MC samples is further constrained by a data-driven procedure, as described in Section6.
For double-dissociative (D-diss) reactions, Pythia 8.175 [25] was used with the NNPDF2.3QED [26] set of parton distribution functions (PDF). The NNPDF2.3QED set uses LO QED and next-to-next-to-leading-order (NNLO) perturbative QCD (pQCD) calculations to construct the photon PDF, starting from the initial scale Q20= 2 GeV2. Additionally, two alternative PDF sets, CT14QED [27] and LUXqed17 [28] are considered. Depending on the multiplicity of the dissociating system, the default Pythia 8 string or mini-string fragmentation model was used for proton dissociation. The absorptive effects in D-diss MC events are taken into account using the default multi-parton interactions model in Pythia 8 [29].
The NLO pQCD Powheg-Box v2 [30–33] event generator was used with the CT10 [34] PDF to generate both the Drell–Yan (DY) Z/γ∗ → µ+µ−and Z/γ∗ → τ+τ−events. It was interfaced to Pythia 8.210 [25] applying the AZNLO [35] set of generator-parameter values (tune) for the modelling of non-perturbative effects, including the CTEQ6L1 [36] PDF set. The production of top-quark pair (t¯t) events was also modelled using Powheg-Box, interfaced to Pythia 6.428 [37]. The event generators used to model Z/γ∗→ µ+µ−, Z/γ∗ → τ+τ−and t¯t reactions were interfaced to Photos 3.52 [38,39] to simulate QED final-state radiation (FSR) corrections.
Multiple pp interactions per bunch crossing (pile-up) were accounted for by overlaying simulated minimum-bias events, generated with Pythia 8.210 using the A2 tune [40], and reweighting the distribution of the average number of interactions per bunch crossing in MC simulation to that observed in data. Further-more, the simulated samples were weighted such that the z-position distribution of reconstructed pp in-teraction vertices matches the distribution observed in data. The ATLAS detector response was modelled using the GEANT4 toolkit [41,42] and the same event reconstruction as that used for data is performed. The measured distribution of the exclusive γγ→ µ+µ−process is compared with two models of absorptive corrections in Section8.
In the finite-size parameterisation approach [11], the absorptive effects are embedded in the evaluation of the γγ luminosity, taking the photon energy and impact parameter dependence into account. A simple exponential form of the proton’s transverse profile function, extracted from total and elastic pp and p ¯p cross-section data, is used to suppress the two-photon luminosity when the impact parameter of the pp collision becomes small. It determines the probability that no inelastic interaction producing additional hadrons in the final state occurs [43]. Moreover, only photons produced outside the proton with an assumed radius of rp = 0.64 fm are allowed to initiate the two-photon process. This particular feature reflects the finite transverse size of the proton and leads to further suppression of the cross-section. In the approach implemented in the SuperChic2 event generator [12], the absorptive effects are included at the amplitude level differentially in the final-state momenta of scattered protons. As a result, the sup-pression of the cross-section in general depends on the helicity structure of the γγ→ X sub-process and may also alter the kinematics of outgoing intact protons. Because some helicity amplitudes vanish for the γγ → µ+µ− process in the limit of massless leptons, this effect plays a less significant role in the
suppression of the pp(γγ)→ µ+µ−ppcross-section. As in the model described above, the proton trans-verse profile function controls the reduction of the exclusive production cross-section when pp collisions become central. It is fitted using a two-channel eikonal model to describe a range of total, elastic and diffractive pp and p ¯p data [44].
4 Event reconstruction, baseline selection and background estimation
Events were selected online by a set of dimuon triggers with a muon pT threshold of 6 GeV or 10 GeV, and dimuon invariant mass 10 GeV < mµ+µ− < 30 GeV or mµ+µ−> 30 GeV respectively. Triggers with the lower transverse momentum requirement were enabled for data-taking with an instantaneous luminosity below 1.2×1034cm−2s−1. These triggers were designed to collect exclusive dimuon events by employing an additional selection on the transverse momentum of the dimuon system, pµT+µ− < 2 GeV, to reduce contributions from DY and multijet production.
In each event, muon candidates are identified by matching complete tracks in the MS to tracks in the ID and are required to be in the region|ηµ| < 2.4. The Medium criterion, as defined in Ref. [45], is applied to the combined tracks. The muons are required to be isolated using information from ID tracks and calorimeter energy clusters in a cone around the muon using the so-called GradientLoose criteria [45]. For each muon, the significance of the transverse impact parameter, defined by the transverse impact parameter (d0) of a muon track with respect to the beam line divided by its estimated uncertainty (σd0), is required to satisfy|d0|/σd0 < 3.0.
Events are then required to have exactly one pair of oppositely-charged muons. Muons are required to form a pair with an invariant mass of 12 GeV < mµ+µ− < 30 GeV or mµ+µ− > 30 GeV with different pµ
T conditions. The offline pµT requirements are identical to the trigger-level requirements, since the trigger efficiencies are found to be constant in the relevant pµTrange. Each of the two muons must also be matched to one of the muons reconstructed by the trigger.
In order to select exclusive events, the average longitudinal impact parameter of the two leptons is taken as the event vertex and is referred to as the dimuon vertex. The longitudinal impact parameter of each muon track with respect to the dimuon vertex multiplied by the sine of the track θ angle, is required to be less than 0.5 mm.
After these baseline selection requirements, 2.9× 10⁶dimuon candidates are found in the data.
The background to the exclusive signal includes contributions from S-diss and D-diss γγ→ µ+µ− produc-tion, as well as Z/γ∗→ µ+µ−or Z/γ∗→ τ+τ−, with less significant contamination due to t¯t and multijet production. S-diss and D-diss background contributions are estimated using MC simulation, with addi-tional data-driven normalisation of the S-diss contribution as detailed in Section6. The Z/γ∗and t¯t back-ground contributions are also estimated from simulation, and normalised using the respective inclusive cross-sections calculated at NNLO in perturbative QCD [46,47]. The background from γγ → W+W− and γγ → τ+τ−processes contributes at a level below 0.2% of the expected signal [7] and is therefore neglected. The background contribution from W+jets production is also estimated to be negligible [8]. Scale factors are applied to the simulated samples to correct for the small differences between simula-tion and data in the muon trigger, reconstrucsimula-tion and identificasimula-tion efficiencies, as well as the momentum scale and resolution [45]. The efficiencies are measured using a tag-and-probe method combining results from J/ψ → µ+µ−, Υ → µ+µ−, and Z → µ+µ− events to cover a large range in the muon transverse momentum.
The multijet background is determined using data-driven methods, similarly to the previous ATLAS ex-clusive dilepton measurement [3]. It is extracted using same-charge muon pairs that satisfy the event selection criteria, except the requirement on muon charge. The normalisation of the multijet background is determined by fitting the invariant mass spectrum of the muon pair in the data to the sum of expected contributions, including MC predictions of the signal and the prompt muon backgrounds.
5 Exclusive selection
A typical signature of exclusive γγ→ µ+µ−events is the absence of charged-particle tracks, other than muon tracks [3, 7]. In contrast, inclusive background candidates (like DY or multijet) are produced with extra particles that originate from the emission and hadronisation of additional partons [48, 49]. Therefore, in order to select exclusive γγ→ µ+µ−candidates, a veto on additional charged-particle track activity is applied. This vertex isolation requires no additional tracks with pT > 400 MeV and|η| < 2.5 near the dimuon vertex with|ztrk0 | < 1 mm, where ztrk0 is the longitudinal impact parameter of track with respect to the dimuon vertex. The value of 1 mm is optimised using the MC simulation and the expected signal significance. This value is identical to that used in Ref. [7].
Following the procedure described in Refs. [3,48], the shape of the charged-particle multiplicity distri-bution in simulated DY events is reweighted to match the spectrum observed in data. The uncorrected Z/γ∗ model overestimates the charged-particle spectrum observed in data by 50% for low-multiplicity events. In order to estimate the relevant weights, the events in the Z-mass region (defined as 70 GeV < mµ+µ− < 105 GeV) are used, since this region is expected to include a large DY contribution. The dis-tribution of the number of tracks associated with the dimuon vertex after applying the charged-particle reweighting procedure to DY simulation is shown in Figure2(a) for events in the Z-mass region. A small mismodelling of this distribution is due to the contribution from fake tracks and secondary particles [48], not taken into account in the correction procedure. Similarly to Ref. [50], the underlying event activity in DY events is found to be independent of the dimuon invariant mass, down to mµ+µ− = 12 GeV. For this reason, the same weights are applied to simulated DY events outside the Z-mass region (Figure2
(b)), and the description of charged-particle multiplicity is found to be satisfactory. To cover differences observed between the data and simulation, a 10% global uncertainty is assigned to DY MC simulation due to charged-particle multiplicity modelling.
The invariant mass distribution of muon pairs for events satisfying the 1 mm vertex isolation is presented in Figure 2 (c). The contribution from DY events is further reduced by including only events with a dimuon invariant mass below 70 GeV. In order to further suppress the background from the S-diss process, the muon pair is required to have a transverse momentum, pµT+µ−, below 1.5 GeV. This is presented in Figure2(d).
Table1presents the effect of each step of the selection on the data and the expected numbers of signal and background events.
6 Cross-section measurements
As in the previous ATLAS measurement [3], the exclusive γγ→ µ+µ−contribution is extracted by per-forming a binned maximum-likelihood fit to the measured dimuon acoplanarity (1− |∆φµ+µ−|/π)
distribu-Tracks associated with dimuon vertex10 Events 1 10 2 10 3 10 4 10 5 10 6 10 7 10 8 10 ATLAS -1 = 13 TeV, 3.2 fb s Baseline selection < 105 GeV -µ + µ 70 GeV < m Data model. uncertainty ch DY N -µ + µ → * γ Z/ Multijet -τ + τ → * γ Z/ t t -µ + µ → γ γ D-diss (post-fit) -µ + µ → γ γ S-diss (post-fit) -µ + µ → γ γ Exclusive
Tracks associated with dimuon vertex
2 3 4 5 6 7 8 910 20 30 40
Data / MC 0.8
1 1.2
(a)
Tracks associated with dimuon vertex10
Events 1 10 2 10 3 10 4 10 5 10 6 10 7 10 8 10 ATLAS -1 = 13 TeV, 3.2 fb s Baseline selection > 105 GeV -µ + µ or m < 70 GeV -µ + µ 12 GeV < m Data model. uncertainty ch DY N -µ + µ → * γ Z/ Multijet -τ + τ → * γ Z/ t t -µ + µ → γ γ D-diss (post-fit) -µ + µ → γ γ S-diss (post-fit) -µ + µ → γ γ Exclusive
Tracks associated with dimuon vertex
2 3 4 5 6 7 8 910 20 30 40 Data / MC 0.8 1 1.2 (b) [GeV] -µ + µ m 0 20 40 60 80 100 120 140 160 180 Events / 5 GeV 1 10 2 10 3 10 4 10 5 10 6 10 ATLAS -1 = 13 TeV, 3.2 fb s + 1 mm vertex isolation Baseline selection Data model. uncertainty ch DY N -µ + µ → * γ Z/ Multijet -τ + τ → * γ Z/ t t -µ + µ → γ γ D-diss (post-fit) -µ + µ → γ γ S-diss (post-fit) -µ + µ → γ γ Exclusive [GeV] -µ + µ m 0 20 40 60 80 100 120 140 160 180 Data / MC 0.8 1 1.2 (c) [GeV] -µ + µ T p 0 5 10 15 20 25 30 Events / 0.75 GeV 1 10 2 10 3 10 4 10 5 10 6 10 ATLAS -1 = 13 TeV, 3.2 fb s < 70 GeV -µ + µ + 12 GeV < m + 1 mm vertex isolation Baseline selection Data model. uncertainty ch DY N -µ + µ → * γ Z/ Multijet -τ + τ → * γ Z/ t t -µ + µ → γ γ D-diss (post-fit) -µ + µ → γ γ S-diss (post-fit) -µ + µ → γ γ Exclusive [GeV] -µ + µ T p 0 5 10 15 20 25 30 Data / MC 0.8 1 1.2 (d)
Figure 2: Illustration of event selection. The distribution of the number of charged-particle tracks at detector level after applying the charged-particle reweighting procedure to DY MC simulation for (a) the Z-mass region and (b) the invariant mass range outside the Z-mass region. (c) Dimuon invariant mass (mµ+µ−) distribution after applying
1 mm vertex isolation. (d) Transverse momentum of the dimuon system (pµT+µ−) distribution after applying 1 mm vertex isolation and requiring mµ+µ− < 70 GeV. Data are shown as points with statistical error bars, while the
histograms represent the expected signal and background levels. The dashed vertical lines and arrows indicate the signal region selection. The uncertainty band indicates 10% global uncertainty applied to DY simulation due to charged-particle multiplicity modelling. The exclusive and S-diss yields are corrected using the fit procedure described in the text. The lower panels show the ratio of data to expected event yields. Red arrows in the lower panels indicate bins where the corresponding entry falls outside the plotted range.
Total Z/γ∗ Z/γ∗
Data Signal background S-diss D-diss → µ+µ− → τ+τ− Multijet t¯t
Baseline selection 2 933 384 5740 2 897 000 8640 8000 2 268 000 10 900 590 000 12 200 1 mm vertex isolation 14 759 4560 11 100 6840 300 3900 30 50 0 mµ+µ−< 70 GeV 12 395 4420 8800 6420 300 2000 30 50 0 pµT+µ−< 1.5 GeV 7952 4370 4300 3550 60 670 7 10 0
Table 1: Effect of sequential selection requirements on the number of events observed in data, compared to the numbers of predicted signal and background events.
tion. The acoplanarity variable is not affected by the muon momentum scale and resolution uncertainties and provides a good separation of signal from background. Templates from MC simulation are used for the signal, DY, S-diss and D-diss processes. Contributions from other background sources are found to be negligible. The fit determines two parameters: the expected number of signal events and the ex-pected number of S-diss events. The D-diss and DY contributions are fixed to their corresponding MC predictions in the fit procedure.
The dimuon acoplanarity distribution in data overlaid with the result of the fit to the shapes from MC simulation is shown in Figure3for the fiducial region.
The cross-section measurements presented here correspond to the fiducial region defined in Table2. The fiducial cross-section for the process pp(γγ)→ µ+µ−ppis determined according to
σexcl. fid.γγ→µ+µ− = Nexcl. Lint× C , acoplanarity -µ + µ 0 0.01 0.02 0.03 0.04 0.05 0.06 Events / 0.002 500 1000 1500 2000 2500 ATLAS -1 = 13 TeV, 3.2 fb s < 70 GeV -µ + µ 12 GeV < m Data (post-fit) -µ + µ → γ γ Exclusive (post-fit) -µ + µ → γ γ S-diss -µ + µ → * γ + Z/ -µ + µ → γ γ D-diss acoplanarity -µ + µ 0 0.01 0.02 0.03 0.04 0.05 0.06 Data / MC 0.8 1 1.2
Figure 3: Dimuon acoplanarity distribution after signal selection requirements. Data are shown as points with statistical error bars, while the histograms, in top-to-bottom order, represent the simulated exclusive signal, the S-diss and the sum of D-diss and DY backgrounds. The exclusive and S-diss yields are determined from the fit described in the text. The last bin includes overflow events. The lower panel shows the ratio of data to the predicted distribution. Red arrow in the lower panel indicates a bin where the corresponding entry falls outside the plotted range.
Invariant mass range pµTrequirement |ηµ| requirement 12 GeV < mµ+µ−< 30 GeV > 6 GeV < 2.4
30 GeV < mµ+µ−< 70 GeV > 10 GeV < 2.4
Table 2: Definition of the fiducial region for which the cross-sections are evaluated.
where Nexcl. is the total number of signal events extracted using the log-likelihood fit procedure, Lint is the integrated luminosity of the data sample and C is the overall correction factor that accounts for efficiencies and resolution effects. The C factor is defined as the ratio of the number of reconstructed MC signal events passing the selection to the number of generated MC signal events satisfying the fiducial requirements.
The cross-section for exclusive dimuon production is also measured differentially in four bins of mµ+µ− from 12 GeV to 70 GeV. The bin widths are chosen to ensure purity above 90%, where purity is defined as the fraction of reconstructed signal events in a given bin of mµ+µ−which were also generated in the same bin. The differential measurement is unfolded for resolution effects using the signal simulation sample and a bin-by-bin correction procedure. The differential fiducial cross-section as a function of the dimuon invariant mass is calculated as
dσexcl.γγ→µ+µ− dmµ+µ− i = N i excl. Lint× Ci× (∆m)i , (1)
where Nexcl.i is the number of signal events recorded in the i-th invariant mass bin, Ci is the correction factor in bin i and (∆m)iis the width of the bin.
7 Systematic uncertainties
The systematic uncertainties in the measurement enter the cross-sections determination through the cal-culation of the correction factors (Ci), the extracted number of signal events (Nexcl.i ), or the estimation of Lint.
The systematic uncertainties are classified as correlated or uncorrelated across the measurement bins. The correlated contributions are propagated by the offset method in which the values from each source are coherently shifted upwards and downwards by one standard deviation and the magnitude of the change in the measurement is computed. The sign of the uncertainty corresponds to a one standard deviation upward shift of the uncertainty source. The uncorrelated sources are propagated using the pseudo-experiment method in which the correction factors used to improve the modelling of data by the simulation are randomly shifted in an ensemble of pseudo-experiments according to the mean and standard deviation of the correction factor. The resulting uncertainty in the measured cross-sections is determined from the variance of the measurements for the ensemble.
Muon-related sources: Uncertainties related to the muon trigger and selection efficiencies are studied using the J/ψ→ µ+µ−, Υ→ µ+µ−and Z→ µ+µ−processes, and a tag-and-probe method [14]. The muon trigger efficiency is estimated in simulation, with a dedicated data-driven analysis per-formed to obtain the simulation-to-data correction factors and the corresponding uncertainties. The
uncertainty in the correction factors Ciin Eqn. (1) due to the statistical (δtrig.stat.) and systematic (δtrig.syst.) uncertainties in the trigger efficiency are around 0.3% and 0.9% respectively.
The muon selection efficiencies as determined from simulation are corrected with simulation-to-data correction factors, which have associated statistical and systematic uncertainties. These contri-butions to the systematic uncertainty also affect Ci, and are denoted by δreco.stat. and δreco.syst. respectively. The δreco.stat. value is approximately 0.1% and the δreco.syst. value is around 1.0%.
Uncertainties in the muon momentum calibration can cause a change of acceptance because of migration of events across the muon pTthresholds and mµ+µ−boundaries. They are obtained from a comparison of the J/ψ and Z boson invariant mass distributions in data and simulation [45]. When propagated to the correction factors, this source is found to be below 0.5%. This contribution is denoted by δsc./res..
Vertex isolation efficiency: Since the dimuon vertex in each event occurs randomly within the Gaussian luminous region, the 1 mm dimuon vertex isolation efficiency is extracted from the data as follows: for each event i, a point zi is randomly chosen from a Gaussian distribution corresponding to the longitudinal shape of the luminous region, excluding a range of 20 mm centred about the dimuon vertex. This region is excluded to ensure any activity around point zi is unrelated to the dimuon vertex. In some events, the point zi is near tracks caused e.g. by pile-up interactions. The vertex isolation efficiency is defined as the fraction of events for which zi has no track within 1 mm. This efficiency, as measured in data, is compared with simulation in Figure4as a function of the number of reconstructed vertices (Nvtx). The average number of reconstructed vertices per event observed in data is approximately 9. In general, good agreement between the data and simulation is observed, with a small systematic difference of 1–2% observed in the region 8 < Nvtx < 12, which impacts the Ciby 1.1% and this is taken as a systematic uncertainty.
It was also checked that the vertex isolation efficiency is well modelled by simulation for arbitrary choice of vertex isolation size.
Modelling of the muon impact parameter resolution may affect the vertex isolation efficiency and can give rise to additional systematic effects. This is estimated by varying the muon impact para-meter resolution in simulation to match the shapes observed in data, and the impact on the cross-sections is found to be 0.3%.
In total, the resulting uncertainty in the correction factors due to estimation of the vertex isolation efficiency is found to be δveto = 1.2%.
Pile-up description: The systematic effect related to the pile-up modelling is estimated from the com-parison between data and simulation of the pT- and η-dependent density of tracks originating from pile-up, as in Refs. [3,48]. The resulting uncertainty in Ciis found to be δPU = 0.5% and is fully correlated with the δveto.
Background: The uncertainty in the contribution of the DY process mainly accounts for disagreement between the data and simulation in charged-particle multiplicity modelling (10%). It also includes a 5% contribution due to the PDF and scale uncertainties [51]. An overall normalisation uncertainty of 20% is assigned to cover these effects. Because of the similar shapes of the DY and S-diss γγ→ µ+µ−components in the fitted acoplanarity distribution, the uncertainty in the DY normalisation is partly absorbed by the S-diss contribution. The 20% uncertainty has typically a 0.7% effect on the extracted number of signal events.
vtx
N
2 4 6 8 10 12 14 16 18 20
1 mm vertex isolation efficiency 0.2 0.4 0.6 0.8 1 1.2 -1 = 13 TeV, 3.2 fb s ATLAS (data) vtx dN evt dN evt N1 Data Signal MC vtx N 2 4 6 8 10 12 14 16 18 20 Data / MC0.950.9 1 1.051.1
Figure 4: Dimuon vertex isolation efficiency for 1 mm requirement extracted from the data (black points) and signal MC simulation (red squares) as a function of the number of reconstructed vertices Nvtx. The distribution in the data
is built according to the procedure described in the text. The normalised Nvtxdistribution for data is shown as the
dashed histogram.
In order to estimate the D-diss γγ→ µ+µ−uncertainty, this contribution is varied according to the photon PDF uncertainties, defined at 68% confidence level and evaluated using NNPDF2.3QED replicas [26]. The D-diss background uncertainty produces an uncertainty of 0.2% in the cross-sections, which is consistent with the full difference between the predictions obtained with the NNPDF2.3QED, CT14QED [27] and LUXqed17 [28] central values.
The impact of these two background uncertainty sources is added in quadrature, yielding the un-certainty in Ni
excl.(δbkg.), which is less than 0.8%.
Template shape: The default signal acoplanarity template is constructed using bare EPA predictions from Herwig. When using the acoplanarity templates from SuperChic2 or from Ref. [11], the extracted number of signal events is lower by 2–3%, which is taken as a systematic uncertainty. The impact of the proton elastic form-factor modelling on the signal acoplanarity template is evaluated in a similar way to Ref. [3] and takes into account differences between various parameterisations of proton EM form factors. This has a 0.4% effect on the extracted number of signal events. The impact of the shape uncertainty in the S-diss template is evaluated by varying the pµT+µ− re-quirement between 1 GeV and 2 GeV. The maximum deviation of Nexcl.i from the nominal value is observed to be 0.8% and is taken as a systematic uncertainty. In order to assign uncertainty due to the choice of proton structure functions in Lpair, an alternative set from Ref. [52] is used. This impacts the Nexcl.i by about 2.0% and is taken as a systematic uncertainty.
When added in quadrature, these contributions are listed as δshapes.
LHC beam effects: The impact of the non-zero crossing angles of the LHC beams at the ATLAS interac-tion point is estimated by applying a Lorentz transformainterac-tion to the generator-level lepton kinematics for signal MC events. This results in a negligible variation of the cross-sections. The LHC beam energy uncertainty is estimated to be 0.1% [53]. It affects the cross-sections by less than 0.1% and is considered to be a negligible effect.
Unfolding method: The bin-by-bin correction used in the calculation of the cross-sections is compared to an iterative Bayesian unfolding technique [54]. The differences between these two approaches are found to be negligible.
Luminosity: The uncertainty in Lint is estimated to be δlumi. = 2.1%. It is derived, following a meth-odology similar to that detailed in Ref. [55], from a calibration of the luminosity scale using x–y beam-separation scans performed in August 2015.
Other cross-checks: To check the impact of MC modeling of neutral particles in the background pro-cesses, the analysis is repeated at generator level by requiring no extra neutral particle with pT > 400 MeV and|η| < 2.5, in addition to the charged-particle exclusive selection. This extra require-ment shows negligible impact on the analysis.
In similar generator-level studies, the pT threshold for charged particles is lowered to 100 MeV. The MC event yields for the dominant S-diss and a smaller D-diss background processes remain unchanged. For DY background the yield is suppressed by 80%. No additional systematic uncer-tainty is, however, assigned as the DY contribution is constrained using Z-mass control region for a nominal selection with a total uncertainty of 20%.
A summary of all systematic uncertainties is given in Table3.
8 Results
The fiducial cross-section is measured to be σexcl. fid.
γγ→µ+µ−= 3.12 ± 0.07 (stat.) ± 0.14 (syst.) pb .
This value can be compared to the bare EPA predictions from Herwig, σEPAγγ→µ+µ− = 3.56 ± 0.05 pb, to the EPA predictions corrected for absorptive effects using the finite-size parameterisation, σEPA, corr.γγ→µ+µ− = 3.06 ± 0.05 pb, or to the SuperChic2 predictions, σSC2γγ→µ+µ− = 3.45 ± 0.05 pb. The theory uncertainties include uncertainties related to the knowledge of proton elastic form factors (1.5%), and those originat-ing from the higher-order electroweak corrections [56] not included in the calculations (0.7%). These uncertainties are evaluated in a similar way as in Ref. [3].
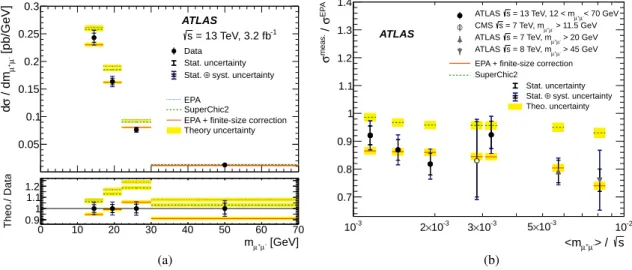
The measured differential fiducial cross-sections as a function of dimuon invariant mass, together with the breakdown of the systematic uncertainties for the correlated and uncorrelated sources, are given in Table3. The comparison between the measured cross-sections and the theoretical predictions is shown in Figure 5 (a). The EPA predictions corrected for absorptive effects are in good agreement with the measured cross-sections. The total systematic uncertainty of the measurement is dominated by shape modelling uncertainties, which can be reduced by tagging outgoing protons with dedicated forward de-tectors [57,58].
It is expected that absorptive effects in two-photon interactions in pp collisions depend on the proton en-ergy fractions passed to the quasi-real photons (denoted by x1and x2) [11,12]. Therefore, it is interesting to study the evolution of the survival factor, defined as the ratio of measured cross-section to the bare EPA predictions, as a function of the average dimuon invariant mass. Indeed, since m2µ+µ−/s = x1x2, where s is the pp centre-of-mass energy squared, the average values can be obtained:
Uncorrelated Correlated mµ+ µ− Niexcl. Ci dσ/dmµ+ µ− δstat. δsyst. δtrig.stat. δreco.stat. δ
trig.
syst. δreco.syst. δsc./res. δveto δPU δbkg. δshapes δlumi.
[GeV] [pb/GeV] [%] [%] [%] [%] [%] [%] [%] [%] [%] [%] [%] [%] 12–17 1290± 60 0.333±0.007 0.243± 0.013 3.4 4.3 0.3 0.1 0.9 0.9 -0.4 -1.2 -0.5 0.8 3.0 2.1 17–22 1040± 50 0.398±0.008 0.164± 0.010 3.7 4.5 0.3 0.1 0.9 1.0 -0.4 -1.2 -0.5 0.8 3.3 2.1 22–30 830± 40 0.428±0.009 0.076± 0.005 3.9 4.6 0.2 0.1 0.9 1.0 -0.2 -1.2 -0.5 0.6 3.5 2.1 30–70 690± 40 0.416±0.008 0.013± 0.001 4.9 4.9 0.3 0.1 1.0 1.1 -0.3 -1.2 -0.5 0.4 4.0 2.1 12–70 3850±160 0.387±0.008 0.054± 0.003 2.1 4.5 0.3 0.1 0.9 1.0 -0.3 -1.2 -0.5 0.8 3.3 2.1
Table 3: The measured exclusive γγ→ µ+µ−differential fiducial cross-sections, dσ/dm
µ+µ−. The extracted number
of signal events (Ni
excl.) and correction factors (Ci) are also shown. The measurements are listed together with
the statistical (δstat.), and total systematic (δsyst.) uncertainties. In addition, the contributions from the individual
correlated and uncorrelated systematic error sources are provided. The last row lists dσ/dmµ+µ−in the total fiducial
region. The uncertainties in Ni
excl. correspond to the combined statistical and systematic uncertainties. These are
correlated across mµ+µ−bins.
[GeV] -µ + µ m 0 10 20 30 40 50 60 70 [pb/GeV] -µ + µ / dm σ d 0.05 0.1 0.15 0.2 0.25 0.3 -1 = 13 TeV, 3.2 fb s ATLAS Data Stat. uncertainty syst. uncertainty ⊕ Stat. EPA SuperChic2
EPA + finite-size correction Theory uncertainty [GeV] -µ + µ m 0 10 20 30 40 50 60 70 Theo./ Data 0.9 1 1.1 1.2 (a) s > / -µ + µ <m -3 10 2×10⁻³ 3×10⁻³ -2 10 E P A σ / meas. σ 0.7 0.8 0.9 1 1.1 1.2 1.3 1.4 ATLAS < 70 GeV -µ + µ = 13 TeV, 12 < m s ATLAS > 11.5 GeV -µ + µ = 7 TeV, m s CMS > 20 GeV -µ + µ = 7 TeV, m s ATLAS > 45 GeV -µ + µ = 8 TeV, m s ATLAS
EPA + finite-size correction SuperChic2 Stat. uncertainty syst. uncertainty ⊕ Stat. Theo. uncertainty -3 10 × 5 (b)
Figure 5: (a) The exclusive γγ → µ+µ−differential fiducial cross-section measurements as a function of dimuon invariant mass mµ+µ−. (b) Comparison of the ratios of measured and predicted cross-sections to the bare EPA
calculations as a function of the average dimuon invariant mass scaled to the pp centre-of-mass energy used. Data (markers) are compared to various predictions (lines). Full circle markers represent the four mass points presented in this paper, while open circle, up-triangle and down-triangle depict the previous results obtained with mµ+µ− > 11.5 GeV [2], mµ+µ− > 20 GeV [3] and mµ+µ− > 45 GeV [7] requirements on the dimuon invariant mass. The inner error bars represent the statistical uncertainties, and the outer bars represent the total uncertainty in each measurement. The yellow bands represent the theoretical uncertainty in the predictions. The bottom panel in (a) shows the ratio of the predictions to the data.
since at mid-rapidity (yµ+µ−≈ 0) one has x1≈ x2.
Figure5(b) shows the evolution of the survival factor as a function of the average dimuon invariant mass scaled by a given pp centre-of-mass energy. Exclusive two-photon production of muon pairs in pp col-lisions at the LHC has been studied by the CMS experiment at √s = 7 TeV for mµ+µ− > 11.5 GeV [2]. The ATLAS experiment measured exclusive production of muons at √s = 7 TeV in the region mµ+µ− > 20 GeV [3]. Recently the production of exclusive γγ → µ+µ− at √s = 8 TeV was also studied by ATLAS in the context of exclusive γγ → W+W−measurement [7]. The probed invariant mass region in this case is mµ+µ− > 45 GeV. The hmµ+µ−i for different measurements is calculated using the Her-wig generator and corresponding fiducial region definitions. The deviations from unity of the ratios of
measured cross-sections to the bare EPA-based predictions from Herwig increase slightly with the en-ergy scalehmµ+µ−i/√s. This indicates that the size of the absorptive corrections tends to increase with hmµ+µ−i/√s.
The measurements are also compared to two model predictions that differ in the implementation of the absorptive corrections. While the finite-size parameterisation of absorptive effects describes the data reasonably well, mismodelling at the level of 10–20% is observed with SuperChic2. Moreover, at large masses, SuperChic2 predicts less steeper decrease of the survival factor as a function ofhxi. For example, the survival factor for fully exclusive γγ→ W+W−production at √s = 13 TeV is 0.82 [12] or 0.65 [11], respectively. A larger suppression of the EPA cross-sections in the finite-size approach is obtained by requiring that only photons outside the proton (with rp = 0.64 fm) can initiate the exclusive photon-induced process.
9 Summary
A measurement of the cross-sections for exclusive γγ → µ+µ− production in pp collisions at √s = 13 TeV with the ATLAS detector at the LHC is presented. The measurement uses a data set corresponding to an integrated luminosity of 3.2 fb−1. The fiducial cross-section in the dimuon invariant mass range of 12 GeV < mµ+µ− < 70 GeV is measured to be σexcl. fid.
γγ→µ+µ− = 3.12 ± 0.07 (stat.) ± 0.14 (syst.) pb. The differential cross-sections as a function of the dimuon invariant mass are also measured.
The cross-sections are compared to theoretical predictions which include corrections for absorptive ef-fects. The finite-size parameterisation of absorptive corrections provides a good description of the data, yielding σexcl. fid.γγ→µ+µ− = 3.06 ± 0.05 pb. It is observed that the absorptive corrections tend to increase with the energy fraction of protons passed to the initial-state photons. The precision of the measurement can be improved by using dedicated forward proton detectors.
Acknowledgements
We thank CERN for the very successful operation of the LHC, as well as the support staff from our institutions without whom ATLAS could not be operated efficiently.
We acknowledge the support of ANPCyT, Argentina; YerPhI, Armenia; ARC, Australia; BMWFW and FWF, Austria; ANAS, Azerbaijan; SSTC, Belarus; CNPq and FAPESP, Brazil; NSERC, NRC and CFI, Canada; CERN; CONICYT, Chile; CAS, MOST and NSFC, China; COLCIENCIAS, Colombia; MSMT CR, MPO CR and VSC CR, Czech Republic; DNRF and DNSRC, Denmark; IN2P3-CNRS, CEA-DRF/IRFU, France; SRNSF, Georgia; BMBF, HGF, and MPG, Germany; GSRT, Greece; RGC, Hong Kong SAR, China; ISF, I-CORE and Benoziyo Center, Israel; INFN, Italy; MEXT and JSPS, Ja-pan; CNRST, Morocco; NWO, Netherlands; RCN, Norway; MNiSW and NCN, Poland; FCT, Portugal; MNE/IFA, Romania; MES of Russia and NRC KI, Russian Federation; JINR; MESTD, Serbia; MSSR, Slovakia; ARRS and MIZŠ, Slovenia; DST/NRF, South Africa; MINECO, Spain; SRC and Wallen-berg Foundation, Sweden; SERI, SNSF and Cantons of Bern and Geneva, Switzerland; MOST, Taiwan; TAEK, Turkey; STFC, United Kingdom; DOE and NSF, United States of America. In addition, indi-vidual groups and members have received support from BCKDF, the Canada Council, CANARIE, CRC, Compute Canada, FQRNT, and the Ontario Innovation Trust, Canada; EPLANET, ERC, ERDF, FP7,
Horizon 2020 and Marie Skłodowska-Curie Actions, European Union; Investissements d’Avenir Labex and Idex, ANR, Région Auvergne and Fondation Partager le Savoir, France; DFG and AvH Foundation, Germany; Herakleitos, Thales and Aristeia programmes co-financed by EU-ESF and the Greek NSRF; BSF, GIF and Minerva, Israel; BRF, Norway; CERCA Programme Generalitat de Catalunya, Generalitat Valenciana, Spain; the Royal Society and Leverhulme Trust, United Kingdom.
The crucial computing support from all WLCG partners is acknowledged gratefully, in particular from CERN, the ATLAS Tier-1 facilities at TRIUMF (Canada), NDGF (Denmark, Norway, Sweden), CC-IN2P3 (France), KIT/GridKA (Germany), INFN-CNAF (Italy), NL-T1 (Netherlands), PIC (Spain), ASGC (Taiwan), RAL (UK) and BNL (USA), the Tier-2 facilities worldwide and large non-WLCG resource pro-viders. Major contributors of computing resources are listed in Ref. [59].
References
[1] J. de Favereau de Jeneret et al., High energy photon interactions at the LHC, (2009), arXiv:0908.2020 [hep-ph].
[2] CMS Collaboration, Exclusive γγ→ µ+µ−production in proton-proton collisions at √s= 7 TeV,
JHEP 01 (2012) 052, arXiv:1111.5536 [hep-ex].
[3] ATLAS Collaboration, Measurement of exclusive γγ→ `+`−production in proton-proton collisions at √s= 7 TeV with the ATLAS detector,Phys. Lett. B 749 (2015) 242,
arXiv:1506.07098 [hep-ex].
[4] CMS Collaboration, Search for exclusive or semi-exclusive γγ production and observation of exclusive and semi-exclusive e+e−production in pp collisions at √s= 7 TeV,
JHEP 11 (2012) 080, arXiv:1209.1666 [hep-ex].
[5] CMS Collaboration, Study of exclusive two-photon production of W+W−in pp collisions at √
s= 7 TeV and constraints on anomalous quartic gauge couplings,JHEP 07 (2013) 116, arXiv:1305.5596 [hep-ex].
[6] CMS Collaboration, Evidence for exclusive γγ→ W+W−production and constraints on anomalous quartic gauge couplings in pp collisions at √s= 7 and 8 TeV,JHEP 08 (2016) 119, arXiv:1604.04464 [hep-ex].
[7] ATLAS Collaboration, Measurement of exclusive γγ→ W+W−production and search for exclusive Higgs boson production in pp collisions at √s= 8 TeV using the ATLAS detector,
Phys. Rev. D 94 (2016) 032011, arXiv:1607.03745 [hep-ex].
[8] ATLAS Collaboration, Measurement of the low-mass Drell-Yan di√ fferential cross section at s= 7 TeV using the ATLAS detector,JHEP 06 (2014) 112, arXiv:1404.1212 [hep-ex]. [9] ATLAS Collaboration, Measurement of the transverse momentum and φ∗ηdistributions of
Drell–Yan lepton pairs in proton–proton collisions at √s= 8 TeV with the ATLAS detector,
Eur. Phys. J. C 76 (2016) 291, arXiv:1512.02192 [hep-ex].
[10] ATLAS Collaboration, Measurement of the double-differential high-mass Drell-Yan cross section in pp collisions at √s= 8 TeV with the ATLAS detector,JHEP 08 (2016) 009,
[11] M. Dyndal and L. Schoeffel, The role of finite-size effects on the spectrum of equivalent photons in proton-proton collisions at the LHC,Phys. Lett. B 741 (2015) 66,
arXiv:1410.2983 [hep-ph].
[12] L. A. Harland-Lang, V. A. Khoze and M. G. Ryskin,
Exclusive physics at the LHC with SuperChic 2,Eur. Phys. J. C 76 (2016) 9, arXiv:1508.02718 [hep-ph].
[13] ATLAS Collaboration, The ATLAS Experiment at the CERN Large Hadron Collider,
JINST 3 (2008) S08003.
[14] ATLAS Collaboration, Performance of the ATLAS Trigger System in 2015,
Eur. Phys. J. C 77 (2017) 317, arXiv:1611.09661 [hep-ex].
[15] M.-S. Chen, I. Muzinich, H. Terazawa and T. Cheng,
Lepton pair production from two-photon processes,Phys. Rev. D 7 (1973) 3485.
[16] V. M. Budnev, I. F. Ginzburg, G. V. Meledin and V. Serbo, The process pp→ ppe+e−and the possibility of its calculation by means of quantum electrodynamics only,
Nucl. Phys. B 63 (1973) 519.
[17] V. M. Budnev, I. F. Ginzburg, G. V. Meledin and V. G. Serbo, The two photon particle production mechanism. Physical problems. Applications. Equivalent photon approximation,
Phys. Rept. 15 (1975) 181.
[18] M. Bähr, S. Gieseke, M. Gigg, D. Grellscheid, K. Hamilton et al., Herwig++ physics and manual,
Eur. Phys. J. C 58 (2008) 639, arXiv:0803.0883 [hep-ph].
[19] J. Bellm et al., Herwig 7.0/Herwig++ 3.0 release note,Eur. Phys. J. C 76 (2016) 196, arXiv:1512.01178 [hep-ph].
[20] J. A. M. Vermaseren, Two-photon processes at very high energies,Nucl. Phys. B 229 (1983) 347. [21] F. W. Brasse et al.,
Parametrization of the q2dependence ofγVp total cross sections in the resonance region,
Nucl. Phys. B 110 (1976) 413.
[22] A. Suri and D. R. Yennie,
The space-time phenomenology of photon absorption and inelastic electron scattering,
Annals Phys. 72 (1972) 243.
[23] T. Sjöstrand, High-energy physics event generation with PYTHIA 5.7 and JETSET 7.4,
Comput. Phys. Commun. 82 (1994) 74.
[24] B. Andersson, G. Gustafson, G. Ingelman and T. Sjöstrand,
Parton fragmentation and string dynamics,Phys. Rept. 97 (1983) 31.
[25] T. Sjöstrand, S. Mrenna and P. Z. Skands, A brief introduction to PYTHIA 8.1,
Comput. Phys. Commun. 178 (2008) 852, arXiv:0710.3820 [hep-ph].
[26] NNPDF Collaboration, R. D. Ball et al., Parton distributions with QED corrections,
Nucl. Phys. B 877 (2013) 290, arXiv:1308.0598 [hep-ph].
[27] C. Schmidt, J. Pumplin, D. Stump and C. P. Yuan, CT14QED parton distribution functions from isolated photon production in deep inelastic scattering,Phys. Rev. D 93 (2016) 114015,
arXiv:1509.02905 [hep-ph].
[28] A. V. Manohar, P. Nason, G. P. Salam and G. Zanderighi, The Photon Content of the Proton,
[29] R. Corke and T. Sjöstrand, Multiparton interactions and rescattering,JHEP 01 (2010) 035, arXiv:0911.1909 [hep-ph].
[30] P. Nason, A new method for combining NLO QCD with shower Monte Carlo algorithms,
JHEP 11 (2004) 040, arXiv:hep-ph/0409146.
[31] S. Frixione, P. Nason and C. Oleari,
Matching NLO QCD computations with parton shower simulations: the POWHEG method,
JHEP 11 (2007) 070, arXiv:0709.2092 [hep-ph].
[32] S. Alioli, P. Nason, C. Oleari and E. Re,
NLO vector-boson production matched with shower in POWHEG,JHEP 07 (2008) 060, arXiv:0805.4802 [hep-ph].
[33] S. Alioli, P. Nason, C. Oleari and E. Re, A general framework for implementing NLO calculations in shower Monte Carlo programs: the POWHEG BOX,JHEP 06 (2010) 043,
arXiv:1002.2581 [hep-ph].
[34] H.-L. Lai, M. Guzzi, J. Huston, Z. Li, P. M. Nadolsky et al.,
New parton distributions for collider physics,Phys. Rev. D 82 (2010) 074024, arXiv:1007.2241 [hep-ph].
[35] ATLAS Collaboration, Measurement of the Z/γ∗boson transverse momentum distribution in pp collisions at √s= 7 TeV with the ATLAS detector,JHEP 09 (2014) 145,
arXiv:1406.3660 [hep-ex].
[36] J. Pumplin, D. Stump, J. Huston, H. Lai, P. M. Nadolsky et al.,
New generation of parton distributions with uncertainties from global QCD analysis,
JHEP 07 (2002) 012, arXiv:hep-ph/0201195.
[37] T. Sjöstrand, S. Mrenna and P. Z. Skands, PYTHIA 6.4 physics and manual,JHEP 05 (2006) 026, arXiv:hep-ph/0603175.
[38] P. Golonka and Z. Was,
PHOTOS Monte Carlo: a precision tool for QED corrections in Z and W decays,
Eur. Phys. J. C 45 (2006) 97, arXiv:hep-ph/0506026.
[39] N. Davidson, T. Przedzinski and Z. Was,
PHOTOS interface in C++: technical and physics documentation,
Comput. Phys. Commun. 199 (2016) 86, arXiv:1011.0937 [hep-ph].
[40] ATLAS Collaboration, Summary of ATLAS Pythia 8 tunes, ATL-PHYS-PUB-2012-003 (2012),
url:https://cds.cern.ch/record/1474107.
[41] S. Agostinelli et al., GEANT4: A simulation toolkit,Nucl. Instrum. Meth. A 506 (2003) 250. [42] ATLAS Collaboration, The ATLAS Simulation Infrastructure,Eur. Phys. J. C 70 (2010) 823,
arXiv:1005.4568 [physics.ins-det].
[43] L. Frankfurt, C. E. Hyde, M. Strikman and C. Weiss,
Generalized parton distributions and rapidity gap survival in exclusive diffractive pp scattering,
Phys. Rev. D 75 (2007) 054009, arXiv:hep-ph/0608271.
[44] M. G. Ryskin, A. D. Martin and V. A. Khoze,
High-energy strong interactions: from ‘hard’ to ‘soft’,Eur. Phys. J. C 71 (2011) 1617, arXiv:1102.2844 [hep-ph].
[45] ATLAS Collaboration, Muon reconstruction performance of the ATLAS detector in proton–proton collision data at √s=13 TeV,Eur. Phys. J. C 76 (2016) 292, arXiv:1603.05598 [hep-ex]. [46] C. Anastasiou, L. J. Dixon, K. Melnikov and F. Petriello, High precision QCD at hadron
colliders: Electroweak gauge boson rapidity distributions at next-to-next-to leading order,
Phys. Rev. D 69 (2004) 094008, arXiv:hep-ph/0312266.
[47] M. Czakon and A. Mitov,
Top++: A program for the calculation of the top-pair cross-section at hadron colliders,
Comput. Phys. Commun. 185 (2014) 2930, arXiv:1112.5675 [hep-ph].
[48] ATLAS Collaboration, Measurement of distributions sensitive to the underlying event in inclusive Z-boson production in pp collisions at √s= 7 TeV with the ATLAS detector,
Eur. Phys. J. C 74 (2014) 3195, arXiv:1409.3433 [hep-ex].
[49] ATLAS Collaboration, Measurement of event-shape observables in Z→ `+`−events in pp collisions at √s= 7 TeV with the ATLAS detector at the LHC,Eur. Phys. J. C 76 (2016) 375, arXiv:1602.08980 [hep-ex].
[50] CMS Collaboration, Measurement of the underlying event in the Drell-Yan process in proton-proton collisions at √s= 7 TeV,Eur. Phys. J. C 72 (2012) 2080,
arXiv:1204.1411 [hep-ex].
[51] ATLAS Collaboration, Measurement of W±and Z-boson production cross sections in pp collisions at √s= 13 TeV with the ATLAS detector,Phys. Lett. B 759 (2016) 601, arXiv:1603.09222 [hep-ex].
[52] G. G. da Silveira, L. Forthomme, K. Piotrzkowski, W. Schaefer and A. Szczurek, Central µ+µ− production via photon-photon fusion in proton-proton collisions with proton dissociation,
JHEP 02 (2015) 159, arXiv:1409.1541 [hep-ph].
[53] E. Todesco and J. Wenninger, Large Hadron Collider momentum calibration and accuracy,
Phys. Rev. Accel. Beams 20 (2017) 081003.
[54] G. D’Agostini, A multidimensional unfolding method based on Bayes’ theorem,
Nucl. Instrum. Meth. A 362 (1995) 487.
[55] ATLAS Collaboration,
Luminosity determination in pp collisions at √s= 8 TeV using the ATLAS detector at the LHC,
Eur. Phys. J. C 76 (2016) 653, arXiv:1608.03953 [hep-ex].
[56] A. Denner and S. Dittmaier,
Production of light fermion anti-fermion pairs in gamma gamma collisions,
Eur. Phys. J. C 9 (1999) 425, arXiv:hep-ph/9812411.
[57] CMS and TOTEM Collaborations, CMS-TOTEM Precision Proton Spectrometer,
CMS-TDR-13, TOTEM-TDR-003 (2014), url:https://cds.cern.ch/record/1753795.
[58] ATLAS Collaboration, Technical Design Report for the ATLAS Forward Proton Detector,
ATLAS-TDR-024 (2015), url:https://cds.cern.ch/record/2017378.
[59] ATLAS Collaboration, ATLAS computing acknowledgements 2016–2017,
The ATLAS Collaboration
M. Aaboud137d, G. Aad88, B. Abbott115, O. Abdinov12,∗, B. Abeloos119, S.H. Abidi161,
O.S. AbouZeid139, N.L. Abraham151, H. Abramowicz155, H. Abreu154, R. Abreu118, Y. Abulaiti148a,148b, B.S. Acharya167a,167b,a, S. Adachi157, L. Adamczyk41a, J. Adelman110, M. Adersberger102, T. Adye133, A.A. Affolder139, Y. Afik154, T. Agatonovic-Jovin14, C. Agheorghiesei28c, J.A. Aguilar-Saavedra128a,128f, S.P. Ahlen24, F. Ahmadov68,b, G. Aielli135a,135b, S. Akatsuka71, H. Akerstedt148a,148b, T.P.A. Åkesson84, E. Akilli52, A.V. Akimov98, G.L. Alberghi22a,22b, J. Albert172, P. Albicocco50, M.J. Alconada Verzini74, S.C. Alderweireldt108, M. Aleksa32, I.N. Aleksandrov68, C. Alexa28b, G. Alexander155,
T. Alexopoulos10, M. Alhroob115, B. Ali130, M. Aliev76a,76b, G. Alimonti94a, J. Alison33, S.P. Alkire38, B.M.M. Allbrooke151, B.W. Allen118, P.P. Allport19, A. Aloisio106a,106b, A. Alonso39, F. Alonso74, C. Alpigiani140, A.A. Alshehri56, M.I. Alstaty88, B. Alvarez Gonzalez32, D. Álvarez Piqueras170, M.G. Alviggi106a,106b, B.T. Amadio16, Y. Amaral Coutinho26a, C. Amelung25, D. Amidei92, S.P. Amor Dos Santos128a,128c, S. Amoroso32, G. Amundsen25, C. Anastopoulos141, L.S. Ancu52, N. Andari19, T. Andeen11, C.F. Anders60b, J.K. Anders77, K.J. Anderson33, A. Andreazza94a,94b, V. Andrei60a, S. Angelidakis37, I. Angelozzi109, A. Angerami38, A.V. Anisenkov111,c, N. Anjos13, A. Annovi126a,126b, C. Antel60a, M. Antonelli50, A. Antonov100,∗, D.J. Antrim166, F. Anulli134a, M. Aoki69, L. Aperio Bella32, G. Arabidze93, Y. Arai69, J.P. Araque128a, V. Araujo Ferraz26a, A.T.H. Arce48, R.E. Ardell80, F.A. Arduh74, J-F. Arguin97, S. Argyropoulos66, M. Arik20a, A.J. Armbruster32, L.J. Armitage79, O. Arnaez161, H. Arnold51, M. Arratia30, O. Arslan23,
A. Artamonov99,∗, G. Artoni122, S. Artz86, S. Asai157, N. Asbah45, A. Ashkenazi155, L. Asquith151, K. Assamagan27, R. Astalos146a, M. Atkinson169, N.B. Atlay143, K. Augsten130, G. Avolio32, B. Axen16, M.K. Ayoub35a, G. Azuelos97,d, A.E. Baas60a, M.J. Baca19, H. Bachacou138, K. Bachas76a,76b,
M. Backes122, P. Bagnaia134a,134b, M. Bahmani42, H. Bahrasemani144, J.T. Baines133, M. Bajic39, O.K. Baker179, P.J. Bakker109, E.M. Baldin111,c, P. Balek175, F. Balli138, W.K. Balunas124, E. Banas42, A. Bandyopadhyay23, Sw. Banerjee176,e, A.A.E. Bannoura178, L. Barak155, E.L. Barberio91,
D. Barberis53a,53b, M. Barbero88, T. Barillari103, M-S Barisits32, J.T. Barkeloo118, T. Barklow145, N. Barlow30, S.L. Barnes36c, B.M. Barnett133, R.M. Barnett16, Z. Barnovska-Blenessy36a, A. Baroncelli136a, G. Barone25, A.J. Barr122, L. Barranco Navarro170, F. Barreiro85,
J. Barreiro Guimarães da Costa35a, R. Bartoldus145, A.E. Barton75, P. Bartos146a, A. Basalaev125, A. Bassalat119, f, R.L. Bates56, S.J. Batista161, J.R. Batley30, M. Battaglia139, M. Bauce134a,134b, F. Bauer138, H.S. Bawa145,g, J.B. Beacham113, M.D. Beattie75, T. Beau83, P.H. Beauchemin165, P. Bechtle23, H.P. Beck18,h, H.C. Beck57, K. Becker122, M. Becker86, C. Becot112, A.J. Beddall20e, A. Beddall20b, V.A. Bednyakov68, M. Bedognetti109, C.P. Bee150, T.A. Beermann32, M. Begalli26a, M. Begel27, J.K. Behr45, A.S. Bell81, G. Bella155, L. Bellagamba22a, A. Bellerive31, M. Bellomo154, K. Belotskiy100, O. Beltramello32, N.L. Belyaev100, O. Benary155,∗, D. Benchekroun137a, M. Bender102, N. Benekos10, Y. Benhammou155, E. Benhar Noccioli179, J. Benitez66, D.P. Benjamin48, M. Benoit52, J.R. Bensinger25, S. Bentvelsen109, L. Beresford122, M. Beretta50, D. Berge109,
E. Bergeaas Kuutmann168, N. Berger5, J. Beringer16, S. Berlendis58, N.R. Bernard89, G. Bernardi83, C. Bernius145, F.U. Bernlochner23, T. Berry80, P. Berta86, C. Bertella35a, G. Bertoli148a,148b,
I.A. Bertram75, C. Bertsche45, D. Bertsche115, G.J. Besjes39, O. Bessidskaia Bylund148a,148b,
M. Bessner45, N. Besson138, A. Bethani87, S. Bethke103, A.J. Bevan79, J. Beyer103, R.M. Bianchi127, O. Biebel102, D. Biedermann17, R. Bielski87, K. Bierwagen86, N.V. Biesuz126a,126b, M. Biglietti136a, T.R.V. Billoud97, H. Bilokon50, M. Bindi57, A. Bingul20b, C. Bini134a,134b, S. Biondi22a,22b, T. Bisanz57, C. Bittrich47, D.M. Bjergaard48, J.E. Black145, K.M. Black24, R.E. Blair6, T. Blazek146a, I. Bloch45, C. Blocker25, A. Blue56, U. Blumenschein79, S. Blunier34a, G.J. Bobbink109, V.S. Bobrovnikov111,c,
S.S. Bocchetta84, A. Bocci48, C. Bock102, M. Boehler51, D. Boerner178, D. Bogavac102,
A.G. Bogdanchikov111, C. Bohm148a, V. Boisvert80, P. Bokan168,i, T. Bold41a, A.S. Boldyrev101,
A.E. Bolz60b, M. Bomben83, M. Bona79, M. Boonekamp138, A. Borisov132, G. Borissov75, J. Bortfeldt32, D. Bortoletto122, V. Bortolotto62a,62b,62c, D. Boscherini22a, M. Bosman13, J.D. Bossio Sola29,
J. Boudreau127, E.V. Bouhova-Thacker75, D. Boumediene37, C. Bourdarios119, S.K. Boutle56, A. Boveia113, J. Boyd32, I.R. Boyko68, A.J. Bozson80, J. Bracinik19, A. Brandt8, G. Brandt57, O. Brandt60a, F. Braren45, U. Bratzler158, B. Brau89, J.E. Brau118, W.D. Breaden Madden56, K. Brendlinger45, A.J. Brennan91, L. Brenner109, R. Brenner168, S. Bressler175, D.L. Briglin19, T.M. Bristow49, D. Britton56, D. Britzger45, F.M. Brochu30, I. Brock23, R. Brock93, G. Brooijmans38, T. Brooks80, W.K. Brooks34b, J. Brosamer16, E. Brost110, J.H Broughton19,
P.A. Bruckman de Renstrom42, D. Bruncko146b, A. Bruni22a, G. Bruni22a, L.S. Bruni109, S. Bruno135a,135b, BH Brunt30, M. Bruschi22a, N. Bruscino127, P. Bryant33, L. Bryngemark45,
T. Buanes15, Q. Buat144, P. Buchholz143, A.G. Buckley56, I.A. Budagov68, F. Buehrer51, M.K. Bugge121, O. Bulekov100, D. Bullock8, T.J. Burch110, S. Burdin77, C.D. Burgard109, A.M. Burger5,
B. Burghgrave110, K. Burka42, S. Burke133, I. Burmeister46, J.T.P. Burr122, D. Büscher51, V. Büscher86, P. Bussey56, J.M. Butler24, C.M. Buttar56, J.M. Butterworth81, P. Butti32, W. Buttinger27, A. Buzatu153, A.R. Buzykaev111,c, S. Cabrera Urbán170, D. Caforio130, H. Cai169, V.M. Cairo40a,40b, O. Cakir4a, N. Calace52, P. Calafiura16, A. Calandri88, G. Calderini83, P. Calfayan64, G. Callea40a,40b, L.P. Caloba26a, S. Calvente Lopez85, D. Calvet37, S. Calvet37, T.P. Calvet88, R. Camacho Toro33, S. Camarda32,
P. Camarri135a,135b, D. Cameron121, R. Caminal Armadans169, C. Camincher58, S. Campana32, M. Campanelli81, A. Camplani94a,94b, A. Campoverde143, V. Canale106a,106b, M. Cano Bret36c, J. Cantero116, T. Cao155, M.D.M. Capeans Garrido32, I. Caprini28b, M. Caprini28b, M. Capua40a,40b, R.M. Carbone38, R. Cardarelli135a, F. Cardillo51, I. Carli131, T. Carli32, G. Carlino106a, B.T. Carlson127, L. Carminati94a,94b, R.M.D. Carney148a,148b, S. Caron108, E. Carquin34b, S. Carrá94a,94b,
G.D. Carrillo-Montoya32, D. Casadei19, M.P. Casado13, j, M. Casolino13, D.W. Casper166,
R. Castelijn109, V. Castillo Gimenez170, N.F. Castro128a,k, A. Catinaccio32, J.R. Catmore121, A. Cattai32, J. Caudron23, V. Cavaliere169, E. Cavallaro13, D. Cavalli94a, M. Cavalli-Sforza13, V. Cavasinni126a,126b, E. Celebi20d, F. Ceradini136a,136b, L. Cerda Alberich170, A.S. Cerqueira26b, A. Cerri151,
L. Cerrito135a,135b, F. Cerutti16, A. Cervelli22a,22b, S.A. Cetin20d, A. Chafaq137a, D. Chakraborty110, S.K. Chan59, W.S. Chan109, Y.L. Chan62a, P. Chang169, J.D. Chapman30, D.G. Charlton19, C.C. Chau31, C.A. Chavez Barajas151, S. Che113, S. Cheatham167a,167c, A. Chegwidden93, S. Chekanov6,
S.V. Chekulaev163a, G.A. Chelkov68,l, M.A. Chelstowska32, C. Chen36a, C. Chen67, H. Chen27, J. Chen36a, S. Chen35b, S. Chen157, X. Chen35c,m, Y. Chen70, H.C. Cheng92, H.J. Cheng35a, A. Cheplakov68, E. Cheremushkina132, R. Cherkaoui El Moursli137e, E. Cheu7, K. Cheung63, L. Chevalier138, V. Chiarella50, G. Chiarelli126a,126b, G. Chiodini76a, A.S. Chisholm32, A. Chitan28b, Y.H. Chiu172, M.V. Chizhov68, K. Choi64, A.R. Chomont37, S. Chouridou156, Y.S. Chow62a,
V. Christodoulou81, M.C. Chu62a, J. Chudoba129, A.J. Chuinard90, J.J. Chwastowski42, L. Chytka117, A.K. Ciftci4a, D. Cinca46, V. Cindro78, I.A. Cioara23, A. Ciocio16, F. Cirotto106a,106b, Z.H. Citron175, M. Citterio94a, M. Ciubancan28b, A. Clark52, B.L. Clark59, M.R. Clark38, P.J. Clark49, R.N. Clarke16, C. Clement148a,148b, Y. Coadou88, M. Cobal167a,167c, A. Coccaro52, J. Cochran67, L. Colasurdo108, B. Cole38, A.P. Colijn109, J. Collot58, T. Colombo166, P. Conde Muiño128a,128b, E. Coniavitis51, S.H. Connell147b, I.A. Connelly87, S. Constantinescu28b, G. Conti32, F. Conventi106a,n, M. Cooke16, A.M. Cooper-Sarkar122, F. Cormier171, K.J.R. Cormier161, M. Corradi134a,134b, F. Corriveau90,o,
A. Cortes-Gonzalez32, G. Costa94a, M.J. Costa170, D. Costanzo141, G. Cottin30, G. Cowan80, B.E. Cox87, K. Cranmer112, S.J. Crawley56, R.A. Creager124, G. Cree31, S. Crépé-Renaudin58, F. Crescioli83,
W.A. Cribbs148a,148b, M. Cristinziani23, V. Croft112, G. Crosetti40a,40b, A. Cueto85,
S. Czekierda42, P. Czodrowski32, G. D’amen22a,22b, S. D’Auria56, L. D’eramo83, M. D’Onofrio77, M.J. Da Cunha Sargedas De Sousa128a,128b, C. Da Via87, W. Dabrowski41a, T. Dado146a, T. Dai92, O. Dale15, F. Dallaire97, C. Dallapiccola89, M. Dam39, J.R. Dandoy124, M.F. Daneri29, N.P. Dang176, A.C. Daniells19, N.S. Dann87, M. Danninger171, M. Dano Hoffmann138, V. Dao150, G. Darbo53a, S. Darmora8, J. Dassoulas3, A. Dattagupta118, T. Daubney45, W. Davey23, C. David45, T. Davidek131, D.R. Davis48, P. Davison81, E. Dawe91, I. Dawson141, K. De8, R. de Asmundis106a, A. De Benedetti115, S. De Castro22a,22b, S. De Cecco83, N. De Groot108, P. de Jong109, H. De la Torre93, F. De Lorenzi67, A. De Maria57, D. De Pedis134a, A. De Salvo134a, U. De Sanctis135a,135b, A. De Santo151,
K. De Vasconcelos Corga88, J.B. De Vivie De Regie119, R. Debbe27, C. Debenedetti139,
D.V. Dedovich68, N. Dehghanian3, I. Deigaard109, M. Del Gaudio40a,40b, J. Del Peso85, D. Delgove119, F. Deliot138, C.M. Delitzsch7, A. Dell’Acqua32, L. Dell’Asta24, M. Dell’Orso126a,126b,
M. Della Pietra106a,106b, D. della Volpe52, M. Delmastro5, C. Delporte119, P.A. Delsart58,
D.A. DeMarco161, S. Demers179, M. Demichev68, A. Demilly83, S.P. Denisov132, D. Denysiuk138, D. Derendarz42, J.E. Derkaoui137d, F. Derue83, P. Dervan77, K. Desch23, C. Deterre45, K. Dette161, M.R. Devesa29, P.O. Deviveiros32, A. Dewhurst133, S. Dhaliwal25, F.A. Di Bello52,
A. Di Ciaccio135a,135b, L. Di Ciaccio5, W.K. Di Clemente124, C. Di Donato106a,106b, A. Di Girolamo32, B. Di Girolamo32, B. Di Micco136a,136b, R. Di Nardo32, K.F. Di Petrillo59, A. Di Simone51,
R. Di Sipio161, D. Di Valentino31, C. Diaconu88, M. Diamond161, F.A. Dias39, M.A. Diaz34a,
E.B. Diehl92, J. Dietrich17, S. Díez Cornell45, A. Dimitrievska14, J. Dingfelder23, P. Dita28b, S. Dita28b, F. Dittus32, F. Djama88, T. Djobava54b, J.I. Djuvsland60a, M.A.B. do Vale26c, D. Dobos32, M. Dobre28b, D. Dodsworth25, C. Doglioni84, J. Dolejsi131, Z. Dolezal131, M. Donadelli26d, S. Donati126a,126b, P. Dondero123a,123b, J. Donini37, J. Dopke133, A. Doria106a, M.T. Dova74, A.T. Doyle56, E. Drechsler57, M. Dris10, Y. Du36b, J. Duarte-Campderros155, F. Dubinin98, A. Dubreuil52, E. Duchovni175,
G. Duckeck102, A. Ducourthial83, O.A. Ducu97,p, D. Duda109, A. Dudarev32, A.Chr. Dudder86, E.M. Duffield16, L. Duflot119, M. Dührssen32, C. Dulsen178, M. Dumancic175, A.E. Dumitriu28b, A.K. Duncan56, M. Dunford60a, A. Duperrin88, H. Duran Yildiz4a, M. Düren55, A. Durglishvili54b, D. Duschinger47, B. Dutta45, D. Duvnjak1, M. Dyndal45, B.S. Dziedzic42, C. Eckardt45, K.M. Ecker103, R.C. Edgar92, T. Eifert32, G. Eigen15, K. Einsweiler16, T. Ekelof168, M. El Kacimi137c, R. El Kosseifi88, V. Ellajosyula88, M. Ellert168, S. Elles5, F. Ellinghaus178, A.A. Elliot172, N. Ellis32, J. Elmsheuser27, M. Elsing32, D. Emeliyanov133, Y. Enari157, J.S. Ennis173, M.B. Epland48, J. Erdmann46, A. Ereditato18, M. Ernst27, S. Errede169, M. Escalier119, C. Escobar170, B. Esposito50, O. Estrada Pastor170,
A.I. Etienvre138, E. Etzion155, H. Evans64, A. Ezhilov125, M. Ezzi137e, F. Fabbri22a,22b, L. Fabbri22a,22b, V. Fabiani108, G. Facini81, R.M. Fakhrutdinov132, S. Falciano134a, R.J. Falla81, J. Faltova32, Y. Fang35a, M. Fanti94a,94b, A. Farbin8, A. Farilla136a, C. Farina127, E.M. Farina123a,123b, T. Farooque93, S. Farrell16, S.M. Farrington173, P. Farthouat32, F. Fassi137e, P. Fassnacht32, D. Fassouliotis9, M. Faucci Giannelli49, A. Favareto53a,53b, W.J. Fawcett122, L. Fayard119, O.L. Fedin125,q, W. Fedorko171, S. Feigl121,
L. Feligioni88, C. Feng36b, E.J. Feng32, M.J. Fenton56, A.B. Fenyuk132, L. Feremenga8, P. Fernandez Martinez170, J. Ferrando45, A. Ferrari168, P. Ferrari109, R. Ferrari123a,
D.E. Ferreira de Lima60b, A. Ferrer170, D. Ferrere52, C. Ferretti92, F. Fiedler86, A. Filipˇciˇc78, M. Filipuzzi45, F. Filthaut108, M. Fincke-Keeler172, K.D. Finelli24, M.C.N. Fiolhais128a,128c,r, L. Fiorini170, A. Fischer2, C. Fischer13, J. Fischer178, W.C. Fisher93, N. Flaschel45, I. Fleck143, P. Fleischmann92, R.R.M. Fletcher124, T. Flick178, B.M. Flierl102, L.R. Flores Castillo62a, M.J. Flowerdew103, G.T. Forcolin87, A. Formica138, F.A. Förster13, A. Forti87, A.G. Foster19, D. Fournier119, H. Fox75, S. Fracchia141, P. Francavilla83, M. Franchini22a,22b, S. Franchino60a, D. Francis32, L. Franconi121, M. Franklin59, M. Frate166, M. Fraternali123a,123b, D. Freeborn81, S.M. Fressard-Batraneanu32, B. Freund97, D. Froidevaux32, J.A. Frost122, C. Fukunaga158, T. Fusayasu104, J. Fuster170, O. Gabizon154, A. Gabrielli22a,22b, A. Gabrielli16, G.P. Gach41a,