HAL Id: cirad-00845847
http://hal.cirad.fr/cirad-00845847
Submitted on 18 Jul 2013
HAL is a multi-disciplinary open access
archive for the deposit and dissemination of
sci-entific research documents, whether they are
pub-lished or not. The documents may come from
teaching and research institutions in France or
abroad, or from public or private research centers.
L’archive ouverte pluridisciplinaire HAL, est
destinée au dépôt et à la diffusion de documents
scientifiques de niveau recherche, publiés ou non,
émanant des établissements d’enseignement et de
recherche français ou étrangers, des laboratoires
publics ou privés.
Structure of the specific combining ability between two
species of Eucalyptus. II. A clustering approach and a
multiplicative model
C. P. Baril, D. Verhaegen, Ph. Vigneron, J. M. Bouvet, A. Kremer
To cite this version:
C. P. Baril, D. Verhaegen, Ph. Vigneron, J. M. Bouvet, A. Kremer. Structure of the specific combining
ability between two species of Eucalyptus. II. A clustering approach and a multiplicative model. TAG
Theoretical and Applied Genetics, Springer Verlag, 1997, 94, pp.804-809. �cirad-00845847�
Theor Appl Genet (1997) 94 : 804—809 Springer-Verlag 1997
C. P. Baril · D. Verhaegen · Ph. Vigneron
J. M. Bouvet · A. Kremer
Structure of the specific combining ability between two species of
Eucalyptus.
II. A clustering approach and a multiplicative model
Received: 3 November 1996 / Accepted: 8 November 1996
Abstract
The Eucalyptus breeding program of URPPI
(a partnership between CIRAD-Foreˆt, Centre National
de la Recherche Forestie`re du Congo, and Unite´
d’Aforestation Industrielle du Congo) consists of a
re-ciprocal recurrent selection scheme developed in the
Congo between the two species Eucalyptus urophylla
and Eucalyptus grandis. Two approaches are proposed
in order to model and predict the specific combining
ability (SCA) between these species. The clustering
ap-proach uses a simultaneous clustering procedure of the
two species based on SCA and reveals heterotic groups
coherent with the geographical origins of E. urophylla
genotypes. The second approach uses a multiplicative
model to partition the SCA into three multiplicative
terms explaining 95% of the interaction.
Key words
Analysis of interaction · Heterosis
breeding · Clustering procedure · AMMI model
Eucalyptus
Introduction
Although plant breeders generally rejoice at the
hetero-sis effect, the interaction which it reflects becomes an
Communicated by P. M. A. Tigerstedt
Unite´ de recherche sur la productivite´ des plantations industrielles (URPPI)
C. P. Baril ( )1 · D. Verhaegen · Ph. Vigneron · J. M. Bouvet Centre de coope´ration internationale en recherche agronomique pour le de´veloppement, CIRAD -Foreˆt, BP 5035,
F-34032 Montpellier Cedex1, France A. Kremer
Institut national de recherche agronomique, INRA, BP 45, Pierroton, F-33610 Cestas, France
Present address:
1 Groupe d’etude et de controˆle des varie´te´s et des semences, GEVES, La Minie`re F-78285 Guyancourt Cedex, France
actual problem as far as its interpretation, and a fortiori
its prediction, is concerned. If the additive model is,
most of the time, too simple to restitute the pattern of
the data, the complete interactive model provides no
predictive information. The aim of this paper is to
propose two intermediate models between these two
extremes, that is to say to constrain the interaction
term. The set of possible models could be split in two
families, i.e. the models resulting from a clustering
approach and the multiplicative models. The
more-accurate clustering approach dealing with specific
com-bining ability (SCA) is naturally the crossed clustering.
This procedure (Corsten and Denis 1990) defines one
dendrogram on rows (for example, females) and
an-other dendrogram on columns (for example, males)
which are used simultaneously to produce successive
nested models (Byth et al. 1976). The multiplicative
models enclose both the joint regression (Finlay and
Wilkinson 1963) and the factorial regression (Denis
1988). All these models, considering the main effects as
fixed, have already been used in studies dealing with
genotype]environment interaction and could provide
valuable tools in SCA prediction studies.
Materials and methods
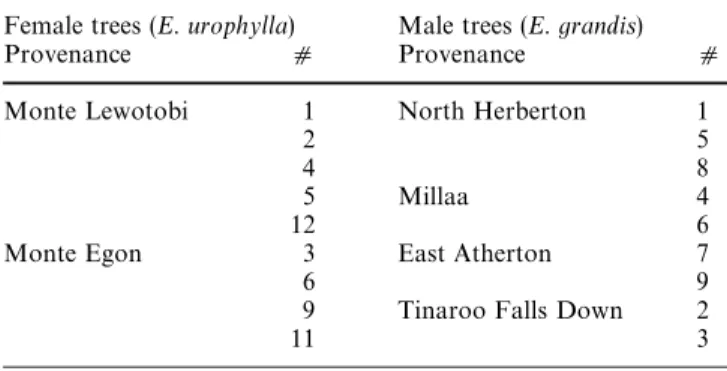
A factorial mating design involving nine female trees of Eucalyptus urophyllaand nine male trees of Eucalyptus grandis established in 1990 produced 49 families (among the 81 possible ones) with three or four replications per family (Baril et al. 1996). The female trees came from two locations clearly differentiated in the island of Flores, namely Monte Lewotobi and Monte Egon, while the male trees came from four near locations in North Queensland (Australia), namely North Herberton, Millaa, East Atherton and Tinaroo Falls Down. Table 1 shows the origins of the different genotypes of E. urophyllaand E. grandis. Within the context of a reciprocal recurrent selection scheme, developed by CIRAD-Foreˆt since 1989 and de-scribed by Vigneron (1991), this reduced mating design constitutes a sub-set of a larger one, involving 13 selected trees of E. urophylla and 13 selected trees of E. grandis, in which the experimental unit is a square plot of 4]4"16 trees (Bouvet and Vigneron 1995). Height
Table 1 Geographical origins of provenances of Eucalyptus species. Female trees are numbered as following: 1, 2, 3, 4, 5, 6, 9, 11 and 12, and male trees are numbered from 1 to 9
Female trees (E. urophylla) Male trees (E. grandis)
Provenance d Provenance d
Monte Lewotobi 1 North Herberton 1
2 5
4 8
5 Millaa 4
12 6
Monte Egon 3 East Atherton 7
6 9
9 Tinaroo Falls Down 2
11 3
and circumference at 1.3 m were measured at 38 months (half-rota-tion age in commercial planta(half-rota-tions) and volume was calculated by considering the trunk as a cone.
Knowing that missing values account for 40% of the dataset, they were estimated by the bi-joint regression model, as pro-posed by Baril et al. (1996), in order to avoid fallacious estimates (Denis and Baril 1992), for the two following reasons: firstly, the coefficient of determination of this model equals 90.8% and second-ly, it provides estimates which retain part of the interaction, in opposition to the additive model. The bi-joint regression model is written as:
E(½ij)"k#ai#bj#o· aˆi · bKj#lj · aˆi#ji · bKj,
where aˆi and bKj are the estimates of the additive parameters ai and bj, that is to say the general combining abilities (GCAs). Firstly, the additive model is adjusted to the data in order to estimate the additive parameters, and secondly, the bi-joint regression model can be adjusted to the data.
One may note that this model is a particular case of the factorial regression model, itself a member of the multiplicative-models family (Baril et al. 1995), where the only co-variate associated with each factor is the estimate of the corresponding main effect.
The clustering procedure and the multiplicative models were then applied to the new complete dataset using the computer package INTERA (Decoux and Denis 1991).
A posterioristructure of the two parental samples
Cluster analysis is used to classify females and males in order to distinguish and interpret female ] male interaction (SCA). A simul-taneous clustering method (Corsten and Denis 1990) is applied to the individual tree trunk volume of hybrids at 38 months between female i and male j (½ij). This procedure is based on the model initially proposed by Byth et al. (1976):
E(½ij)"k#Bf
(i)#¼i#Bm(j)#¼j#(BB)f(i)m(j)
#(B¼)f
(i)j#(¼B)im(j)#(¼¼)ij, (1)
where f(i) and m(j) designate the groups formed by females and males, respectively; k is the general mean; Bf(i)is the female between-group
effect, ¼i is the female within-group effect (Bf(i)#¼i being the female
main effect); Bm(j)is the male between-group effect and ¼j is the male
within-group effect (Bm(j)#¼j being the male main effect). In a
sim-ilar way, SCA interaction is made of four parts: (BB)f(i)m(j)#(B¼)f(i)j#(¼B)im(j)#(¼¼)ij,
where (BB)f(i)m(j)is the between-between component; (B¼)f(i)jis the
between-within component; (¼B)im(j)is the within-between
compon-ent; and (¼¼)ij is the within-within component, which could be considered as the residual. The simultaneous two way clustering procedure minimizes the sum of the three last components of inter-action B¼#¼B#¼¼, which means it maximizes the BB com-ponent. Let I and J be the number of females and the number of males, respectively, and let F and M be the number of groups of females and the number of groups of males, respectively, then during the hierarchical clustering process F)I and M)J. At the begin-ning of the procedure F"I and M"J (the BB component contains the whole interaction), while at the end of the procedure F"M"1 (the ¼¼ component contains the whole interaction). The merging procedure was ended according to the stopping criterion proposed by Baril et al. (1994). In that paper, the authors propose to stop the agglomerative hierarchical clustering procedure when the cumulat-ive mean square associated with the BB component of interaction becomes higher than the global interaction mean square.
Multiplicative model applied to the tree trunk volume of hybrids The multiplicative model, also called the bi-additive model (Denis and Gower 1992, 1994) or AMMI model, as additive main effects and multiplicative interaction (Gauch 1988), was initially proposed by Gollob (1968). It is equivalent to the principal components analysis (PCA) method applied to the residual term of the additive model (Mandel 1969). The usefulness of the bi-additive model has been amply demonstrated (Mandel 1971; Bradu and Gabriel 1978; Kempton 1984; Crossa et al. 1990) for the analysis of genotype ] environment interaction. Moreover, this model considering the two factors symmetrically, seems to be perfectly adapted to female ] male interaction, in which the two main effects are of the same nature. The full bi-additive model is written as:
E(½ij)"k#ai#bj#+R
r/1hr · jr(i)· dr(j)
. (2)
Here the interaction term (SCA) is changed to a sum of products of female scores jr(i)and male scores dr(j)scaled by the proportionality
constant hr. This breakdown of the additive model residual in rbi-additive terms [with r"1, 2, R; R"in f (I!1, J!1)] in-creases the global parametrical dimension of I#J!1!2r for each additional multiplicative term. The female (or male) scores can be interpreted as sensitivities with respect to the male (or female) scores.
Results
A posteriori
structure of the two parental samples
The ANOVA table of the structure model (equation 1)
of parental samples applied to the tree trunk volume at
38 months is shown in Table 2. The BB part of SCA
accounts for 83.5% of the interaction sum of squares.
Hence, most of the SCA is explained by the crossed
groupings of E. urophylla and E. grandis. Although the
clustering criterion does not depend on the main
ef-fects, it is notable that the between-groups sum of
squares accounts for 79.7% of the female effect and for
92.7% of the male effect. The simultaneous clustering
procedure has been stopped for five groups of E.
urophylla
and five groups of E. grandis, according to the
Table 2 ANOVA table of the structure model of parental populations. The last column of the ANOVA table shows the amount of the variability of the phenotypic character explained by each term of the structure model (equation 1)
Source of Sum of df Mean F-test P-level % Sum of
variation squares squares squares
E. urophylla 4597.82 8 574.73 — — 60.5% Between groups (B) 3664.15 4 916.04 321.2 (0.001 48.2% Within group (¼) 933.67 4 233.42 81.8 (0.001 12.3% E. grandis 1072.03 8 134.00 — — 14.1% Between groups (B) 993.82 4 248.45 87.1 (0.001 13.1% Within group (¼) 78.21 4 19.55 6.9 0.002 1.0% E. urophylla]E. grandis 1934.26 64 30.22 — — 25.4% BB 1614.76 16 100.92 35.4 (0.001 21.2% B¼ 140.47 16 8.78 3.1 0.015 1.8% ¼B 133.40 16 8.34 2.9 0.019 1.7% ¼¼ 45.63 16 2.85 — — 0.6%
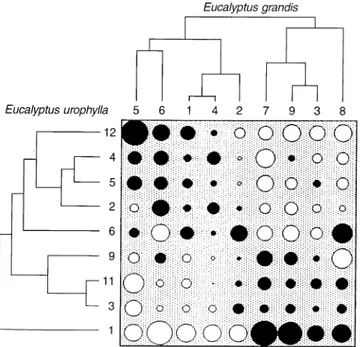
Fig. 1 Table of SCA with the dendrograms associated to the two Eucalyptusspecies. The cutting criterion of each dendrogram pro-vides five groups of genotypes. Circle size stands for the value of SCA, solid circles show positive SCAs and empty circles show negative SCAs
threshold proposed by Baril et al. (1994). The two
dendrograms resulting from this procedure are
shown in Fig. 1 with the table visualizing the
additive-model residuals. The order of rows (females) and
col-umns (males) of this table being compatible with the
results of the simultaneous clustering, two groups
com-bining specific female trees with specific male trees
clearly lead to a positive SCA (solid circles). Table 3
shows the percentages of the residual sum of squares
of the additive model (i.e. the interaction sum of
squares) separately attributed to each female tree and
each male tree. This quantity represents the
contri-bution of each parent to the whole interaction, namely
the SCA.
Table 3Contribution of each parent to the residual sum of squares of the additive model. Female trees and male trees are ordered according to the results of simultaneous clustering
Female trees (E. urophylla) Male trees (E. grandis)
d Percentage d Percentage 12 20.08 5 19.74 4 5.99 6 16.10 5 4.34 1 4.84 2 3.26 4 3.54 6 12.12 2 4.54 9 6.04 7 19.42 11 5.53 9 13.55 3 2.49 3 3.88 1 40.14 8 14.40
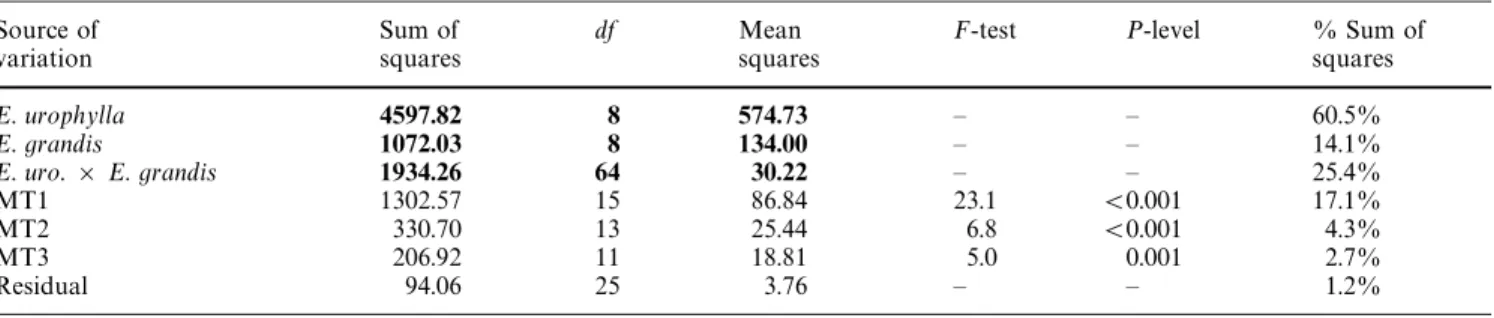
Multiplicative model applied to the tree trunk volume
of hybrids
The multiplicative model (equation 2) has been
ap-plied to the individual tree trunk volume at 38
months with an increasing number of multiplicative
terms until the last one became insignificant. The
ANOVA table of the multiplicative model with only
three significant multiplicative terms is shown in
Table 4. The first, second and third terms account for
67.3%, 17.1% and 10.7% of the SCA, respectively.
Confidence ellipses (P-level equals 10%) around the
estimates of the most important parameters of the
multiplicative model are plotted in Figs. 2 and 3. Figure
2-A (or Fig. 2-B) shows the plot of the first
multiplica-tive parameter j1
(i)(or d1
(j)) against the additive
para-meter ai (or bj). Figure 3-A (or Fig. 3-B) shows the
second multiplicative parameter j2
(i)(or d2
(j)) against
the first multiplicative parameter j1
(i)(or d1
(j)). The
interpretation of these graphs may not depend on
the signs of the multiplicative parameters because
the eigen vectors are defined up to a proportionality
coefficient.
Table 4 ANOVA table of the multiplicative model with three terms. The last column of the ANOVA table shows the amount of the variability of the phenotypic character explained by each term of the
multiplicative model (equation 2); MT1, MT2 and MT3 stand for the first, second and third multiplicative terms, respectively
Source of Sum of df Mean F-test P-level % Sum of
variation squares squares squares
E. urophylla 4597.82 8 574.73 — — 60.5% E. grandis 1072.03 8 134.00 — — 14.1% E. uro. ] E. grandis 1934.26 64 30.22 — — 25.4% MT1 1302.57 15 86.84 23.1 (0.001 17.1% MT2 330.70 13 25.44 6.8 (0.001 4.3% MT3 206.92 11 18.81 5.0 0.001 2.7% Residual 94.06 25 3.76 — — 1.2%
Fig. 2A, B Plot of the first multiplicative parameters versus the additive parameters. A Parameters associated to Eucalyptus urophylla(j1
(i)versus ai). B Parameters associated to Eucalyptus
grandis(d1
(j)versus bj). Confidence ellipses are worked out at the 10% P-level
Fig. 3A, B Plot of the second multiplicative parameters versus the first multiplicative parameters. A Parameters associated to Euca-lyptus urophylla(j2
(i)versus j1(i)). B Parameters associated to
Euca-lyptus grandis(d2
(j)versus d1(j)). Confidence ellipses are worked out at
the 10% P-level
Discussion
The comparison of a posteriori structure with a priori
knowledge of genotype origins inside each
par-ental population allows an interpretation of the
het-erotic groups in E. urophylla based on geographical
origins. For this population, the terminating
cri-terion of the clustering procedure leads to the
def-inition of five groups containing two groups of three
genotypes [(4, 5, 2) and (9, 11, 3)] and three groups of
one genotype [(1), (12) and (6)]. These one-genotype
groups contain the more interactive mother trees
re-sponsible for 40.1%, 20.1% and 12.1% of the
interaction sum of squares, respectively. The first
three-genotypes group contains three-genotypes originating from
Monte Lewotobi, while the second three-genotypes
group contains genotypes originating from Monte
Egon. No relation appears between the a posteriori
structure and the origins of E. grandis. This is
prob-ably due to the weak contribution of the male effect on
the whole variability (only 14.1%), in contrast to the
large contribution of the female effect (60.5%). The
analysis of RAPD data corresponding to the same
factorial mating design (Baril et al. 1996) had already
led to the conclusion that the genetic variability of E.
urophylla
was greater than the genetic variability of E.
grandis.
The first multiplicative term accounts for 67.3%
of the interaction sum of squares. This result
prob-ably reflects the fact that the tree trunk volume is
itself the product of two traits, namely height and
circumference. It also could reflect the
complementar-ity between the two species: while E. urophylla is well
adapted to the environmental conditions in the
Congo, E. grandis presents an important growth
potential. These two traits combined inside the hybrid
individuals could express their synergy in a
multiplica-tive way.
The groupings of parents of each species obtained
by the two methods, namely the simultaneous
clus-tering procedure and the plot of the two first
multi-plicative parameters, are quite similar. This result
is not surprising because the coefficient of
determina-tion of the two associated models are both high [i.e.
95.9% if only the BB part of interaction is considered in
equation 1 and 96.1% if only MT1 (first multiplicative
term) and MT2 (second multiplicative term) are
con-sidered in equation 2]. The fact that female and male
main effects are highly explicable by the five groups
provided by the simultaneous clustering procedure is
consistent with the quite linear relation between the
additive parameters and first multiplicative
para-meters.
In a previous paper we tried to explain the SCA of
the same phenotypic character (tree trunk volume at 38
months) using a factorial regression model where the
co-variate associated to each parental population was
the mean genetic distance, calculated with respect to
the other population, from RAPD data. The
con-clusion of this study was that ‘‘it would be more
effi-cient to find specific bands for genomic regions actually
contributing to heterosis’’. The genetic distance
cal-culated with these selected bands would have a better
predictive power for the heterosis phenomenon. The
present study shows that the clustering method
pro-vides an interesting tool to reveal heterotic groups in
the two complementary populations E. urophylla and
E. grandis. With a predictive aim, it would be
interest-ing to split the parental populations into groups
ac-cording to the crossed clustering results and then to
look for the RAPD bands responsible for this structure.
A genetic distance, whose definition has to be specified,
based on the presence and/or the absence of these
bands could be highly related to the specific combining
ability.
References
Baril CP, Denis JB, Brabant Ph (1994) Selection of locations using simultaneous clustering based on genotype-environment interac-tion. Can J Plant Sci 74 : 311—317
Baril CP, Denis JB, Wustman W, Van Eeuwijk FA (1995) Analysing genotype-by-environment interaction in Dutch potato variety trials using factorial regression. Euphytica 82 : 149—155
Baril CP, Verhaegen D, Vigneron Ph, Bouvet JM, Kremer A (1996) Structure of the specific combining ability between two species of Eucalyptus. I. RAPD data. Theor Appl Genet 94 : 796—803 Bouvet JM, Vigneron Ph (1995) Age trends in variances and
heritabilities in Eucalyptus mating designs. Silvae Genet 44 : 206—216
Bradu D, Gabriel KR (1978) The bi-plot as a diagnostic tool for models of two-way tables. Technometrics 20 : 47—68
Byth DE, Eisemann RL, De Lacy IH (1976) Two-way pattern analysis of a large data set to evaluate genotypic adaptation. Heredity 37 : 215—230
Corsten LCA, Denis JB (1990) Structuring interaction in two-way tables by clustering. Biometrics 46 : 207—215
Crossa J, Gauch KG, Zobel RW (1990) Additive main effects and multiplicative interaction analysis of two international maize cultivar trials. Crop Sci 30 : 493—500
Decoux G, Denis JB (1991) INTERA: logicels pour l’interpre´tation statistique de l’interaction entre deux facteurs. Laboratorie de Biome´trie INRA, route de Saint-Cyr F78026, Versailles Cedex, France
Denis JB (1988) Two-way analysis using co-variates. Statistics 19 : 123—132
Denis JB, Baril CP (1992) Sophisticated models with numerous missing values: the multiplicative interaction model as an example. Biuletyn Oceny Odmian, Poland, 33—45
Denis JB, Gower JC (1992) Bi-additive models. Technical report. Laboratorie de Biome´trie, INRA, Route de Saint-Cyr F78026, Versailles, France
Denis JB, Gower JC (1994) Bi-additive models. Letter to the editor. Biometrics 50 : 310—311
Finlay KW, Wilkinson GN (1963) The analysis of adaptation in a plant-breeding programme. Aust J Agric Res 14 : 742—754
Gauch HG (1988) Model selection and validation for yield trials with interaction. Biometrics 88 : 705—715
Gollob HF (1968) A statistical model which combines features of factor-analytic and analysis of variance techniques. Psychomet-rika 33 : 73—113
Kempton RA (1984) The use of bi-plots in interpreting variety by environment interactions. J Agric Sci C 103 : 123—135
Mandel J (1969) The partitioning of interaction in analysis of vari-ance. J Res Nat Bur Stand Sect B 73B (4) : 309—328
Mandel J (1971) A new analysis of variance model for non-additive data. Technometrics 13 : 1—18
Vigneron Ph (1991) Cre´ation et ame´lioration des varie´te´s d’hy-brides d’Eucalyptus au Congo. Proc Cong IºFRO Inten-sive forestry: the role of Eucalyptus, Durban, September 1991, pp 345—360
.