Publisher’s version / Version de l'éditeur:
Vous avez des questions? Nous pouvons vous aider. Pour communiquer directement avec un auteur, consultez la première page de la revue dans laquelle son article a été publié afin de trouver ses coordonnées. Si vous n’arrivez pas à les repérer, communiquez avec nous à PublicationsArchive-ArchivesPublications@nrc-cnrc.gc.ca.
Questions? Contact the NRC Publications Archive team at
PublicationsArchive-ArchivesPublications@nrc-cnrc.gc.ca. If you wish to email the authors directly, please see the first page of the publication for their contact information.
https://publications-cnrc.canada.ca/fra/droits
L’accès à ce site Web et l’utilisation de son contenu sont assujettis aux conditions présentées dans le site LISEZ CES CONDITIONS ATTENTIVEMENT AVANT D’UTILISER CE SITE WEB.
Indoor Air 2011: 06 June 2011, Austin, Texas [Proceedings], pp. 1-6, 2011-06-06
READ THESE TERMS AND CONDITIONS CAREFULLY BEFORE USING THIS WEBSITE.
https://nrc-publications.canada.ca/eng/copyright
NRC Publications Archive Record / Notice des Archives des publications du CNRC :
https://nrc-publications.canada.ca/eng/view/object/?id=723127aa-9397-475d-bed2-b240d7a88c32 https://publications-cnrc.canada.ca/fra/voir/objet/?id=723127aa-9397-475d-bed2-b240d7a88c32
NRC Publications Archive
Archives des publications du CNRC
This publication could be one of several versions: author’s original, accepted manuscript or the publisher’s version. / La version de cette publication peut être l’une des suivantes : la version prépublication de l’auteur, la version acceptée du manuscrit ou la version de l’éditeur.
Access and use of this website and the material on it are subject to the Terms and Conditions set forth at
Seasonal variation in indoor air quality from a field study investigating
the impact of ventilation rates on the health of asthmatic children in
Québec City
Se a sona l va ria t ion in indoor a ir qua lit y from a fie ld st udy
inve st iga t ing t he im pa c t of ve nt ila t ion ra t e s on t he he a lt h of
a st hm a t ic c hildre n in Qué be c Cit y
N R C C - 5 4 4 6 7
A u b i n , D . ; W o n , D . Y . ; G a u v i n , D . ; F u g l e r , D . ;
L a j o i e , P . ; S c h l e i b i n g e r , H .
J u l y 2 0 1 1
A version of this document is published in / Une version de ce document se trouve dans:
Indoor Air 2011, Austin, Texas, June 06-10, 2011, pp. 1-6
http://www.nrc-cnrc.gc.ca/irc
The material in this document is covered by the provisions of the Copyright Act, by Canadian laws, policies, regulations and international agreements. Such provisions serve to identify the information source and, in specific instances, to prohibit reproduction of materials without written permission. For more information visit http://laws.justice.gc.ca/en/showtdm/cs/C-42
Les renseignements dans ce document sont protégés par la Loi sur le droit d'auteur, par les lois, les politiques et les règlements du Canada et des accords internationaux. Ces dispositions permettent d'identifier la source de l'information et, dans certains cas, d'interdire la copie de documents sans permission écrite. Pour obtenir de plus amples renseignements : http://lois.justice.gc.ca/fr/showtdm/cs/C-42
Seasonal variation in indoor air quality from a field study investigating the
impact of ventilation rates on the health of asthmatic children in Québec
City
Daniel Aubin1*, Doyun Won1, Hans Schleibinger1, Denis Gauvin2, Pierre Lajoie2, Don Fugler3
1
Institute for Research in Construction, National Research Council of Canada, 1200 Montreal Road, Ottawa, Ontario, K1A 0R6
2
Institut national de santé publique du Québec, 945 avenue Wolfe, Québec City, Québec, G1V 5B3
3
Canada Mortgage and Housing Corporation, 700 Montreal Road, Ottawa, Ontario, K1A 0P7
*
Corresponding email: Daniel.Aubin@nrc.ca
SUMMARY
This paper describes the results obtained in 115 homes during a randomized intervention study investigating the impact of ventilation rates on indoor air quality (IAQ) and the respiratory health of asthmatic children in Québec City, Canada. Ventilation interventions were conducted in half the homes determined to be under ventilated in order to increase the
air exchange rate in the heating season to above 0.30 h-1. The majority of the homes (85%) did
not meet our nominal ventilation goal of 0.30 h-1 and the average air exchange rate measured
in winter was a factor of 2.8 smaller than in summer. The concentrations of the aldehydes,
NO2 and O3 were all higher in summer while most hydrocarbons, aromatics, halocarbons and
alcohols were higher in winter. On average, most homes met Health Canada’s guideline for an
8-hr exposure of formaldehyde of 50 µg m-3 in winter but not in summer despite the higher
observed air exchange rates.
IMPLICATIONS
On average, the homes in this study met Health Canada’s formaldehyde exposure guideline during the heating season but exceeded it during the non-heating season despite the occurence of significantly higher air exchange rates. These results suggest that increased ventilation on its own may not suffice to reduce the concentration of formaldehyde in indoor environments.
KEYWORDS
indoor air quality, field study, air exchange rate, seasonal variation, intervention
INTRODUCTION
This paper describes the preliminary results obtained from a randomized intervention study investigating the impact of ventilation rates on indoor air quality (IAQ) and the respiratory health of asthmatic children in Québec City, Canada. The objective of this study was to determine whether increased ventilation will lead to a corresponding decrease in the number of asthmatic symptoms in children, to correlate ventilation rates with IAQ, and to support research for determining health-based ventilation rates.
The first phase of the field study involved three residential home visits (two during the heating season and one in summer) where a number of IAQ relevant chemical, biological and physical parameters were measured over a 6 to 8 day period. A series of questionnaires capturing information related to housing characteristics and occupant behavior were also
administered during the residential home visits. This paper focuses on the preliminary IAQ parameters and ventilation measurements in 115 homes in the first phase of the study.
In the second phase, any home consistently meeting a minimum ventilation rate of 0.30 air exchanges per hour or more was excluded from further study. Of the 115 homes involved in the study, 85 were eligible for the intervention. All remaining homes, with consistently low or sporadically low measured ventilation rates, were randomly divided into two groups. One group of homes (n=43), had their ventilation rates increased by a combination of: installation of a heat recovery ventilator; modification of the existing ventilation system; and/or modification of occupant behavior. The other group (n=42), did not have any modifications done to the ventilation rate and served as a control group.
The monitoring in the second phase (ongoing) after the intervention is identical to the first phase and will be used to assess the effectiveness of the intervention on improving the indoor air quality and respiratory health
METHODS
The average air exchange rates (AER) measured in the child’s bedroom over a 6 to 8 day period were determined using the perfluorocarbon tracer (PFT) technique developed by the Tracer Technology Group at Brookhaven National Laboratory (Dietz and Cote, 1982). Three PFT emitters were placed throughout the house (except for the child’s bedroom), while two capillary adsorption tubes, used to sample the PFT, were placed in the child’s bedroom and in the living room. Analysis of triplicate CATS, placed side by side, showed a standard deviation of less than 6% in the measured air exchange rate. The average difference between simultaneously measured air exchange rates in the child’s bedroom and the living room was found to be 17% for 110 different homes. This is based on 139 sets of measurements from the living room and child’s bed room after the outlier measurements were removed. In all cases, the homes were treated as a single zone. The AER was also measured over a 4-5 hour period
in the child’s bedroom using SF6 tracer gas decay according to the ASTM test method E
741-00 (ASTM, 1997) using an Innova 1312 or 1412 photoaccoustic field gas monitor. Building
air tightness was measured using a Minneapolis Blower DoorTM from The Energy
Conservatory equipped with a DG-700 pressure and flow gauge and the data was analyze with the TECTITE Airtightness Test Analysis Software. The blower door test was conducted according to the ASTM E 779-03 test method (ASTM, 2003).
Formaldehyde was measured in the child’s bedroom over a 6 to 8 day period using duplicate Waters Sep-Pak ® ExPosure cartridges as a passive sampler. The cartridges were subsequently analyzed for formaldehyde using high performance liquid chromatography
(HPLC) according the ASTM test method D 5197-03 (ASTM, 2006). Ozone (O3) and
nitrogen dioxide (NO2) were sampled using passive sampler badges produced by Ogawa &
Company, which use coated filters to trap O3 or NO2. A detailed extraction and analysis
protocol for the O3 and NO2 impregnated filter pads can be obtained from Ogawa & Company
(Ogawa, 2011). The concentration of NO2 (0.32 ppb detection limit for a 7 day exposure) was
determined on a Spectro UV-Vis Double Beam UVD-3500 spectrophotometer at a wavelength of 545 nm. The concentration of O3 (0.39 ppb detection limit for a 7 day
exposure) was determined by ion chromatography using a Dionex KS-1000 ion chromatograph using an IonPac ® AS 22 column (Ogawa, 2011). The relative humidity and
temperature were measured with an Onset HOBO U12-013 data logger and the CO2
concentration was measured with a Vaisala GMW21 CO2 sensor. The CO2 concentrations
The volatile organic compounds were sampled on Perkin Elmer stainless steel ATD Passive samplers containing a Tenax TA 60/80 sorbent. Duplicate passive samplers were left in the child’s bedroom for a period of 6 to 8 days. The VOCs were then desorbed from the tubes with a flow of helium using a Gerstel TDS 3 thermal desorption system and focused on a
cooled inlet at -90 C°. The thermal desorber temperature ramp was 60 C° min-1 until 300 C°
followed by a 5 min hold time. The compounds were then separated and detected on an Agilent 6890 GC-MSD operating in scan mode from m/z 35 to 300. The GC was equipped with a 30 m x 250 µm i.d. Supelco SPB-624 column and the temperature program was 35 C°
for 5 min followed by a 6 C° min-1 temperature ramp to 230 C°.
Particulate matter was measured (heating season only) using a Grimm 1.108 particle counter and a TSI P-Track ultrafine particle counter for 4 to 5 hours during in the child’s bedroom for the first day of the 6 to 8 measurement period. Airborne mould spores were measured using a Staplex model MAS-2 two-stage microbial air sampler for 5 minutes during each of the visits in the heating season in the child’s bedroom, living room and the basement. The spores were collected onto both dichloran 18% glycerol (DG-18) and malt extract agar (MEA) covered petri dishes. Settling mould spores were collected for 4 to 5 hours in the child’s bedroom onto both MEA and DG-18 covered petri dishes. Both the airborne and settling mould spore samples were incubated at 25 ºC for 7 days then analyzed visually with a microscope to obtain a colony count. Allergen samples in dust were collected from the child’s mattress and carpet, if present in the child’s bedroom, using a Philips Topomatic T518 vacuum cleaner equipped
with a DustreamTM collector from Indoor Biotechnologies. The dust samples were then
analyzed by Aerotech Laboratories for dust mite (Der p 1, Der f 1), cat (Fel d 1) and dog (Can f 1) allergens using an enzyme-linked immunosorbent assay (ELISA).
Prior to conducting the individual ventilation intervention the precise prescription was modeled for several homes computationally and physically in NRC’s purpose built Indoor Air Research Laboratory (IARL). The computational fluid dynamics (CFD) calculations were performed using Fluent and were conducted to optimize the geometry and initial placement of any supply and return air vents in the child’s bedroom that would be required during the installation of a heat recovery ventilator. The results of the computational models were then validated physically in a 1:1 scale model of the child’s bedroom in the IARL. Measurements of SF6 tracers gases, register flow rate, surface temperature, air temperature and velocity
profiles throughout the model bedroom were compared to those predicted with the CFD modeling. Good agreement was obtained between the computational and physical modeling. In most cases, the placement of a circular air supply register, supplying fresh air from the HRV, located at the center of the child’s bedroom provided better ventilation than placement near the door or along the wall.
RESULTS
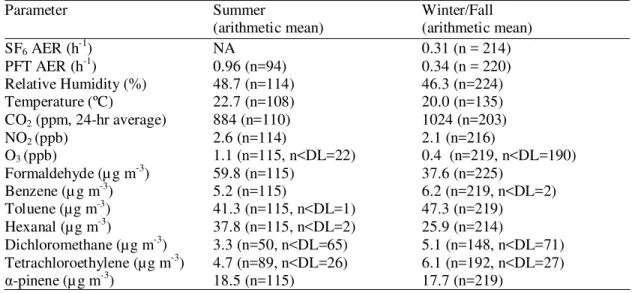
Table 1. Summary of the seasonal concentrations of selected IAQ parameters measured in the child’s bedroom during the winter/fall and summers (AER = air exchange rate, DL = detection limit, n = number of seasonal measurements)
Parameter Summer (arithmetic mean) Winter/Fall (arithmetic mean) SF6 AER (h-1) PFT AER (h-1) Relative Humidity (%) Temperature (ºC) CO2 (ppm, 24-hr average) NO2(ppb) O3(ppb) Formaldehyde (µ g m-3) Benzene (µ g m-3) Toluene (µg m-3) Hexanal (µg m-3) Dichloromethane (µg m-3) Tetrachloroethylene (µg m-3) -pinene (µ g m-3) NA 0.96 (n=94) 48.7 (n=114) 22.7 (n=108) 884 (n=110) 2.6 (n=114) 1.1 (n=115, n<DL=22) 59.8 (n=115) 5.2 (n=115) 41.3 (n=115, n<DL=1) 37.8 (n=115, n<DL=2) 3.3 (n=50, n<DL=65) 4.7 (n=89, n<DL=26) 18.5 (n=115) 0.31 (n = 214) 0.34 (n = 220) 46.3 (n=224) 20.0 (n=135) 1024 (n=203) 2.1 (n=216) 0.4 (n=219, n<DL=190) 37.6 (n=225) 6.2 (n=219, n<DL=2) 47.3 (n=219) 25.9 (n=214) 5.1 (n=148, n<DL=71) 6.1 (n=192, n<DL=27) 17.7 (n=219) 0.0 0.5 1.0 1.5 2.0 2.5 0 500 1000 1500 2000 2500 CO 2 (ppm ) PFT AER (h-1)
Figure 1. Relationship between the average CO2 concentrations (ppm, 24-hr average)
measured in the child’s bedroom and the PFT derived air exchange rate (h-1) in winter/fall (open circle) and summer (solid circle).
DISCUSSION
From Table 1 it can be seen that the arithmetic mean of the air exchange rates measured
during the winter/fall season with both the PFT and SF6 methods were similar. However, for
individual measurements, there was some disagreement between the air exchange rate obtained with both techniques, with the SF6 method tending to give a slightly higher air
exchange rate for a given visit. Since air infiltration is weather dependent, this variation was
to be expected (Sherman, 1998). Due to the shorter integration time for the SF6method (4 to 5
hours), it can be easily influenced by the occupant’s behavior or anomalous conditions present during the measurement period. The PFT results, with a 6 to 8 day measurement period, should be considered more representative of the average air exchange rate encountered in the home; thus, these values were used to make associations between the air exchange rates and the IAQ parameters. The PFT air exchange rates measured in this study were slightly higher than those measured by Gilbert et al. where 80% of the homes in Québec City (n = 96) had an air exchange rate below 0.23 h-1.
From Table 1 there is a clear seasonal variability in the measured relative humidity, O3, and
volatile organic compounds. With the exception of the aldehydes, NO2 and O3 all the
chemicals had higher concentrations in winter/fall. The mean winter/fall NO2 concentration of
2.1 ppb observed in this study was lower than the mean value of 5.0 ppb (n = 96) reported by Gilbert et al. (Gilbert et al., 2006) measured in Québec City during January and April 2005. Generally, for the VOC compound classes measured in this study the concentrations were higher in winter/fall than summer less the aldehydes for which the case was the reverse. The cause for the higher concentrations observed in winter/fall is likely due to the lower air exchange rates which lead to a slower removal of the pollutants from the indoor environment. For example, in Figure 1, it can be seen qualitatively that there is an inverse relationship between the CO2 concentration measured in the child’s bedroom and the air exchange rate
measured in both summer and winter/fall. The CO2 concentration decreases as the air
exchange rate increase up to about ~0.5 air exchanges per hour after which the CO2
concentration seems to be independent of the air exchange rate. It should be noted that the
CO2 measurements presented in Table 1 and Figure 1 are the 24-hr averages over the 6 to 8
day measurement period as we did not have any information regarding the time of occupancy in the child’s bedroom.
On average, the formaldehyde concentrations observed in heating season would have satisfied
Health Canada’s exposure guideline (Health Canada, 2006) of 50 µg m-3 for an 8-hr exposure
but not during the summer. As formaldehyde is emitted in the home by a variety of off-gassing sources (Gilbert et al., 2008) its concentration is expected to be higher in homes that have lower air exchange rates, which is more often the case in winter and fall. During the summer, however, average formaldehyde concentrations were higher (statistically significant at the 99.9% confidence level as obtained from the student’s t-test) than in winter/fall despite the higher average air exchange rates. A possible explanation could be that the increased temperature and relative humidity in summer would promote the release of formaldehyde from hydrolysis reactions and off-gassing from construction materials and consumer products.
CONCLUSIONS
Our preliminary results indicate that there is a marked seasonal dependence of the air exchange rates and some of the measured IAQ parameters. Most of the pollutants were found
to have higher concentrations in winter or fall, with the exception of the aldehydes, NO2 and
O3. Our data for the pre-intervention phase study indicates that on average the homes do not
meet our nominal ventilation rate goal of 0.30 air exchanges per hour for residential buildings. Based on the PFT measurements, 85% of the homes do not achieve this ventilation rate during the winter/fall period.
ACKNOWLEDGEMENT
The authors would like to thank Karine Barriault (NRC), Kristina Boros (NRC), Jean-Francois Chouinard (INSPQ), Véronique Gingras (INSPQ), Simon Godbout (INSPQ), Pierre-Luc Lamarre (NRC), Véronique Racine (NRC), Jean-François Roy (INSPQ), Stephanie So (NRC), François Tremblay (INSPQ), Catherine Vaillancourt (INSPQ), and Wenping Yang (NRC).
REFERENCES
ASTM. 2006. ASTM Test Method E 741-00, Standard test method for determining air change in a single zone by means of a tracer gas dilution. West Conshohocken: American Society for Testing and Materials
ASTM, 1997. ASTM Test Method D 5197-03, Standard test method for determination of formaldehyde and other carbonyl compounds in air (active sampler methodology). West Conshohocken, American Society for Testing and Materials
ASTM, 2003. ASTM E 779-03, Standard test method for determining air leakage rate by fan depressurization, West Conshohocken: American Society for Testing and Materials Dietz R.N. and Cote E.A., 1982. Air infiltration measurements in a home using a convenient perfluorocarbon tracer technique, Environment International, 8(1-6), 419-433
Gilbert N.L., Gauvin D., Guay, M., Héroux, M.-E., Dupuis G., Legris M., Chan C., Dietz R.N., and Levesque B., 2006. Housing characteristics and indoor concentrations of nitrogen dioxide and formaldehyde in Quebec City, Canada, Environmental Research, 102(1), 1-8
Gilbert, N.L., Guay M., Gauvin, D., Dietz, R.N., Chang, C., and Levesque, B., 2008. Air change rate and concentration of formaldehyde in residential indoor air, Atmospheric Environment, 42 (10), 2424-2428
Health Canada, 2006, Residential indoor air quality guideline: formaldehyde, Publication H128-1/06-432-1E, Ottawa, Canada
Ogawa, 2011, http://www.ogawausa.com/protocols.html
Sherman M., 1998. The use of blower door data. Lawrence Berkeley Laboratory, LBL-35173.