HAL Id: hal-00790796
https://hal-brgm.archives-ouvertes.fr/hal-00790796
Submitted on 6 Feb 2021
HAL is a multi-disciplinary open access
archive for the deposit and dissemination of
sci-entific research documents, whether they are
pub-lished or not. The documents may come from
teaching and research institutions in France or
abroad, or from public or private research centers.
L’archive ouverte pluridisciplinaire HAL, est
destinée au dépôt et à la diffusion de documents
scientifiques de niveau recherche, publiés ou non,
émanant des établissements d’enseignement et de
recherche français ou étrangers, des laboratoires
publics ou privés.
High heat flow in the Trans-Hudson orogen, central
Canadian Shield
Laurent Guillou-Frottier, Claude Jaupart, J.-C. Mareschal, Clément Gariépy,
Gérard Bienfait, Li-Zhen Cheng, Raynald Lapointe
To cite this version:
Laurent Guillou-Frottier, Claude Jaupart, J.-C. Mareschal, Clément Gariépy, Gérard Bienfait, et al..
High heat flow in the Trans-Hudson orogen, central Canadian Shield. Geophysical Research Letters,
American Geophysical Union, 1996, 23 (21), pp.3027-3030. �10.1029/96GL02895�. �hal-00790796�
GEOPHYSICAL RESEARCH LETTERS, VOL. 23, NO. 21, PAGES 3027-3030, OCTOBER 15, 1996
High hea flow in
Trans-Hudson Orogen, central
Canadian
Shield
L Guillou-Frottier
1, C. Jaupart
2 J C Mareschal
1, C Garidpy
1, G Bienfait
2
L.Z. Cheng
I and R. Lapointe
I
Abstract. Nine new heat flow and heat produc-
tion measurements are presented for the Trans-Hudson Orogen, an Early Proterozoic Province between the Archeau Superior and Hearne Provinces of the Cana- dian Shield. Seventeen heat flow values now available
in this region range between 23 and 81 mW.m -2. The
highest value is anomalous and is due to heat reftac-
tion effects in and around highly conducting quartzite
formations. When refraction effects are accounted for,
the Flirt Flon and Thompson belts appear as distinct crustal blocks with different mean heat flow values of
42 4- 3(s.d.) mW.m
-• and 54 4- 8(s.d.)
mW.m
-•. Such
differences can be accounted for by variations in the amount of felsic rocks in the uppermost 15 km of the crust. Comparison between heat flow and elastic thick-
ness studies show that variations in elastic thickness of
the lithosphere are not thermally induced. Introduction
The Trans-Hudson Orogen (THO), located between
the Archeau Hearne and Superior cratons, represents a tectonic collage of several microcontinents and arc terranes which amalgamated in the Early Proterozoic,
between 1.8-1.9 Ga [Lewry and Colletson, 1•0]. Juve-
nile volcanic arcs are preserved within juxtaposed belts, whereas reworked Archeau gneisses are exposed in the
Thompson belt, at the THO-Superior boundary [e.g.
Bleeker, 1990]. Crustal thickness varies between 38 and
48 km [e.g. Lucas et al., 1•3]. The THO is located
in the central part of the North American craton where
the elastic thickness of the lithosphere is largest [Pilk-
ington, 1991].
So far, only eight heat flow measurements were avail- able from sites sparsely distributed across the THO
[Drury, 1985; and references therein]. The objective
of this paper is to present new data and discuss their implications for crustal structure and composition, and
for the thermal regime of the Canadian Shield.
Heat flow data
Heat flow and heat production data are presented for
nine new sites in the THO (Table 1 and Figure 1). The
1
GEOTOP, Universit6 du Qu6bec • Montr6al, Canada
2
Institut de Physique du Globe de Paris, France
Copyright 1996 by the American Geophysical Union. Paper number 96GL02895.
0094-8534/96/96 G L-02895 $05.00
heat flow Q is determined from the measurements of the temperature gradient in boreholes and of the con- ductivity of rock samples:
OT
Q- k O'-•'
(1)
where k is the thermal conductivity, T is temperature and z is depth. The measurements procedures are de-
scribed in Mareschal et al. [1989] and Pinet et al.
[1991]. Analytical errors on heat production measure-
ments are negligible and the only source of uncertainty is the sampling. Comparison of mean heat production from neighboring boreholes provides an estimate of this uncertainty, which is small for this study. Stable tem- perature gradients were obtained over several hundreds
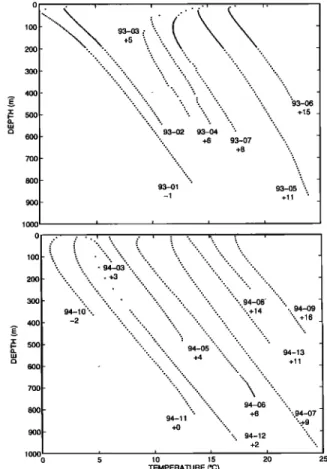
of meters (Table 1 and Figure 2). A climatic correction
for the effect of Pleistocene glaciations was applied to
the data following Jessop [1971]. This was done for con-
sistency with previously published values although such corrections may be overestimated as suggested by Sass
et al. [1971]. In all but one site, the climatic correction is less than 10% of the measured value.
Figure i shows the presently available heat flow data
in the eastern THO. The two extreme heat flow values
in the THO (23 and 81 mW.m
-•) are also the lowest
and highest values yet recorded in the Canadian Shield.
The very low value at Lynn Lake [Drury, 1985] is not
explained and will need further investigation. Heat flow variations
Heat flow values are consistently lower in the Flirt
Flon belt (FFB) than in the Thompson
belt (TB). In
the FFB, heat flow varies within a restricted range of 38
to 46 mW.m -•. In contrast, it is highly variable in the
TB, with values
ranging
from 45 to 81 mW.m
-•. These
distinct thermal signatures are related to differences in
surface geology. The FFB is interpreted as a collage of
island arcs and oceanic plateaux with mafic lavas and calc-alkaline plutons dominating the surface lithology. In the TB, the rock types are more contrasted and vary over a scale of a few kilometers. They include metased- iracuts, mafic to ultramafic lavas, granodiorites, and re- worked Archeau gneisses. Large variations in heat pro- duction and thermal conductivity are observed in the
TB (Table 1).
The high heat flow values near Thompson were ob- tained in highly conductive quartz-rich metasedimen- tary formations. In this area, almost vertical slices of
sedimentary rocks, about 300m wide and 1,000m deep,
are sandwiched between high-grade gneisses due to a
3028 GUILLOU-FROTTIER ET AL- HIGH HEAT FLOW IN THE TRANS-HUDSON OROGEN
Table 1. Heat Flow and Heat Production Data
Site L•.t Lon Alt Dip Ah N k < k > N A < A > G Q •Q AQ Qc Hol .... her (north) (west) (m) (acg) (m) * , K/kin • • • •
W•bowden 0.• 45 93-01 545254 983838 229 76 390-800 12 2.73 1• 0.68 14.6 39.9 1.6 2.7 43 93-02 54 52 54 98 38 38 229 71 280-530 2.92 0.47 14.7 42.8 3.1 3.4 46 Flin-Flon 3 0.3 42 93-03 54 47 00 101 53 00 335 88 380-480 7 3,17 7 0,20 12.1 38,5 2,5 2.9 41 93-04 54 47 14 101 53 10 335 88 450-520 9 2.95 8 0,35 12.2 35,9 1.7 3,0 39 93-07 54 47 14 101 53 18 320 88 210-540 3 3.20 3 0.18 13.1 41,8 2,6 2,8 45 Schist L•ke 0,3 39 93-05 54 43 11 101 49 57 304 65 640-780 13 3.57 11 0.27 9,3 33,2 2,5 5.8 39 Reed L•ke 0.3 40 93-06 54 34 17 100 22 50 280 80 160-420 9 2.74 6 0,35 13.7 37,4 2,5 2,2 40 Birchtree mine i 0.7 50 94-05 554159 975350 221 72 1;• ;• 7 3.27 5 0.75 14.7 48.0 1.6 2.0 50 94-03 55 42 10 97 54 10 207 75 - 0 - 0 - 14.8 .... Birchtree mine 2 1.6 64 94-06 55 42 15 97 51 58 229 80 200-630 10 3.72 11 1.60 16.9 62.7 3.9 1.7 64 Thompson st•tion 1.3 81
s•-o•
55 44 46• • 2• s• •s 22 2o• s•
97 48 48 206 82 310-540•2o-s•o •
•.•
5.35•
•.•
1.08•.s
14.9•.•
79.6•.• •.o
3.0 3.5•s
8394-13 Mo•k L•ke 1.6 53 94-08 55 54 21 97 40 06 206 76 120-250 6 3.21 5 1.69 16.7 53.4 1.6 1.3 55 94-09 55 53 53 97 40 41 214 77 340-540 8 3.43 7 1.61 14.2 48.8 2.1 2.0 51 Pipe mine 1.0 49 94-10 55 29 17 98 07 50 210 83 270-370 4 2.92 •0 1.38 15.6 45.5 1.0 1.6 47 94-11 55 29 10 98 07 54 215 86 550-820 9 3.21 0.78 15.5 49.6 5.3 1.6 51 94-12 55 29 17 98 07 50 210 81 440-870 12 2.91 6 1.06 16.4 47.9 1.4 1.1 49
New heat flow and heat production data measured in the Trans-Hudson Orogen. Parameters are Ah, depth range for heat flow deter- mination; Nk and NA, number of samples for conductivity and heat production measurements; < k > and < A >, average thermal conductivity and heat production rate; G, thermal gradient; Q, heat flow; oQ, standard deviation for heat flow estimate; AQ, climatic correction; and Qc climatically corrected heat flow. Symbols indicate units: *: W.m-i.K-1; $ : •W.m-3; @ : mW.m -2.
succession
of deformation
events
[Bleeker,
1990]. Heat dent. The higher
heat flow value
is in the more
conduc-
flow variations
in the Thompson
area are strongly
re- rive metasediments
(Table 1).
lured to thermal conductivity variations, but are not Previous studies have calculated heat refraction ef-
correlated
with surface
heat production
rates (Figure fects
in peculiar
geometries
[Lee
and
Henyey,
197•]. For
3). Near
the Birchtree
Mine,
two
boreholes,
2kin
apart, this paper,
we have
obtained
an analytical
solution,
in
yield values
of 50 and 64 mW.m
-2. These
two bore-
holes are located on both sides of the transition be-
tween
gneisses
and the Ospwagan
metasediments,
and
hence we consider the two determinations as indepen-
54
103 102 101 100 99 98 97
Figure 1. Heat flow values in the eastern Trans-
Hudson
Orogen
(in roW.
m-2). Diamonds
correspond
to
previously published data (Drury, 1985; and references
therein). Geological
domains
are delineated
: LLB:
Lynn Lake Belt; KD: Kisseynew Domain; FFB: Flin
Flon Belt; TB: Thompson Belt; PU: Pikwitonei Uplift;
$P: Superior Province. Inset: HC: I-Iearne Craton;
$P: Superior Province; G: Grenville Province.
400 500 6OO
•oo "% %,
.•-o•
•oo| ....
",,
X. +•
..
ß 300 .. .•. oo. :. '.,. 93-02 93-+04 +6 7O0 800 90O 1 ooo o lOO 200 300 400 500 6OO 700 800 90O 93-07 +8 93-06 +15 93-01 93-05 "• -1 +11 '.. :?4-07 "..+9 ..• .. -..""
....
. '.
' :':'-;.. ".. 'q• ".. 94-08 '"". ',; 94-09 ".,, ',,+14 ß ,, ",, +16 ß .. '".. '.. . '. ß "'-... ' '". 94-05 ".. ".. ß 94-13'"
'""+4 "%...
....
ß +11'"'... '..
94-06 94-11" '"", ,, +6+0
'""%,
94-12
+2 1•O 15 TEMPERATURE (øC) 1000 0 5 25Figure 2. Measured temperature profiles. For clarity,
temperature profiles are shifted as indicated. Top: pro-
files from the Flin Flon Belt and from Wabowden (see
GUILLOU-FROTTIER ET AL.' HIGH HEAT FLOW IN THE TRANS-HUDSON OROGEN 3029
100 h
oo eat Flow'
'
'
'
'
'
i• •o
j• 60
ß ß
so % . ,10 • ß ,• T'herm•!
Con•!uctiv•ty
-
.•: 3.
2.•-,
I
•
ß ß
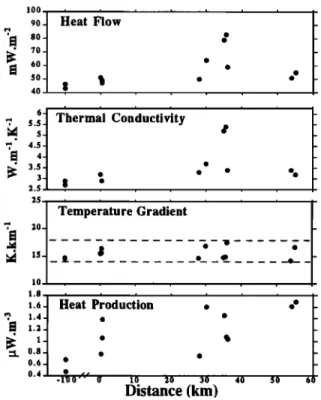
25 ... Temperature Gradient 10 , , ,.6 eat Production ß ? 1.4 ß ß •] 1.2 •L 0.8 ß ß 0.6 ß -1])0 '' 0' 10 Distance (km)Figure 3. Heat flow, thermal conductivity,
temper-
ature gradient and heat production profiles along the
Thompson belt. Origin corresponds to borehole 94-11
(see
Table 1). Temperature
gradients
do not vary much
and high heat flow values are due to large values of
thermal conductivity.
two dimensional and cylindrical geometry, for a conduc- tor embedded in a half-space. The conductor extends
from the surface to a depth of 1; its half-width (or ra-
dius) is a. There are no heat sources. Thermal conduc-
tivity is k in the conductor and i in the surrounding rocks. A constant heat flux of i is imposed at depth far from the conductor. The solution, obtained by solv- ing the steady-state heat equation with the boundary conditions, is dimensionless. It represents the ratio of
the gradient (or heat flow) affected by refraction to the
unperturbed gradient (or heat flow). In cartesian ge-
ometry, the solution for surface heat flow is ß
•
c•,•(k- 1)cosh(k•x)
-
n----0+
coh(a)
and where c•n(1 - k)sinh(kna)exp(kn(a - x)) ksinh(kna) + cosh(kna) (3)kn
= (2n
+ 1)7r
2
ct. - - •
4 (-1)"
(4)
'
7r (2n + 1)
In cylindrical geometry, the solution for surface heat flow is obtained with the modified Bessel functions I0, I1, Ko, K1-
and
c•n(k- 1)Kl(kna)Io(knr)
kI1 (kna)Ko(kna)
-I- K1 (kna)Io(kna)
(5)
•
c•(1- k)Ix(k•a)Ko(k•r)
q•r>a(r)
-- y• O•n-Jt
n--O- lcI1
(lcna)I•O(kna)
-{-
I•1
(lCna)Io(kna)
(6)
Dimensionless heat flow and temperature gradient are shown in Figure 4 for a conductivity contrast of 1.7, which was measured at Thompson. For small a, which is relevant here, there is a sharp discontinuity in heat flow at the boundary, with heat flow much enhanced in the conductive body. At the center of the cylindrical anomaly, heat flow is increased by 1.65. For the same geometry and a conductivity contrast of 2, the gmplifi- cation is 1.92. Outside the conductor, heat flow varies
little regardless of the conductivity contrast. Through-
out the region, the temperature gradient does not vary
much for small a.
In the Thompson area, away from the highly con- ductive metasediments, thermal conductivity values are within the normal range for gneisses and heat flow varies
within a restricted
range
of 45 to 53 mW.m
-2 (Fig-
ure 1). Refraction effects are observed at the Birchtree
mine and Thompson station sites. The analysis above
suggests that the heat flow measured in the low conduc- tivity formation is close to the undisturbed background value. At Birchtree, heat flow is between 50 and 64
roW.
m-2; the mean value of 57 mW.m
-2 provides
an
estimate of the undisturbed heat flow with 12% max-imum uncertainty. Near the Thompson station, heat
refraction effects are more severe because thermal con-
ductivity contrasts are larger (Figure 3). A heat flow
value of 59 mW.m
-2 was obtained
by Drury [198• on
gneisses with "normal" thermal conductivity, 3 kilome-
ters away
from our boreholes
(79 and 83 mW.m
-2) lo-
cated in the "footwall quartzites" of the Pipe formation
[Bleeker, 1990]. Consequently, the undisturbed heat
2 o HEAT FLOW .... cylindrical : two-dimensional /
2[
TEMPERATURE
GRADIENT
- - -: cylindrical ,5 : two-dimensional.5 ._•,.•
a=2
0.5 0 2 4 6 0 2 4 6Horizontal distance Horizontal distance
Figure 4. Surface heat flow and temperature gradi-
ent variations due to heat refraction by a conductor of thermal conductivity contrast of 1.7. The dimensionless
3030 GUILLOU-FROTTIER ET AL' HIGH HEAT FLOW IN THE TRANS-HUDSON OROGEN • O• -
'•t 8 0-
• 7t)- ' - • o• 60-
o
•-
50
_•••••o •
-
• 40
-
• ß F/in F/on Bolt
• 3 0 = 0 r•om•on Bolt -
• • • La•, Bolt
•
20 o•
•
•
•
0 0.5 1 1.5 2
Heat Production A ( gW.m'
3 )
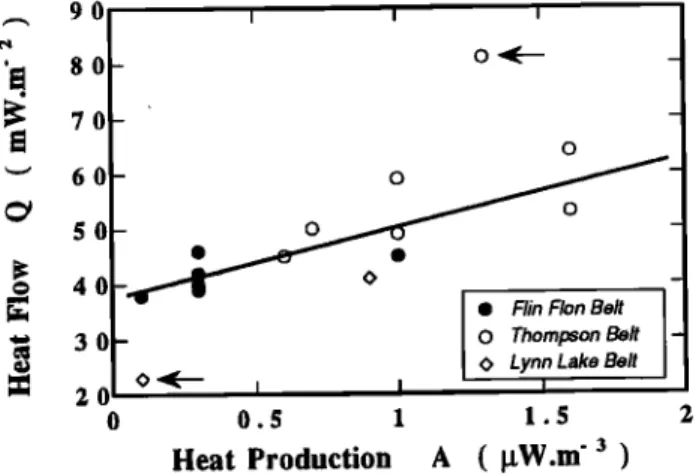
Figure •. Hea• flow and hea• production da•a where Flin Flon, Thompson and Lynn Lake bel•s are identi-
fied. Anomalous da•a (arrows) were no[ included in •he
calculation of •he linear relationship "Q - Q• + A.D"
(see
flow is estimated at 68 rnW. m -2 with 15% uncertainty
(relative
to the measured
values).
Heat flow values in the TB are higher than in the
FFB. Average
heat flow is 42 4-3(s.d.) rnW.
m -• in
the FFB versus
54 4- 8(s.d.)
rnW.
m -• in the TB. The
corresponding
average
heat production
rates are 0.4 4-
0.3(s.d.)
and 1.2
4- 0.3(s.d.)luW.
m -3. Thus,
differences
in average
crustal
composition
over
a thickness
of about
15 krn could account for the difference in heat flow. The
relationship
betwben
local values
of heat flow and heat
production
is shown
in Figure 5. The whole
data set
(without
the two
extreme
and
anomalous
values)
yields
an apparent
thickness
D for radiogenic
heat production
of 12.7 krn and reduced
heat flow Qr = 38rnW
.m-•.
Discussion
The Trans-Hudson Orogen represents a collisional structure among several small Archean blocks. Sub-
duction and continental collision are known to induce
melting of the lower crust and transport radioactive sources within the crust. This study suggests that, if such events have occurred in the Trans-Hudson Orogen, they were more important near its eastern margin and they led to the concentration of felsic rocks beneath the Thompson belt. Indeed, seismic studies show a variable upper crust overlying a relatively homogeneous lower
crust assumed Archean in age [Lucas et al., 1993].
The heat flow data in the THO raise questions about interpretation of the elastic thickness of the lithosphere.
In Canada, the elastic lithosphere is thickest (> 120krn)
near the THO [Pilkington,
1991]. It is twice as thick as
in the eastern Shield. Most of the variability in surface heat flow in the Shield can be accounted for by crustal heat production and the "high" heat flow values in the
THO are not consistent with a lithosphere colder than in the eastern Shield. Concepts dealing with a litho- spheric root or a thick elastic lithosphere in the central
Canadian Shield could thus be related to differences in
composition but not to thermal regime.
Acknowledgments. Helpful comments by W. Bleeker
and a constructive review by J. Sass were greatly appreci-
ated. Reviews by P. Armstrong, D. Chapman and P. Stod- dard are also acknowledged. This research was supported by NSERC (Canada), FCAa (Qudbec) and INSU (CNRS, France). This is LITHOPROBE publication 783.
References
Bleeker, W., New structural-metamorphic constraints on Early Proterozoic oblique collision along the Thompson Nickel Belt, Manitoba, Canada, in Lewry, J.F. and Stauf- fer,M.R., eds., The Early Proterozoic Trans-Hudson Oro- gen of North America, Geol. Ass. Canada, Spec. Pap.
37, 57-73, 1990.
Drury, M.J., Heat flow and heat generation in the Churchill
Province of the Canadian Shield, and their paleotectonic
significance, Tectonophys., 115, 25-44, 1985.
Jessop, A.M., The distribution of glacial perturbation of
heat flow in Canada, Can. J. Earth Sci., 8, 162-166, 1971.
Lee, T.C., and T.L. Henyey, Heat-flow refraction along dis-
similar media. Geophys. J. Roy. Astr. Soc., 39, 319-333,
1974.
Lewry, J.F., and K.D. Collerson, The Trans-Hudson Oro- gen: extent, subdivision, and problems, in J.F. Lewry and M.R. Stauffer (Editors), The Early Proterozoic Trans- Hudson Orogen of North-America, Geol. Assoc. Can.
Spec. Pap., 37, 1-14, 1990.
Lucas, S.B., A. Green, Z. Hajnal, D. White, J. Lewry, K. Ashton, W. Weber and R. Clowes, Deep seismic profile
across a Proterozoic collision zone: surprises at depth, Nature, 363, 339-342, 1993.
Mareschal, J-C., C. Pinet, C. Garidpy, C. Jaupart, G. Bi- enfait, G. DMla-Coletta, J. Jolivet and R. Lapointe, New heat flow density and radiogenic heat production data in
the Canadian Shield and the Qu4bec Appalachians, Can. J. Earth Sci., 26, 845-852, 1989.
Pilkington M., Mapping elastic lithospheric thickness varia-
tions in Canada, Tectonophys., 190, 283-297, 1991.
Pinet, C., C. Jaupart, J-C. Mareschal, C. Gari4py, G. Bi- enfait and R. Lapointe, Heat flow and structure of the lithosphere in the eastern Canadian Shield, J. Geophys.
Res., 96, 19941-19963, 1991.
Sass, J.H., A.H. Lachenbruch and A.M. Jessop, Uniform heat flow in a deep hole in the Canadian Shield and its paleoclimatic implications, J. Geophys. Res., 76, 8586-
8596, 1971.
L. Guillou-Frottier and J.C. Mareschal, Geotop, UQAM, P.O. 8888, Succ. Centre-Ville, Montreal, H3C 3P8,
Canada, emaih laurent or jcm @volcan.geotop.uqam.ca C. Jaupart, Institut de Physique du Globe de Paris, 4 Place Jussieu, 75252 Paris cedex 05, France, email:
(received April 23, 1996; revised July 10, 1996;