Cancer Medicine. 2019;8:3685–3697. wileyonlinelibrary.com/journal/cam4
|
3685 O R I G I N A L R E S E A R C HProfiling of circulating tumor DNA in plasma of non‐small cell
lung cancer patients, monitoring of epidermal growth factor
receptor p.T790M mutated allelic fraction using beads, emulsion,
amplification, and magnetics companion assay and evaluation in
future application in mimicking circulating tumor cells
Jessica Garcia
1,2,3,4|
Anne‐Sophie Wozny
1,3|
Florence Geiguer
1,3,4|
Aurélia Delherme
1,3,4|
David Barthelemy
1,2,3,4|
Patrick Merle
5|
Claire Tissot
6|
Frederick S. Jones
7|
Chassidy Johnson
8|
Xiaobin Xing
9|
Zhenyu Xu
9|
Daniel L. Edelstein
7|
Marie Brevet
2,3,10|
Pierre‐Jean Souquet
11|
Claire Rodriguez‐Lafrasse
1,12|
Léa Payen
1,2,3,4|
Sébastien Couraud
3,11,131Laboratoire de Biochimie et Biologie Moléculaire, Groupe Hospitalier Sud, Hospices Civils de Lyon, Lyon, France
2Cancer Research Center of Lyon, INSERM U1052, CNRS UMR5286, Claude Bernard University, University of Lyon, Lyon, France 3CIRculating CANcer (CIRCAN) program, Hospices Civils de Lyon Cancer institute, Lyon, France
4Laboratoire Commun de Recherche Hospices Civils de Lyon – BioMérieux, Centre Hospitalier Lyon Sud, Hospices Civils de Lyon, Lyon, France 5Service de Pneumologie et oncologie thoracique, CHU G Montpied, Clermont‐Ferrand, France
6Service de Pneumologie et Cancérologie Thoracique, CHU Saint Etienne, Saint‐Priest‐en‐Jarez, France 7Medical Scientific Affairs, Sysmex Inostics, GmBH, Hamburg, Germany
8Biolidics Limited, Singapore, Singapore
9SOPHiA GENETICS SA, Headquarters, Saint Sulpice, Switzerland
10Institut de pathologie multisites des HCL‐Site Est, Hospices Civils de Lyon, Lyon, France
11Service de Pneumologie aigue spécialisée et cancérologie thoracique, Groupement hospitalier sud, Institut de Cancérologie des Hospices Civils de Lyon,
Lyon, France
12UMR CNRS 5822/IN2P3, IPNL, PRISME, Laboratoire de Radiobiologie Cellulaire et Moléculaire, Faculté de Médecine Lyon‐Sud, Université Lyon 1,
Lyon, France
13EMR 3738 Ciblage Thérapeutique en Oncologie, Faculté de médecine Lyon Sud, Université Lyon 1, Université de Lyon, Lyon, France
This is an open access article under the terms of the Creat ive Commo ns Attri bution License, which permits use, distribution and reproduction in any medium, provided the original work is properly cited.
© 2019 The Authors. Cancer Medicine published by John Wiley & Sons Ltd.
This work was presented at the 2018 ESMO congress (Munich, October 2018) (AnnOncol [2018] 29 [suppl_8]: viii14‐viii57. 10.1093/annonc/mdy269). Correspondence
Sébastien Couraud, Hospices Civils de Lyon, Centre Hospitalier Lyon Sud, 165, Chemin du Grand Revoyet, Lyon, 69310 Pierre‐Bénite, France.
Email: sebastien.couraud@chu-lyon.fr Léa Payen, Hospices Civils de Lyon, Centre Hospitalier Lyon Sud, 165, Chemin du Grand Revoyet, Lyon, 69310 Pierre‐Bénite, France. Email: lea.payen-gay@chu-lyon.fr
Abstract
Cell‐free plasma DNA (cfDNA) and mimicking circulating tumor cells (mCTCs) have demonstrated tremendous potential for molecular diagnosis of cancer and have been rapidly implemented in specific settings. However, widespread clinical adop-tion still faces some obstacles. The purpose was to compare the performance of a BEAMing (beads, emulsion, amplification, and magnetics) assay (OncoBEAM™‐ epidermal growth factor receptor [EGFR] [Sysmex Inostics]) and a next‐generation
1
|
INTRODUCTION
Knowledge of the molecular complexity of cancers and the role of oncogenic drivers such as mutations in genes encod-ing the Epidermal Growth Factor Receptor (EGFR) has flour-ished in the era of targeted therapies.1,2 Molecular profiling
of a cancer patient's tumor to reveal targetable alterations is an important first step in the personalization of cancer treat-ment plans. Usually, these molecular mutational analyses are performed on Formalin‐Fixed Paraffin‐embedded (FFPE) tissue biopsies or cytological samples at diagnosis or upon recurrence.3 Mutational analysis of FFPE tumor samples,
however, poses several limitations and challenges, includ-ing the invasive procedures required to obtain them, as well as the risk of obtaining false‐negative results due to tumor spatial heterogeneity or low tumor cellularity.4,5 Biopsies of
advanced stage Non‐Small Cell Lung Cancers (NSCLC) re-quire invasive exams in fragile patients and “liquid biopsies” have generated a considerable enthusiasm in this particular setting. Reassessing molecular alterations at progression is crucial in some particular settings of NSCLC. Indeed, the use of cell‐free DNA (cfDNA, including DNA from normal cells and cancer cells) for the detection of sensitizing and/or resis-tant somatic alterations in oncodrivers was integrated to the EMA approval. The use of circulating tumor cells (CTCs), although not yet routinely used, has led to very promising
complementary results in the context of molecular and phe-notypic characterization, prognosis and predictive signifi-cance in NSCLC (DNAseq, RNAseq, miRNA and protein). CTCs are cells from the tumor, whole and living, circulating in the whole blood.
Temporal heterogeneity is also a major limitation, par-ticularly if a targetable alteration such as the p.T790M EGFR mutation emerges in response to first‐line tyrosine kinase inhibitor (TKI) therapy. Particularly, challenging in NSCLC is the restrieval of adequate tissue biopsy speci-mens for molecular analysis at diagnosis, which is not pos-sible in approximately 10‐15% of advanced or metastatic NSCLC. Currently, few rebiopsies are performed in ad-vanced NSCLC due to the invasiveness of the procedure, combined with the reluctance of patients with a poor per-formance status to be rebiopsied. However, it is not possi-ble to properly target treatments in cases of relapse without knowing the nature of the disease during progression. In an analysis of complication rates of biopsies obtained in 57 clinical trials, the complication rate for intrathoracic bi-opsies was 17.1%, or 36 of 211 bibi-opsies.6,7Another major
issue is the highly variable and extended time it takes for tissue biopsy results to return to the clinic versus the urgent need to begin treatment in patients with advanced disease. The time lapse between a physician's request and receipt of molecular diagnostic test results is highly variable across
Funding information
This work was supported by research grants from Astra‐Zeneca (London, United‐ Kingdom) and the Ligue Contre le Cancer (Saone et Loire, France).
sequencing assay (NGS; 56G Oncology panel kit, Swift Bioscience) to detect the p.T790M EGFR mutation in cfDNA of non‐small cell lung cancer (NSCLC) patients. CfDNA samples (n = 183) were collected within our hospital from patients having a known EGFR sensitizing mutation, and presenting disease progression while under first‐line therapy. EGFR mutations were detected using NGS in 42.1% of samples during progression in cfDNA. Testing using the OncoBEAM™‐EGFR assay enabled detection of the p.T790M EGFR mutation in 40/183 NSCLC patients (21.8%) ver-sus 20/183 (10.9%), using the NGS assay. Samples that were only positive with the OncoBEAM™‐EGFR assay had lower mutant allelic fractions (Mean = 0.1304%; SD ± 0.1463%). In addition, we investigated the detection of p.T790M in mCTCs using H1975 cells. These cells spiked into whole blood were enriched using the ClearCellFX1 microfluidic device. Using the OncoBEAM™‐EGFR assay, p.T790M was detected in as few as 1.33 tumoral cells/mL. Overall, these findings highlight the value of using the OncoBEAM™‐EGFR to optimize detection of the p.T790M muta-tion, as well as the complementary clinical value that each of the mutation detection assay offers: NGS enabled the detection of mutations in other oncogenes that may be relevant to secondary resistance mechanisms, whereas the OncoBEAM™‐EGFR assay achieved higher sensitivity for detection of clinically actionable mutations.
K E Y W O R D S
the world. In one report the average time to clinical report-ing was 27 days with a range of 14 to 77 days.8 Altogether,
these limitations prompt the need for accurate and sensitive mutation detection technologies that do not rely on inva-sive tumor tissue sampling. Sensitive detection technolo-gies capable of accurately detecting mutations in plasma samples obtained from blood provide a minimally invasive alternative to tissue‐based methods.9-11 This clinical need
has prompted the development and regulatory approval in the United States and Europe of plasma EGFR companion diagnostic tests based on either real‐time or conventional polymerase chain reaction (PCR).12 Conventional and real‐
time PCR carries out one reaction per single sample and provides one signal. Thus, with conventional PCR if a rare mutant molecule is present and provides a weak signal, it may not be detected in the sample, because the signal is lost among the abundant nontumor signal, as well as signal from tumor DNA unrelated to the mutation. To this end, highly sensitive and selective technologies have been de-veloped to overcome the inherent challenge of obtaining a strong signal from the very low fraction of tumor‐derived DNA in comparison to the wild‐type (WT) fraction.11 In
this regard, BEAMing (beads, emulsion, amplification, and magnetics), a technology based on digital PCR, which entails partitioning the PCR process into many individual reactions in order to provide higher resolution for the less frequently encountered DNA sequences (ie mutated DNA), appears to be a highly promising technique. It can identify mutations at a mutant allele fraction (MAF) of 0.02% and has previously been demonstrated to be among the most sensitive methods to detect mutations from circulating tumor DNA (ctDNA)11,13 In addition, next‐generation
se-quencing (NGS) technologies, including the 56G Oncology panel (NGS‐56G) are now demonstrating sensitivity levels as low as 0.5% MAF in clinical use.11 One remaining hurdle
is the identification of somatic alterations in patients whose tumor biology does not provide sufficient levels of ctDNA material to allow detection. The proportion of patients with detectable ctDNA varies by indication,14 stage of disease,15
tumor burden, tumor location and other biological charac-teristics that may be unrelated to the tumor.16,17 In EGFR‐
mutated NSCLC patients who progress during first‐line TKI treatment, the frequency of false‐negative results for p.T790M detection in ctDNA remains high (approximately 20%‐30%). This is in part due to limited levels of ctDNA and is highly dependent on the method used for mutational analysis.18,19 Given these considerations, the objective of
the present study was to assess the utility of detecting mu-tations in ctDNA and in mimicking circulating tumor cells (mCTCs) using the digital PCR OncoBEAM™‐EGFR assay compared to NGS‐56G to detect the p.T790M EGFR mutation in paired samples. As an exploratory analysis, we wondered whether p.T790M could be detected from mCTC
using the ClearCell FX device (Biolidics Limited, Science Park, Singapore 118257).
2
|
MATERIALS AND METHODS
2.1
|
Patients
Samples were prospectively collected within the frame-work of the CIRCAN (“CIRculating CANcer”) project based at Lyon University Hospital. In this analysis, we used plasma samples from patients with a known EGFR sensitizing mutation, whose disease progressed after re-ceiving first‐line EGFR TKI therapy (afatinib, erlotinib, or gefitinib, which were prescribed upon physician choice and used according to regulatory approvals) (n = 183). Plasma samples were sent to our laboratory by physicians in the context of routine detection of EGFR p.T790M mutation. As recommended in France, EGFR p.T790M substitution is screened using blood‐based samples as the first intent of tumor genotyping in this setting.20 Blood sampling was
primarily performed when physicians documented disease progression (according to RECIST 1.1 criteria) during reg-ular follow‐up CT‐scans (usually performed quarterly). All tumor cases were histologically or cytologically confirmed on FFPE biopsy specimens or cytological samples at initial diagnosis and EGFR sensitizing mutation detection was performed either on FFPE tumor samples or using cfDNA in case of tumor tissue genotyping failure as part of routine practice. For analysis of ctDNA at progression, extraction and mutation detection steps were performed by investi-gators who did not have access to or prior knowledge of clinical data including results from initial EGFR sensitiz-ing mutation detection tests.
In this cohort, a subset of patients underwent several serial cfDNA analyses as recommended by their physician due to suspicion of progression at the time of CT‐scan. Most were patients, clinically asymptomatic, but showed evidence of radiological progression. All samples were processed similarly.
2.2
|
Sample collection
Plasma was prepared from 20‐30 mL of blood collected in K2
EDTA tubes (BD, 367525, 18 mg). All blood samples were delivered to the laboratory within 24 hours after collection. Detailed preanalytical considerations have previously been published.10
2.3
|
DNA extraction from plasma
Cell‐free DNA was extracted from 4 mL or 8 mL of plasma using the QIAamp Circulating Nucleic Acid Kit (Qiagen, Cat No 55114, Valencia, CA, USA), with a Qiagen vacuum
manifold following the manufacturers’ instructions. cfDNA was then eluted in a final volume of 60‐110 µL elution buffer (AVE), depending on the volume of plasma used for the ex-traction (4 mL or 8 mL).10
2.4
|
EGFR p.T790M detection using
BEAMing assay
cfDNA was analyzed for EGFR p.T790M mutation with BEAMing using the OncoBEAM™‐EGFR assay (Sysmex Inostics) according to the manufacturer's instructions. This particular version of the assay detects only the p.T790M and not other EGFR sensitizing mutations, such as p.L858R and Exon 19 deletions (DelEx19). All experiments were conducted at the Lyon Universitary Hospital. Briefly, as described previously,11 the cfDNA sample was diluted in
123 µL of AVE buffer (Qiagen). A PCR Master Mix, spe-cifically targeting p.T790M was mixed with the cfDNA samples and split into six replicate of 65 µL reactions in the initial target‐specific spanning PCR. Five microliters of PCR product, diluted in low EDTA‐TE buffer (pH 8.0) was used for emulsion PCR. After breaking the emulsion PCR reac-tion, WT and mutant‐specific probes were hybridized and flow cytometry analysis was conducted using a cytometer (BD Bioscience, Erembodegem, Belgium). The threshold of positivity is defined by two parameters: the MAF had to ex-ceed 0.02% and the absolute number of mutant beads had to be greater than 50.11 All samples with lower mutated bead
counts were considered negative, even if the MAF exceeded 0.02%, this is most likely due to a low cfDNA input amount, typically below 2 ng. Polyclonal beads were detected accord-ing to their Poisson distribution.
2.5
|
Targeted next‐generation sequencing
56G oncology panel (NGS‐56G)
cfDNA libraries were created using the multiple targeted am-plicon technology provided by Swift Biosciences according to the manufacturer's instructions (56G Oncology Panel Kit, Swift Biosciences, Ann Arbor, MI, Cat. No AL‐56248).11 The
NGS‐56G assay covered the main EGFR exons (18, 19, 20 and exon 21) in which EGFR sensitizing mutations are usu-ally detected (90% of all EGFR activating mutations21) and
the p.T790M. The assay also covered mutations in 55 other genes, including KRAS, MET, and TP53. Fastq files, obtained by the demultiplexing of Base‐Call Files (BCL), were ana-lyzed with the Sophia DDM Platform version 5.1.9 (Sophia Genetics, Saint‐Sulpice, Switzerland). The human genome Hg19 (GRCh37.p5) was used as the reference genome. The resulting Binary Alignment Map (BAM) files were rea-ligned for soft‐clipping regions to recover potential indels. Variant calls were conducted by comparing the nonreference base against the averaged mean error of the corresponding
averaged base quality for a given position. The subsequent Variant Call Files (VCF) were subjected to cross sample background filtering with potential artifacts removed below three standard deviations of the mean background noise for each position. Filter criteria for variant calling were set to an absolute mutated allele read counts ≥50, a minimal total depth >500 X, and a MAF threshold ≥0.5%.11
2.6
|
Positive and negative cell lines for the
p.T790M EGFR Mutation
In an exploratory analysis, we assessed the performance of EGFR p.T790M detection in mCTC using the ClearCell FX assay (Biolidics). We first assessed the cell recovery rate of the ClearCell FX device using a cancer cell line (PC‐3) with a size greater than 15 µm. Cells were cultured in DMEM medium supplemented with 10% of Fetal Bovine Serum (Gibco, MD, USA) and 1% Penicillin/Streptomycin (Gibco, MD, USA) at 37°C with 5% of CO2. The
microflu-idic ClearCell FX system using a low‐pressure vacuum sys-tem which isolates CTCs based on size exclusion (> 11 µm) was used as previously described.22 PC‐3 cells (18 µm)23
were stained with 2 µL of CellTracker™ Green CMFDA Dye live cell stain (ThermoFisher–C2925, Waltham, USA 02451) per 10 000 cells and numbered under a fluorescent microscope. Stained cells were then spiked into healthy whole blood and a cell lysis was performed to remove red blood cells. After the enrichment run, the output tube containing enriched and stained cells was centrifuged at 500 g for 10 minutes. The supernatant was carefully re-moved and the pellet was resuspended in 100 µL of PBS. Immunofluorescence staining was performed using an anti-body anti‐CD45 labeled with Alexa Fluor 647 (Biolegends, #304018) to differentiate mCTCs from white blood cells and assess the mCTC recovery after enrichment with the ClearCell FX. The cells were numbered with a fluorescent microscope. The number of recovered cells was compared to the input of stained cells (n = 16) and a recovery ratio was calculated.
Following CTC recovery, we investigated whether p.T790M EGFR mutation was detectable in mCTCs, using the p.T790M‐positive cell line NCI‐H1975 (15 µm).24 To
exam-ine the specificity of p.T790M detection, the p.T790M‐nega-tive cell line HCC827 (19 µm)25 was used. These NCI‐H1975
and HCC827 cell lines were purchased from American Type Culture Collection (ATCC, Teddington, UK). These cells were cultured in RPMI‐1640 (ATCC) complemented with 10% of Fetal Bovine Serum (Gibco) and 1% Penicillin/ Streptomycin (Gibco) and grown at 37°C with 5% CO2. Cells
were stained with a fluorescent dye (ThermoFisher‐C2925) and were numbered with a fluorescent microscope. Then, defined numbers of fluorescent tumoral cells, or mCTCs, (5 to 100 cells/sample) were (i) stored at −20°C to evaluate
the performance of p.T790M detection without white blood cells, or (ii) spiked into healthy whole blood and enriched with the microfluidic ClearCell FX (Biolidics) device ac-cording to the manufacturer’s recommendations. Finally, DNA of these isolated tumoral cells with these two condi-tions were extracted using the Qiagen Micro kit extraction (Qiagen, Cat No./ID: 56304, Valencia, CA, USA) and ana-lyzed with both OncoBEAM™‐EGFR and NGS‐56G assays as specified above.
2.7
|
Ethical considerations
The CIRCAN study was considered to be an observational study by the local ethics committee of Lyon (Ref L15‐74; 04/29/2015). As required, the study was declared to the local authorities, since patient health data were recorded (Ref 15‐045; 05/15/2015). Furthermore, all of the patients were given detailed information about the present study and signed a written consent form. All of the samples and medical data used in the CIRCAN study were anonymized.
2.8
|
Statistical analysis
Statistics were performed using the latest version of GraphPad InStat software Version 6 (GraphPad Software, Inc, La Jolla, CA, USA). Normal distribution of continuous variables was assessed with the Shapiro‐Wilk normality test. We used the Mann‐Whitney test for nonnormally distributed variables and the Student t‐test for normalized data. Binary logistic regression was used to assess the association between occurrence of p.T790M mutation detection and the assay. All
tests were 2‐sided and a P‐value <0.05 was considered sta-tistically significant.
3
|
RESULTS AND DISCUSSION
3.1
|
Accuracy of p.T790M EGFR mutation
detection assays
To assess the specificity and sensitivity of the OncoBEAM™‐EGFR assay for p.T790M detection, WT and mutated p.T790M EGFR Horizon cfDNA controls were used at different allelic frequencies (0.1% and 1% MAF) (Figure 1). First, specificity of the assay was determined using the WT Horizon cfDNA control (n = 21). These experiments re-vealed a mean of 13 (SD ± 6) samples with mutant copies corresponding to a MAF of 0.0082% (SD ± 0.005%), well below the assay cutoff of 0.02%. Second, we assessed assay sensitivity using Horizon cfDNA control p.T790M mutated with different levels of cfDNA input (from 2 to 50 ng). The BEAMing assay was able to detect the p.T790M mutation if the cfDNA input was greater than 15 ng (n = 4) for an allelic frequency set at 0.1% MAF. To detect p.T790M at 1% MAF, an even lower cfDNA input of 2 ng was required (n = 4). The performance of the assay at these low DNA concentrations allowed us to validate a workflow for the assay to routinely perform early and/or low abundance detection of p.T790M in cfDNA at disease progression. In parallel, the sensitiv-ity of the NGS‐56G assay was determined to be 80% and 91% for 2 and 5 ng cfDNA inputs, respectively, using the TruQ‐7 Horizon Control (1%‐1.3% p.T790M MAF) (data not shown). Analyses of assay sensitivity at level of 0.1%
FIGURE 1 Mutated allelic frequency of p.T790M mutation observed in wild‐type control and Horizon cell‐free DNA control mutated at 0.1% and 1% using the OncoBEAM™‐epidermal growth factor receptor assay. The number of experiments is annotated and for each case, the mean and standard deviation is calculated. The error bars correspond to the standard deviation
WT DNA AF(%) = 0.1%
50 - 20 ng AF(%) = 0.1% 15 - 20 ng AF(%) = 0.1% 11 - 5 ng AF(%) = 0.1% 5 - 2 ng AF(%) = 1% 10 - 5 ng AF(%) = 1% 5 - 2 ng 0.01
0.10 1 10
Horizon cfDNA control
Al le lic freq ue nc y of p. T7 90 M mu ta te d co pi es % n = 21 Mean = 0.008 SD : 0.005 n = 8 Mean = 0.0890 SD : 0.0416 n = 3 Mean = 0.0078 SD : 0.0019 n = 6 Mean = 0.00815 SD : 0.0034 n = 5 Mean = 0.5840 SD : 0.2529 n = 4 Mean = 0.3264 SD : 0.2991 n = 4 Mean = 0.0403 SD : 0.0173
MAF was not studied using NGS‐56G, since the threshold of sensitivity of 0.5% MAF is the lowest limit of detection for this assay.
3.2
|
Detection of EGFR p.T790M mutation
at disease progression
Overall, 183 samples of cfDNA were tested for EGFR p.T790M mutation detection in parallel to compare the perfor-mance of both the OncoBEAM™‐EGFR and the NGS‐56G assays. Figure S1 displays the distribution of cfDNA concen-tration in the cohort. Most samples (84%) had a concenconcen-tration range between 1 and 5 ng/µL, limiting the cfDNA input in some reactions. The mean cfDNA concentration was 3.5 ng/ µL (±6.24), which is in agreement with the DNA concentra-tions obtained and used in our previous work.10,11
Using the NGS‐56G assay, EGFR sensitizing mutations were detected in 42.1% (77/183) of plasma samples; 28.4% (52/183) were DelEx19 and 13.6% (25/183) were p.L858R. The concordance of cfDNA and tissue sample results was 98.7% (76/77) with only one mutation missed in tissue at di-agnosis. Futhermore, among the patients with EGFR sensi-tizing mutations, the associated resistant mutation p.T790M was found in 42.8% (33/77) using the OncoBEAM™‐EGFR assay (Mean %: 1.4261 ± 3.1315) and in 25.9% (20/77) using the NGS‐56G assay (Mean %: 6.2 ± 12.7%) (Table 1). Among the 107 samples in which no EGFR activating muta-tion was detected, 6.6% (7/106) were p.T790M positive (Mean %: 0.1146 ± 0.1102) using the OncoBEAM™‐EGFR assay and 0/107 were p.T790M positive using the NGS‐56G assay (Tables 1 and 2).
With respect to the overall detection of EGFR p.T790M mutation in all plasma samples, 21.8% (40/183) were positive for the p.T790M mutation using the OncoBEAM™‐EGFR
assay, whereas only 10.9% (20/183) samples were positive using the NGS‐56G assay (Tables 1 and 2). The odds ratio of detecting a p.T790M mutation was 7.8‐fold higher using the OncoBEAM™‐EGFR assay versus the NGS‐56G assay (78.01 [IC95%: 4.629‐1315] for OncoBEAM™‐EGFR assay and 10.96 [IC95%: 4.499‐26.72] for NGS‐56G assay).
A strong correlation was found between the OncoBEAM™‐EGFR assay and the NGS‐56G assay for p.T790M detection with 20 concordant cases (R2 = 0.94)
(Figure 2). The 21 discordant results (ie, p.T790M positive using OncoBEAM™‐EGFR, but p.T790M negative using the NGS‐56G assay) were found to contain low EGFR p.T790M MAF; the MAF values detected using OncoBEAM™‐EGFR in these discordant samples were on average, less than 0.50% (Mean = 0.13% ± 0.14%).
Approximately 35% of the NSCLC patients harbor-ing an EGFR activatharbor-ing mutation at diagnosis and treated with EGFR TKI acquired a mutation at progression, with the p.T790M point mutation comprising the largest per-centage.26,27 The p.T790M resistance mutation results in a
substitution of a threonine for methionine in the EGFR pro-tein which is known to increase the binding affinity of the EGFR to ATP, thereby activating the EGFR signaling path-way and leading to disease progression and drug resistance. The EGFR p.T790M mutation has been found copresent in therapy‐resistant NSCLC patients along with EGFR activat-ing mutations (p.L858R and DelEx19) which reduced first generation EGFR TKI binding.28-30 Structural analyses via
crystallography of the EGFR protein have demonstrated that the point mutation p.T790M leads to steric hindrance of the TKI and induces treatment resistance.31 There have been two
main hypotheses provided to explain the occurrence of the p.T790M mutation at progression: (a) de novo acquisition of the mutation, and/or (b) preexisting p.T790M clones in low
TABLE 1 Table summarizing the distribution of p.L858R and DelEx19 positive and negative patients found with NGS‐56G assay
Resistance Mt
Princeps Mt
OncoBEAM™‐EGFR p.T790M NGS‐56G
p.L858R or DelEx19
positive p.L858R or DelEx19 negative p.L858R or DelEx19 positive L858R or DelEx19 negative
p.T790M positive (N; %) 33 (43.8%) 7 (6.6%) 20 (25.9%) 0
Mean allelic frequency in %
(SD) 1.4261 (3.1315) 0.1146 (0.1102) 6.2 (12.7) —
p.T790M negative (N; %) 44 (57.2%) 99 (92.4%) 57 (73.7%) 106 (100%)
Mean allelic frequency in %
(SD) 0.0084 (0.0074) — 0.01 (6 × 10
−19) —
Total (N) 77 106 77 106
EGFR, epidermal growth factor receptor; NGS, next‐generation sequencing.
For these two categories, the number of patients harboring the resistance mutation p.T790M is annotated for OncoBEAM™‐EGFR assay and NGS‐56G assay, respectively.
abundance/aggressiveness that are encouraged to emerge under TKI selective pressure.27,32 De novo acquisition of
the p.T790M mutation during therapy administration is the more unlikely explanation, since this has been observed to occur in less than 1% of cases.33-35 Therefore, the more likely
mechanism of p. T790M mutation occurrence at resistance is by selection and then outgrowth of preexisting clones that contain this mutation. Zou et al 36 proposed two hypotheses
explaining acquisition of p.T790M under TKI pressure: (a) residue 790 in EGFR is positioned at the back of the entrance of ATP binding site and steric hindrance induces the change of methionine in threonine; and (b) the substitution of me-thionine to threonine increases the affinity to ATP and re-duces the TKI binding. They found that tumors harboring the DelEx19 activating mutation had less stability around residue 790 than tumors containing p.L858R; this in part explains why there may be a greater prevalence of NSCLC patients in which p.T790M copresent with DelEx19 vs patients who copresent with L8588R.36,37
At least one somatic mutation according to the COSMIC database (including EGFR and other genes) was found in 104/183 (56.8%) of samples using the NGS assay. Among samples with no EGFR mutations (EGFR activating and/ or p.T790M), we found that 15% of these patients (15/100) had TP53 somatic alterations (MAF range 0.8%‐34%), with 32.5% of the TP53 mutations occurring in exon 5 and another 30.2% occurring in exon 8, respectively. Other mechanisms
of TKI resistance in NSCLC patients in which p. T790M mutations are not detected have also been described; this in-cludes activation of downstream signaling pathways (mainly
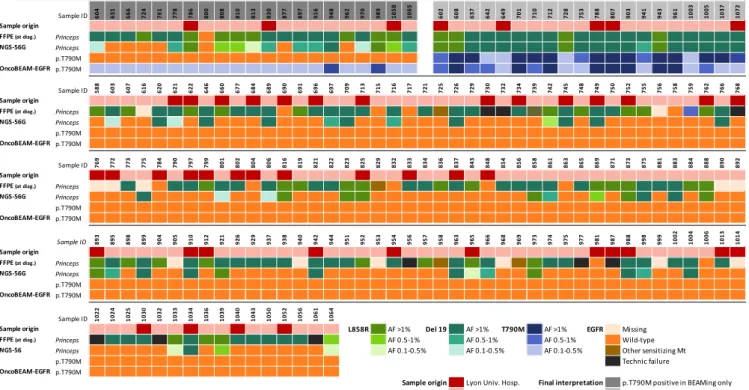
TABLE 2 Heatmap representing the cell‐free DNA (cfDNA) sample origin, the associated FFPE results (at initial diagnosis), as well cfDNA results: (a) the principal epidermal growth factor receptor (EGFR) mutation detected (at disease progression) and (b) the resistance mutation (at disease progression) detected with both the OncoBEAM™‐EGFR and the NGS‐56G assays for the whole cohort
60 4 63 1 66 6 72 4 76 1 77 8 78 6 80 0 80 8 81 0 81 3 83 0 87 7 89 7 91 6 94 8 96 2 97 0 98 9 10 58 1065 602 608 637 264 649 701 710 712 872 753 788 807 903 941 943 961 1003 1005 1037 1072 Princeps 0 0 0 0 0 0 1 21 0 1 1 0 1 0 1 1 3 0 0 1 1 1 2 7 12 2 2 42 8 9 1 1 10 32 17 1 53 6 2 3 4 12 ### ### ### ### ### ### ### ### ### ### ### ### ### ### ### ### ### ### ### ### ### 1%### ### 0% 0%### ### ### 0% 1%### ### ### 1%### ### 0%### ###1% 0% 0% 0% 0% 0% 0% 0% 0% 0% 0% 0% 0% 0% 0% 0%### 0% 0%### 0 0 1%### 1% 1% 0%### 1%### 0% 0%### ### ### 0%### ### 0 1% 0% 0% 588 603 607 616 620 162 622 646 660 677 684 689 690 691 669 697 709 713 715 716 717 721 725 726 729 730 732 734 739 742 745 748 749 750 752 755 756 758 759 762 766 768 Princeps 0 0 0 0 0 0 0 3 0 0 2 0 0 0 37 0 0 0 1 4 0 0 1 0 0 0 47 0 0 0 0 0 0 40 0 5 0 0 0 0 0 0 0 1 0 ### ### ### ### ### ### ### ### ### ### ### ### ### ### ### ### ### ### ### ### ### ### ### ### ### ### ### ### ### ### ### ### ### ### ### ### ### ### ### ### ### ### ### ### ### ### ### ### ### ### ### ### ### ### ### ### ### ### ### ### ### ### ### ### ### ### ### ### ### ### ### ### ### ### ### ### ### ### ### ### ### ### ### ### 76 9 77 2 77 3 77 5 78 4 79 0 79 7 79 9 80 1 80 2 80 4 80 6 81 6 81 9 82 1 82 2 82 3 82 5 82 9 83 2 83 3 83 4 83 6 83 7 84 3 84 8 85 4 85 6 85 8 86 1 86 3 86 5 86 9 87 1 87 3 87 5 88 1 88 3 88 4 88 8 89 0 89 2 Princeps 0 0 0 0 0 0 0 25 0 0 0 0 0 0 0 0 4 0 0 0 4 3 0 0 0 0 0 0 0 0 0 0 50 1 0 0 1 0 14 19 0 5 0 15 0 0 ### ### ### ### ### ### ### ### ### ### ### ### ### ### ### ### ### ### ### ### ### ### ### ### ### ### ### ### ### ### ### ### ### ### ### ### ### ### ### ### ### ### ### ### ### ### ### ### ### ### ### ### ### ### ### ### ### ### ### ### ### ### ### ### ### ### ### ### ### ### ### ### ### ### ### ### ### ### ### ### ### ### ### ### 89 3 89 5 89 8 89 9 90 4 90 5 910 912 921 926 992 937 938 940 942 944 951 952 953 495 956 957 958 963 965 966 968 969 397 974 975 977 981 987 988 998 999 1002 1004 1006 1013 1014 Princeps 0 4 1 0 9 0 0 3 0 31 0 0 0 0 0 1 0 0 0 0 0 0 0 0 33 0 1 0 0 40 0 0 0 0 0 3 1 0 0 29 0 0 0 ### ### ### ### ### ### ### ### ### ### ### ### ### ### ### ### ### ### ### ### ### ### ### ### ### ### ### ### ### ### ### ### ### ### ### ### ### ### ### ### ### ### ### ### ### ### ### ### ### ### ### ### ### ### ### ### ### ### ### ### ### ### ### ### ### ### ### ### ### ### ### ### ### ### ### ### ### ### ### ### ### ### ### ### 1022 1024 1025 1030 1032 1033 1034 1036 3910 1040 1043 1050 1052 1056 1061 1064 Princeps AF 0.5-1% AF 0.5-1% AF 0.5-1% Wild-type 0 0 0 0 0 0 5 0 1 0 0 0 0 0 0 0 ### ### ### ### ### ### ### ### ### ### ### ### ### ### ### ### ### ### ### ### ### ### ### ### ### ### ### ### ### ### ### ### Sample ID Princeps p.T790M p.T790M Sample ID Princeps p.T790M p.T790M Sample ID Princeps p.T790M p.T790M Sample ID Princeps p.T790M p.T790M Sample ID
L858R AF >1% Del 19 AF >1% T790M AF >1% EGFR Missing
Princeps AF 0.1-0.5% AF 0.1-0.5% AF 0.1-0.5% Other sensitizing Mt
p.T790M Technic failure
p.T790M
Sample origin Lyon Univ. Hosp. Final interpretation p.T790M positive in BEAMing only External p.T790M positive with both assays p.T790M negative with both assays
Sample origin FFPE(at diag.)
OncoBEAM-EGFR
Sample origin FFPE(at diag.)
OncoBEAM-EGFR
Sample origin FFPE(at diag.)
OncoBEAM-EGFR
Sample origin FFPE(at diag.)
OncoBEAM-EGFR
Sample origin FFPE(at diag.)
OncoBEAM-EGFR NGS-56 NGS-56G NGS-56G NGS-56G NGS-56G
FIGURE 2 Correlation of p.T790M allelic frequency between the OncoBEAM™‐epidermal growth factor receptor (EGFR) assay and the NGS‐56G assay. The correlation is good with an R2 at 0.94. The
dotted lines represent the threshold of positivity: 0.5% for NGS assay (horizontal) and 0.02% for OncoBEAM™‐EGFR assay (vertical). 20 concordant cases and 21 discordant cases were observed
0.0001 0.0010 0.0100 0.1 1 10 100 0.0001 0.0010 0.0100 0.1000 1 10 100 p.T790M Allelic Fraction % (OncoBEAM-EGFR) p. T7 90 M All el ic F ra ct io n % (N G S-56G ) n = 183 R² = 0.94 n = 21 n = 20
through MET or HER2 amplifications), epithelial‐mesenchy-mal transition, transdifferenciation to sepithelial‐mesenchy-mall cell lung cancer, as well as other unknown mechanisms.26,27,38 TP53 somatic
alterations in NSCLC patients have been shown to be asso-ciated with poor outcomes.39 Canale et al found a similar
proportion of TP53 mutant cases and showed that TP53 mu-tations in exon 8 were also associated with poor outcomes.40
3.3
|
Application of the
OncoBEAM™‐EGFR assay in CTCs
During the course of the present study, we set up a new microfluidic CTC platform from Biolidics, which isolates CTCs according to size and physical properties. First, we assessed the recovery rate of spiked PC‐3 tumoral cells (di-ameter greater than 15 µM) into 7.5 ml of total blood using this device. This rate ranges from 61% to 90% for cell input varying from 50 to 200 cells (Figure S2). Next, to evaluate the performance of NGS‐56G and OncoBEAM™‐EGFR assays, we used established cell lines as negative and posi-tive controls (HCC827 and NCI‐H1975, respecposi-tively) alone and spiked into healthy total blood. The mCTCs spiked into whole blood were enriched using the ClearCell FX platform prior to mutation detection. The presence of EGFR p.T790M in the NCI‐H1975 positive cell line was confirmed using the NGS‐56G assay with a MAF around 65%. By contrast, the p.T790M mutation signal within the samples containing the NCI‐HCC827 negative control cell line were below the limit of detection (Figure 3). To evaluate the background quantity of false‐positive EGFR p.T790M mutation, total blood sam-ples were analyzed (condition “0 cell”) (Figure 3) and the MAF of the results detected had average values of approxi-mately 0.03%; this is well below the threshold of p.T790M mutation positivity of the NGS assay. Both NGS‐56G and OncoBEAM™‐EGFR were capable of detecting p.T790M in as few as five cells without spiking into total blood. These first experiments were performed in order to validate the en-tire worflow including counting, extraction, and analysis con-ditions. Subsequent experiments showed that the p.T790M mutation could be detected by NGS‐56G at a low level (ie, in 50 cells with the p.T790M mutation in 7.5 mL of total blood) (Figure 3A), and the BEAMing assay was capable of detect-ing the p.T790M mutation in preparations containdetect-ing as low as 10 cells/7.5 mL (Figure 3B). In preparations containing 5 cells/7.5 mL, the EGFR p.T790M mutation was not detected.
CTCs are released into the bloodstream from the primary tumor or metastatic sites.41 A CTC population is
representa-tive of the heterogeneity and the plasticity of tumoral cells of all tumoral sites into the body. These cells may undergo an epithelial to mesenchymal transition (EMT)42 or acquire stem
cell features to sequester themselves from their initial site of origin or to migrate into secondary metastatic sites through lymph and/or whole blood systems. Currently, CTC analyses
are mainly performed to gain insights of tumor progression by transcrptional and/or epigenetic mechanisms. Since CTCs are viable and present a full representation of an individual tumor cell's molecular profile (including proteins expressed, RNA and DNA), they are promising noninvasive biomark-ers.43 Currently, assays involving CTC counts are
FDA‐ap-proved (Food and Drug Administration) for breast cancers as a prognostic indicator using the CellSearch assay. Indeed, breast cancer patients having five or more CTCs per 7.5 mL of total blood have a shorter OS (overall survival) and PFS (progression‐free survival) than patients having fewer than five CTCs.44 A major technical challenge remains to isolate
between 1 and 100 CTCs among normal white blood cells in a typical clinical blood sample. Nevertheless, significant progress has been made during the last ten years, and many new technologies have been developed and demonstrate fea-sibility when applied to both isolation and purification of these CTCs in a clinical setting.
Our results from the present study provide technical fea-sibility that the EGFR p.T790M mutation can be detected in CTCs using both the OncoBEAM™‐EGFR or NGS‐56G assay technologies. Soon et al have also shown that the num-ber of CTCs might differ considerably depending on the disease stage; for instance, they found a mean number of 1.48 ± 1.71 CTCs in stage I‐III patients (in 5 mL of total blood) and a mean of 8 ± 9.95 CTCs in stage IV‐V patients using the CellSearch platform.45 Given the considerable body
of existing knowledge clearly indicating that the numbers of CTCs capable of being isolated from a clinical blood sam-ple is likely to be a significant limitation to bringing CTCs into routine use in clinical diagnostics, our findings justify the use of highly sensitive assays such as BEAMing to detect mutations in combinatorial analyses with CTCs (p.T790M assay; 10 tumor cells per 7.5 mL of total blood required to detect EGFR p.T790M following enrichment with ClearCell FX) (Figure 3B). In addition, Illie et al have shown that some “sentinel” cells may be detected in blood before detection of a lung cancer at CT‐scan, again emphasizing the need for sen-sitive assays 46 such as ClearCell FX. The results presented
herein provide a strong methodological foundation to begin a prospective validation using patient samples.
4
|
CONCLUSIONS AND
PERSPECTIVES
The EGFR p.T790M mutation is the most frequent mecha-nism of resistance from treatment of EGFR‐positive NSCLC with first‐ and second‐generation TKIs. Currently, the most adopted noninvasive technique for detecting this resistance mutation at progression is cfDNA testing. In this study, we have demonstrated that the amount of DNA input is tightly associated with the accuracy and sensitivity of mutation
detection with the minimal amounts of 2 ng and 15 ng that are required to detect the EGFR p.T790M at the level of 1% and 0.1% MAF, respectively. Since mutated copies are
sometimes present at very low abundance within cfDNA, the DNA input amounts required to obtain accurate result are a major concern, and are highly assay‐dependent. Thus, high
FIGURE 3 Histogram of allelic frequency of p.T790M detected using the NGS‐56G assay (A) and using the OncoBEAM™‐epidermal growth factor receptor (EGFR) assay (B). A defined number of cells, between 0 and 200, was either directly analyzed using NGS or BEAMing (pink bars), or first spiked into total blood, enriched using ClearCell FX, and analyzed using NGS or BEAMing (purple bars). Two negative samples were analyzed: one was total blood sample without spiked cells (condition “0 cells”) and one was the HCC827 negative cell line for p.T790M. The H1975 cell line was used as a positive control and for the spiking experiments. The dotted line corresponds to positivity threshold: 0.5% for the NGS 56G assay and 0.02% for the OncoBEAM™‐EGFR p.T790M assay
0 cells 10 cells
(1.3 cells/mL) (6.7 cells/mL)50 cells (13.3 cells/mL)100 cells (p.T790M -)HCC827 (p.T790M +)H1915
0.01 0.10 1 10 100
Allelic frequency of mutated
copies of p.T790
M
Cell Only Cell + Total blood enriched with ClearCell Fx Cell Pellet NGS-56G n = 2 n = 2 n = 2 n = 2 n = 3 n = 2 n = 3 n = 2 n = 2 0 cell 5 cells
(0.7 cells/mL) (1.3 cells/mL)10 cells (3.3 cells/mL)25 cells (6.7 cells/mL)50 cells (p.T790M -)HCC827
0.001 0.010 0.100 1 10 100
Allelic frequency of mutated
copies of p.T790M
Cell Only Cell + Total blood enriched with ClearCell Fx
OncoBEAM-EGFR n = 2 n = 1 n =2 n =3 n = 3 n = 1 n = 1 n =3 n = 2 Cell Pellet A B
analytical sensitivity of any assay used to detect mutations at low levels of abundance in plasma samples is of paramount importance. The data from our study indicate that both the
OncoBEAM™‐EGFR p.T790M and the NGS‐56G assays show high accuracy and mutation detection results with very good correlation (R2 = 0.94). However, despite this high FIGURE 4 A, Monitoring of the epidermal growth factor receptor p.T790M and DelEx19 under Gefinitib treatment and Tagrisso treatment. The allelic frequency of each mutation is represented in blue for p.T790M and in red for DelEx19 for each time point available. B, Chest CT‐scan was performed at each time point. The size of primary tumor is annotated on the scan. C, Care strategy of the follow‐up of non‐small cell lung cancer patients. At diagnosis, a tissue sample was analyzed by the pathology service to define the lung cancer histology and research oncogenic drivers to personalize treatment. For each state of progression, a sampling of total blood is performed to access the cell‐free DNA, as well as to ascertain the probable mechanism of tyrosine kinase inhibitor resistance and to inform modification of treatment
0% 10% 20% 30% 40% 50% 60% 70% 8/1/17 9/1/17 10/1/17 11/1/17 12/1/17 1/1/18 % allelic fr a on
Pa ent #5
NGS-56G p.L858R OncoBEAM-EGFRp.T790M NGS 56G p.T790M NGS-56Gp.Glu286l175Lys (TP53) 0.0001 0.001 0.01 0.1 1 10 7/1/17 8/1/17 9/1/17 10/1/17 11/1/17 12/1/17 1/1/18 2/1/18 3/1/18 4/1/18 5/1/18 6/1/18 7/1/18 8/1/18 OncoBEAM-EGFR p.T790M NGS-56Gp.T790M NGS-56GDelEx19 B i B ii B iii T1 T2 T3 T4 T1 T2 T3 T4 Ge fi ni b Osimer ni bErlo nib Erlo nib
0% 1% 1% 2% 2% 3% 1/1/18 2/1/18 3/1/18 % allelic fr a on
Pa ent #3
NGS-56G DelEX19 OncoBEAM-EGFRp.T790M NGS-56G p.T790M B iiii A Ccorrelation, the NGS‐56G assay failed to detect the EGFR p.T790M in 18/37 patients harboring the EGFR p.T790M at low MAF level. Nevertheless, the NGS‐56G technology offered a better coverage of EGFR gene mutations, where it was shown to readily detect the principal EGFR sensitiz-ing mutations, as well as mutations in genes such as TP53, which have been shown to have prognostic value or in-volved in alternative resistance mechanisms. However, the OncoBEAM™‐EGFR p.T790M assay allowed us to detect the resistance mutation in 21 patients with a negative result in NGS‐56G, at lower MAF than the NGS assay could detect; this result underscores the fact that the OncoBEAM™‐EGFR assay has a significantly higher sensitivity for mutation detection. Tissue biopsies have demonstrated significant drawbacks (ie, patient discomfort, increased morbidity via invasive biopsy procedures, noninformative samples) for monitoring of disease and detection of targetable molecu-lar alterations at relapse, however, a cfDNA approach can overcome these obstacles and deliver clinically actionable results. Analysis of cfDNA can be useful for noninvasive monitoring and early detection of resistance mutations such as p.T790M to assist the patient and clinician and better in-form clinical decisions. To provide a more comprehensive example of the utility of using cfDNA analysis in the clinic, we fully followed the molecular and clinical evolution of a lung cancer patient during therapy using mutational analysis (Figure 4A,B). The BEAMing assay enabled us to detect a low frequency of EGFR p.T790M mutation that arose dur-ing therapy earlier than documented progression revealed either by symptoms or radiography. Osimertinib (third‐gen-eration TKI) was administered as second line TKI treatment at time of radiological progression and plasma T790M de-tection. On the CT‐scan of December 2017, an objective decrease of the tumor (2.21 cm × 1.19 cm) was observed. The patient was still experiencing disease stabilization as of June 2018. This case report reinforces the fact that the early detection of EGFR p.T790M may be clinically informative and enable physicians to optimize follow‐up and timely management of NSCLC patients. Additional cases examples are reported in Figure 4C. Here, we did not assess the clini-cal outcomes following detection of low p.T790M MAF by OncoBEAM™‐EGFR assay. As a result of these initial find-ings, our aim is to set‐up a dedicated cohort to authorize clinical data collection to assess this critical point. Finally, to complete these initial proof‐of‐clinical concept investiga-tions, we conducted a preliminary study to detect p.T790M in mimicking CTCs, thereby defining a threshold of muta-tion detecmuta-tion positivity for both the OncoBEAM™‐EGFR and NGS assay technologies to be applied to CTCs. The threshold of positivity of the OncoBEAM™‐EGFR p.T790M assay was five lower than NGS‐56G assay: 10 tu-moral cells spiked into total blood harboring p.T790M were detected with OncoBEAM™‐EGFR following enrichment
with ClearCell FX, while 50 cells were necessary with the 56G‐NGS assay. The fulfillment of this application has now enabled us to engage in further investigations into the tim-ing of emergence of resistance mutations in both CTCs and cfDNA to get a complete and complementary overview of both cellular and cell‐free molecular profiles at any time in the staging and treatment plan of cancer patients with high efficiency.
ACKNOWLEDGMENTS
The authors would like to thank Astra‐Zeneca, Sysmex Inostics and Biolidics companies for their support and the expert proofreading.
CONFLICT OF INTEREST
None declared.
ORCID
Léa Payen https://orcid.org/0000-0002-1599-5886
REFERENCES
1. Luo SY, Lam DC. Oncogenic driver mutations in lung cancer. Translational Respiratory Medicine. 2013;1:6.
2. Bartholomew C, Eastlake L, Dunn P, Yiannakis D. EGFR targeted therapy in lung cancer; an evolving story. Respiratory Medicine Case Reports. 2017;20:137‐140.
3. Brock G, Castellanos‐Rizaldos E, Hu L, Coticchia C, Skog J. Liquid biopsy for cancer screening, patient stratification and mon-itoring. Translational Cancer Research. 2015;4:280‐290. 4. Gerlinger M, Rowan AJ, Horswell S, et al. Intratumor
heterogene-ity and branched evolution revealed by multiregion sequencing. N Engl J Med. 2012;366:883‐892.
5. Chan K, Jiang P, Zheng Y, et al. Cancer genome scanning in plasma: detection of tumor‐associated copy number aberrations, single‐nucleotide variants, and tumoral heterogeneity by massively parallel sequencing. Clin Chem. 2013;59:211‐224.
6. Lim C, Tsao MS, Le LW, et al. Biomarker testing and time to treat-ment decision in patients with advanced nonsmall‐cell lung cancer. Ann Oncol. 2015;26:1415‐1421.
7. Overman MJ, Modak J, Kopetz S, et al. Use of research biopsies in clinical trials: are risks and benefits adequately discussed? J Clin Oncol. 2013;31:17‐22.
8. Schwaederle M, Parker BA, Schwab RB, et al. Molecular tumor board: the University of California‐San Diego Moores Cancer Center experience. Oncologist. 2014;19:631‐636.
9. Diehl F, Li M, Dressman D, et al. Detection and quantification of mutations in the plasma of patients with colorectal tumors. Proc Natl Acad Sci USA. 2005;102:16368‐16373.
10. Garcia J, Dusserre E, Cheynet V, et al. Evaluation of pre‐ana-lytical conditions and comparison of the performance of several digital PCR assays for the detection of major EGFR mutations in
circulating DNA from non‐small cell lung cancers: the CIRCAN_0 study. Oncotarget. 2017;8:87980‐87996.
11. Garcia J, Forestier J, Dusserre E, et al. Cross‐platform compari-son for the detection of RAS mutations in cfDNA (ddPCR Biorad detection assay, BEAMing assay, and NGS strategy). Oncotarget. 2018;9:21122‐21131.
12. FDA. cobas EGFR Mutation Test v2. https ://wwwfd agov/drugs/ infor matio nondr ugs/appro veddr ugs/ucm50 4540h tm2016.
13. Neoptolemos JP, Moore MJ, Cox TF, et al. Effect of adjuvant chemotherapy with fluorouracil plus folinic acid or gemcitabine vs observation on survival in patients with resected periampullary adenocarcinoma: the ESPAC‐3 periampullary cancer randomized trial. JAMA. 2012;308:147‐156.
14. Tseng JS, Yang TY, Tsai CR, et al. Dynamic plasma EGFR mu-tation status as a predictor of EGFR‐TKI efficacy in patients with EGFR‐mutant lung adenocarcinoma. J Thorac Oncol. 2015;10: 603‐610.
15. Bettegowda C, Sausen M, Leary RJ, et al. Detection of circulat-ing tumor DNA in early‐ and late‐stage human malignancies. Sci Transl Med. 2014;6:224ra24.
16. Tie J, Kinde I, Wang Y, et al. Circulating tumor DNA as an early marker of therapeutic response in patients with metastatic colorec-tal cancer. Ann Oncol. 2015;26:1715‐1722.
17. Couraud S, Vaca‐Paniagua F, Villar S, et al. Noninvasive di-agnosis of actionable mutations by deep sequencing of cir-culating free DNA in lung cancer from never‐smokers: a proof‐of‐concept study from BioCAST/IFCT‐1002. Clin Cancer Res. 2014;20:4613‐4624.
18. Oxnard GR, Thress KS, Alden RS, et al. Association between plasma genotyping and outcomes of treatment with osimertinib (AZD9291) in advanced non–small‐cell lung cancer. J Clin Oncol. 2016;34:3375‐3382.
19. Karlovich C, Goldman JW, Sun J‐M, et al. Assessment of EGFR mutation status in matched plasma and tumor tissue of NSCLC pa-tients from a Phase I Study of Rociletinib (CO‐1686). Clin Cancer Res. 2016;22:2386‐2395.
20. Lemoine A, Couraud S, Fina F, et al. Recommandations du GFCO pour l’utilisation diagnostique des analyses génétiques somatiques sur l’ADN tumoral circulant. Innov Ther Oncol. 2016;2:225‐232. 21. Gazdar AF. Activating and resistance mutations of EGFR in non‐
small‐cell lung cancer: role in clinical response to EGFR tyrosine kinase inhibitors. Oncogene. 2009;28:S24.
22. Hou HW, Warkiani ME, Khoo BL, et al. Isolation and retrieval of circulating tumor cells using centrifugal forces. Sci Rep. 2013;3:1259.
23. Park S, Ang RR, Duffy SP, et al. Morphological differences be-tween circulating tumor cells from prostate cancer patients and cultured prostate cancer cells. PLoS ONE. 2014;9:e85264. 24. Sajay BN, Chang CP, Ahmad H, et al. Microfluidic platform
for negative enrichment of circulating tumor cells. Biomed Microdevice. 2014;16:537‐548.
25. Hosokawa M, Kenmotsu H, Koh Y, et al. Size‐based isolation of circulating tumor cells in lung cancer patients using a microcavity array system. PLoS ONE. 2013;8:e67466.
26. Zhong WZ, Zhou Q, Wu YL. The resistance mechanisms and treat-ment strategies for EGFR‐mutant advanced non‐small‐cell lung cancer. Oncotarget. 2017;8:71358‐71370.
27. Rotow J, Bivona TG. Understanding and targeting resistance mech-anisms in NSCLC. Nat Rev Cancer. 2017;17:637‐658.
28. Chen LY, Molina‐Vila MA, Ruan SY, et al. Coexistence of EGFR T790M mutation and common activating mutations in pretreatment non‐small cell lung cancer: A systematic review and meta‐analysis. Lung Cancer. 2016;94:46‐53.
29. Kosaka T, Yatabe Y, Endoh H, et al. Analysis of epidermal growth factor receptor gene mutation in patients with non‐small cell lung cancer and acquired resistance to gefitinib. Clin Cancer Res. 2006;12:5764‐5769.
30. Kuang Y, Rogers A, Yeap BY, et al. Noninvasive detection of EGFR T790M in gefitinib or erlotinib resistant non‐small cell lung cancer. Clin Cancer Res. 2009;15:2630‐2636.
31. Kobayashi S, Boggon TJ, Dayaram T, et al. EGFR mutation and resistance of non–small‐cell lung cancer to gefitinib. N Engl J Med. 2005;352:786‐792.
32. Hata AN, Niederst MJ, Archibald HL, et al. Tumor cells can follow distinct evolutionary paths to become resistant to epidermal growth factor receptor inhibition. Nat Med. 2016;22:262.
33. Yu HA, Arcila ME, Harlan Fleischut M, et al. Germline EGFR T790M mutation found in multiple members of a familial cohort. J Thorac Oncol. 2014;9:554‐558.
34. Chang WJ, Kim YH. De novo EGFR T790M, KRAS and PIK3CA somatic mutations in cell free DNA in non‐small cell lung cancer patients and clinical characteristics. J Clin Oncol. 2017;35:e20561.
35. Saxena A, Nagasaka M, Li Z, Becker DJ, Levy BP. Double trouble: a case of concurrent de novo T790M and L858R EGFR mutations in treatment‐naive advanced non‐small‐cell lung cancer. Oncology (Williston Park, NY). 2014;28:526, 528, 530, 534.
36. Zou B, Lee V, Chen L, Ma L, Wang DD, Yan H. Deciphering mechanisms of acquired T790M mutation after EGFR inhibitors for NSCLC by computational simulations. Sci Rep. 2017;7:6595. 37. Matsuo N, Azuma K, Sakai K, et al. Association of EGFR Exon
19 deletion and EGFR‐TKI treatment duration with frequency of T790M mutation in EGFR‐mutant lung cancer patients. Sci Rep. 2016;6:36458.
38. Cortot AB, Janne PA. Molecular mechanisms of resistance in epidermal growth factor receptor‐mutant lung adenocarcinomas. European Respiratory Review. 2014;23:356‐366.
39. Labbé C, Cabanero M, Korpanty GJ, et al. Prognostic and predic-tive effects of TP53 co‐mutation in patients with EGFR‐mutated non‐small cell lung cancer (NSCLC). Lung Cancer. 2017;111: 23‐29.
40. Canale M, Petracci E, Delmonte A, et al. Impact of TP53 mutations on outcome in EGFR‐mutated patients treated with first‐line tyro-sine kinase inhibitors. Clin Cancer Res. 2017;23:2195‐2202. 41. Pantel K, Speicher MR. The biology of circulating tumor cells.
Oncogene. 2016;35:1216‐1224.
42. Zhu Z, Qiu S, Shao K, Hou Y. Progress and challenges of se-quencing and analyzing circulating tumor cells. Cell Biol Toxicol. 2017;34(5):405‐415.
43. Yap TA, Lorente D, Omlin A, Olmos D, de Bono JS. Circulating tumor cells: a multifunctional biomarker. Clin Cancer Res. 2014;20:2553‐2568.
44. Cristofanilli M, Budd GT, Ellis MJ, et al. Circulating tumor cells, disease progression, and survival in metastatic breast cancer. N Engl J Med. 2004;351:781‐791.
45. Sonn CH, Cho JH, Kim JW, Kang MS, Lee J, Kim J. Detection of circulating tumor cells in patients with non‐small cell lung cancer using a size‐based platform. Oncol Lett. 2017;13:2717‐2722.
46. Ilie M, Hofman V, Long‐Mira E, et al. "Sentinel" circulating tumor cells allow early diagnosis of lung cancer in patients with chronic obstructive pulmonary disease. PLoS ONE. 2014;9: e111597.
SUPPORTING INFORMATION
Additional supporting information may be found online in the Supporting Information section at the end of the article.
How to cite this article: Garcia J, Wozny A‐S, Geiguer
F, et al. Profiling of circulating tumor DNA in plasma of non‐small cell lung cancer patients, monitoring of epidermal growth factor receptor p.T790M mutated allelic fraction using beads, emulsion, amplification, and magnetics companion assay and evaluation in future application in mimicking circulating tumor cells. Cancer Med. 2019;8:3685–3697. https ://doi.org/10.1002/cam4.2244