HAL Id: hal-03081038
https://hal.archives-ouvertes.fr/hal-03081038
Submitted on 18 Dec 2020
HAL is a multi-disciplinary open access
archive for the deposit and dissemination of sci-entific research documents, whether they are pub-lished or not. The documents may come from teaching and research institutions in France or abroad, or from public or private research centers.
L’archive ouverte pluridisciplinaire HAL, est destinée au dépôt et à la diffusion de documents scientifiques de niveau recherche, publiés ou non, émanant des établissements d’enseignement et de recherche français ou étrangers, des laboratoires publics ou privés.
Dismantling nuclear waste rich in P2O5, MoO3 and
ZrO2: How do these oxides incorporate in
aluminoborosilicate glasses?
Sophie Achigar, D. Caurant, Elise Régnier, Odile Majérus
To cite this version:
Sophie Achigar, D. Caurant, Elise Régnier, Odile Majérus. Dismantling nuclear waste rich in P2O5, MoO3 and ZrO2: How do these oxides incorporate in aluminoborosilicate glasses?. Journal of Nuclear Materials, Elsevier, 2021, 544, pp.152731. �10.1016/j.jnucmat.2020.152731�. �hal-03081038�
1
Journal of Nuclear Materials 544 (2021) 152731
Dismantling nuclear waste rich in P2O5, MoO3 and ZrO2:
How do these oxides incorporate in aluminoborosilicate glasses?
Sophie Achigar 1,2, Daniel Caurant 2,*, Elise Régnier 1, Odile Majérus 2
1 CEA, DES, ISEC, DE2D, University of Montpellier, Marcoule, France
2 Chimie ParisTech, PSL Research University, CNRS, Institut de Recherche de Chimie Paris
(IRCP), UMR 8247, 11 rue Pierre et Marie Curie, 75005 Paris, France
* Corresponding author: DanielCaurant: daniel.caurant@chimieparistech.psl.eu
Abstract
Dismantling nuclear facilities leads to radioactive waste less active but which may have highly
variable compositions compared to the high-level radioactive wastes recovered after the
reprocessing of spent nuclear fuel. In this work, we studied the ability of an alkali-rich glass
matrix belonging to the SiO2-B2O3-Al2O3-Fe2O3-Na2O-Li2O-CaO system to solubilize P2O5,
MoO3, ZrO2 and Cs2O by melting at 1100°C. Phosphorus, molybdenum, zirconium and cesium
are present as a mixture of complex compounds in the real radioactive dismantling waste
containing 137Cs considered here. To determine the capacity of the matrix to accept a wide range
of variations of waste composition and the solubility limits of P2O5, MoO3, and ZrO2,several
glass series were prepared by melting mixtures of raw materials (oxides, carbonates,
phosphates) and by increasing the total amount of oxides representing the waste and varying
their relative proportions. Their incorporation in the melt was studied by analyzing the
2
and crystallization tendencies during cooling were studied by analyzing the microstructure of
glasses cooled at 1°C.min-1 from 1100°C (representative of cooling in industrials steel
canisters). It is shown that the glass can accept a wide range of waste compositions without
exhibiting heterogeneities. For all compositions the melt remained homogeneous (study of
quenched samples). However, during slow cooling, P2O5 and MoO3 may lead to phase
separation and crystallization of Na2MoO4, CsLiMoO4, NaCaPO4, NaLi2PO4, and Li3PO4. Cs
can be partially incorporated into the molybdenum-rich phase CsLiMoO4 when MoO3 content
is higher than 1.3wt%. ZrO2 never lead to phase separation or crystallization, possibly because
of the existence of strong connections between Zr and Si through Zr-O-Si bonds whereas P and
Mo would be present as PO43- and MoO42- mobile entities. The increasing order of oxides
solubility in the glass is the following: MoO3<P2O5<ZrO2.
Keywords: Nuclear dismantling; waste vitrification; aluminoborosilicate glass; cesium; MoO3,
P2O5, and ZrO2 incorporation
Highlights
Incorporation in a glass of a dismantling waste rich in Zr, P and Mo
Impact of waste composition variation and waste loading on glass microstructure P and Mo are the only elements that may lead to phase separation or crystallization For Mo-rich compositions Cs may enter into molybdate crystals (CsLiMoO4)
3
1. Introduction
During the reprocessing of a highly radioactive spent fuel in a nuclear facility, significant
fouling of the plant circuits and components occurs. Thus, active deposits remain in the
equipment of shut down facilities. When dismantling the reprocessing facilities, these fouling
wastes have to be managed [1], for which vitrification is considered. The requirements for the
containment glass matrix to vitrify these wastes are different from those used for high-level
radioactive wastes (HLW) generated by fuel reprocessing. Nevertheless, as for HLW
vitrification, it is considered that dismantling waste would be added to a glass frit and melted
at about 1100°C in a metallic crucible. However, in the case of dismantling waste, the metallic
crucible would play the role of canister after melt cooling [1]. As will be pointed out later on in
this paper, the challenge here lies in the ability of the glass matrix to accommodate a variable
waste stream, as these dismantling wastes generally have much more variable compositions
than HLW. For this, an alkali-rich aluminoborosilicate glass matrix was selected. The aim of
this work is to study the microstructure (phase separation and crystallization) of several glass
series prepared by varying the total and relative amounts of the oxides simulating the
dismantling waste (in order to take into account the wide composition range of the waste
stream), and to follow the location of the radionuclides in the different phases that may be
present.
In this study, we focused on the waste coming from the dismantling operation on the nuclear
site of Marcoule in France. These wastes represent deposits that are found in old tanks from the
shutdown reprocessing facility named UP1 and were already presented in [1]. The main
elements of these deposits are Zr, Si, P, Mo, Fe, Na and Al, and the deposit activity is essentially
due to the radioactive 137Cs (Cs2O representing about 1 wt% of the waste). In the real waste, P,
Zr, Mo and Cs are thought to be in the following forms: phosphorus as phosphates, zirconium
4
and cesium as Cs compounds with both P and Mo, of the type CsxPMoyOz. However, in this
study, the elements present in the waste were considered only as oxide forms and added to the
batch as commercial raw materials (mainly oxides and carbonates). The glass selected to
incorporate the dismantling waste, and that will be mixed as glass frit with this waste in the
industrial process, was rich in alkali oxides (33.1 mol% Na2O + Li2O) both to facilitate waste
incorporation (formation of a high proportion of non-bridging oxygen atoms) and to limit the
melting temperature, and thereby to limit the risks of cesium volatilization. Compared to the
HLW coming from the nuclear fuel reprocessing, this type of waste is featured by a wide range
of composition [1]. As a simplified majoring approach, the variation of each oxide can be
considered between 0 and 50 wt% of the waste composition (expressed as oxides, Table 1). In
addition, this waste composition involves elements presenting a high field strength. The field
strength F of a cation in an oxide material is defined as F = Z/d2, with Z the cation charge and
d the mean cation-oxygen distance in Å. Thus, cations with a high field strength tend to exert a
strong ordering effect on the surrounding oxygen ions and may separate easily from the glassy
network. This is the case of Mo6+, P5+ and Zr4+ cations (F(Mo6+)= 1.89-1.94 Å-2, F(P5+) =
2.00-2.11 Å-2, F(Zr4+)= 0.92-0.93 Å-2 [2]), which are likely to lead to crystallization or phase
separation.
Molybdenum is a well-known element in the nuclear industry and is one of the fission products
that are very difficult to incorporate in borosilicate glasses [2]. In these glasses, molybdenum
forms MoO42- entities, which are located in alkali and alkaline earth-rich depolymerized regions
outside the silicate or borosilicate network [2–4]. The solubility limit of MoO3 is relatively low
in borosilicate matrices, i.e., 1 - 3 mol% [5–8]. Above this limit, phase separation or
crystallization of Na2MoO4 or CaMoO4 may occur during the cooling of the material[6,7,9].
5
Moreover, even if Mo isotopes are stable [11], molybdate phases can incorporate radioactive
elements, such as 137Cs [7,12,13].
Phosphorus is a non-radioactive element that comes here from the solvent degradation during
the Purex process used to extract U and Pu from the spent fuel. The incorporation of phosphorus
in nuclear borosilicate glasses has not been widely studied because its content is generally,
relatively low in glasses containing HLW (typically < 0.2 mol% of P2O5 exists in the French
R7T7 glass). Nevertheless, many studies have been carried out on phosphorus incorporation in
soda-lime phosphosilicate bioglasses ([P2O5] < 6 mol%) used for biomedical applications [14–
18]. According to these studies, phosphorus speciation in a silicate network strongly depends
on the glass composition. In glasses with high alkali or alkaline earth contents, such as
bioglasses, in which alkali and alkaline earth oxides content can be as high as 50 mol%, most
of the phosphorus forms isolated orthophosphate PO43- units [15,17–19]; for example, they
represent 96% of P in 45S5® bioglass [19]. In silicate glasses with higher amounts of
phosphorus oxide, or lower content of alkali and alkaline earth oxides, a larger proportion of
phosphate tetrahedra would be bonded to other phosphate units or to the glassy network [20–
23]. In soda-lime silicate glasses, the nature of phosphate bonds is still debated; some authors
argue that these bonds are P-O-P bonds, [20,21,24] whereas the more recent studies on
bioglasses indicate that they could be P-O-Si bonds [5-7,9]. With regard to the connections of
phosphate units with other network forming units, such as AlO4, BO3 and BO4, several studies
have demonstrated the presence of P-O-Al and P-O-B bonds in aluminosilicate [21,24,25] and
borosilicate systems [26], respectively. According to these different studies, the more numerous
the bonds between P and the glassy network are, the higher its solubility would be. Above this
limit, the crystallization of alkali or alkaline earth phosphate may occur. In soda silicate glasses,
Na3PO4 [23,25] and Na4P2O7 [23] may crystallize, whereas in soda-lime silicate glasses,
6
Zirconium is also a well-known element of nuclear glasses. It is a fission product, although it
may also come from either the glass frit added to the waste or the zircaloy clad containing the
nuclear fuel [29]. For instance, in the French R7T7 nuclear glass, the amount of ZrO2 is
approximately 1.54 mol% or 2.75 wt% [30]. Approximately 20 % of all the Zr occurring in
waste solutions as a fission product is radioactive (93Zr), however, it is a weak -emitter with a
long half-life [31]. Moreover, ZrO2 has a very low solubility in water and Zr4+ ions have a very
low mobility in geological fields [29]. Zr has a higher solubility in silicate glasses, compared
to Mo and P, e.g., 15.8 wt% or 8.9 mol% is solubilized in a borosilicate glass of composition
15.8 ZrO2 – 8.4 Na2O – 2.1 Li2O – 17.2 B2O3 – 51.1 SiO2 – 5.8 others (in wt%) [32]. This is
probably because it is mostly incorporated as a ZrO62- octahedron linked to the silicate network
(Zr-O-Si bonds) and charge-compensated by alkali or alkaline earth cations [33–40]. Above the
solubility limit, phases, such as ZrO2 or ZrSiO4 may crystallize [32,41,42].
In this work, we studied the incorporation of the oxides representing the different elements
present in a waste originating from dismantling operations (Table 1) in an alkali-rich
aluminoborosilicate glass (Table 2). The aim of the work was to determine how the selected
glass could incorporate these oxides, taking into account the high variability of the waste
composition. Two parameters were considered to study the incorporation of the oxides in the
glass: (i) the waste loading rate (from 10 to 30 wt%) in the glassy matrix and (ii) the waste
composition, by increasing selectively the relative proportions of the different oxides present
in the waste, focusing particularly on P2O5, MoO3 and ZrO2. For this first study, the
incorporation of oxides coming from the waste was studied by mixing oxide + carbonate +
phosphate powders at the final glass composition ratio, and by melting this mixture at 1100 °C
with oxide powders coming from the frit. The incorporation of the waste into the glass frit,
taking into account the real chemical nature of the elements present in the waste and using a
7
method of glass preparation because our objective was not here to study the reactivity of the
waste (or of the waste simulant) with the glass frit during melting but to study the solubility of
the oxides representing the waste both in the melt and in the glass obtained after controlled
cooling of the melt at a rate close to natural cooling in industrial canisters (1 °C.min-1). The
solubility in the melt was studied by examining at room temperature the microstructure of the
sample obtained after melt quenching assuming that no important evolution occurs during rapid
cooling. All the quenched and slowly cooled samples thus produced were characterized using
scanning electron microscopy coupled with energy-dispersive X-ray spectroscopy (MEB-EDS)
and X-ray diffraction (XRD) to detect and identify the presence of heterogeneities (crystalline
or amorphous) and using differential thermal analysis (DTA) to determine the glass transition
temperature.
2. Experimental procedure
Preparation of samples
Table 1 shows the reference waste composition (expressed as oxides) considered for this study,
which corresponds to the mean composition from 19 measurements on the UP1 active deposits.
The composition of the glass frit that would be added to the waste is given in Table 2. From
these two input data, glass compositions were calculated.
All the glass compositions prepared in this work are given in Table 3. To study the influence of
the incorporation rate of the waste into the alkali-rich aluminoborosilicate glass, three glass
series (S10, S20 and S30), with increasing waste loading (respectively 10, 20, and 30 wt%),
were calculated and synthesized based on the glass frit (Table 2) and reference waste
compositions (Table 1). The waste loading was defined in this paper as the ratio between the
8
not only oxides as indicated above. This waste loading definition corresponds to the weight
contribution of the waste in the final glass, i.e. after decomposition and dissolution in the melt
of all the compounds that were present in the real waste. Then, to study the influence of the
waste composition variability among these three series, the reference composition of the waste
was modified: the relative oxide contents in the waste were modified from 0 to 50 wt%
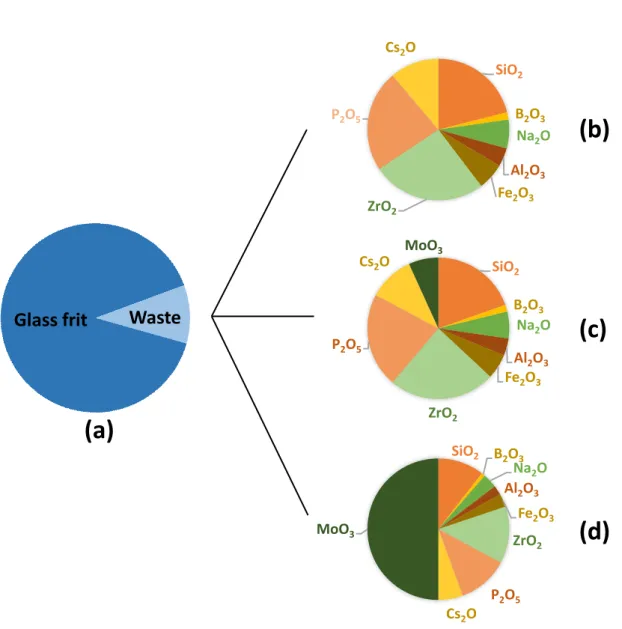
successively for each oxide MyOz. Either this oxide was removed from the composition (this
waste composition was designated as “M0”) or its content was raised to 50 wt% of the waste
(this waste composition was designated as “M50”), while the relative weight ratios of all the
other waste components were kept constant. Fig. 1 illustrates this approach in the case of MoO3.
The different samples thus prepared were referred to as Sx.My (with x = 10, 20, or 30; and y =
0 or 50). In detail, for Series S10, in addition to the reference composition R of the waste leading
to the sample S10.R, seven oxide contents were modified and 14 compositions were prepared,
which included variations of SiO2 (samples S10.Si0 and S10.Si50), Na2O (samples S10.Na0
and S10.Na50), Al2O3 (samples S10.Al0 and S10.Al50), Fe2O3 (samples S10.Fe0 and
S10.Fe50), ZrO2 (samples S10.Zr0 and S10.Zr50), P2O5 (samples S10.P0 and S10.P50), and
finally, MoO3 (samples S10.Mo0 and S10.Mo50, Fig. 1). Thus, all the waste oxides were
modified except B2O3 and Cs2O. In fact, the content of B2O3 was very low, while that of Cs2O
was deliberately increased by a factor of approximately 10 (Table 1) compared to its real
proportion in the waste, to have a significant amount of cesium (> 0.5 wt% Cs2O, Table 3) in
glasses. For Series S20, three compositions were synthesized (S20.R, S20.P50, and S20.Zr50),
to study the influence of increasing phosphorus and zirconium contents, and complete the
results of Series S10. For Series S30, only two compositions were prepared (S30.R and
S30.Zr50), to study the influence of increasing the zirconium content, and complete the results
9
characterized in depth in this study because at 1100 °C, the mixture did not melt completely
owing to the high refractory nature of ZrO2 (melting point 2715 °C).
For the three series, samples (50 g batches) were prepared using appropriate quantities of
reagent grade SiO2 (Alfa Aesar, purity 0.995), H3BO3 (Alfa Aesar, purity 0.99), Na2CO3 (Alfa
Aesar, purity 0.995), CaCO3 (VWR, purity 0.99), Li2CO3 (Laboratoire du Bois de Boulogne),
Al2O3 (Baikowski, purity 0.995), Fe2O3 (Prolabo, purity 0.99), ZrO2 (Rhône Poulenc),
NH4H2PO4 (Alfa Aesar, purity 0.98), Cs2CO3 (Alfa Aesar, purity 0.999), and MoO3 (Sigma
Aldrich, purity 0.995) powders. They were melted in air in an electrical furnace at 1100 °C for
2 h in Pt crucibles, and cast on a brass plate. The samples obtained were ground and melted
again at 1100 °C for 2 h to ensure their homogeneity. The melt was quenched again by casting
on a brass plate at a cooling rate of approximately 103 °C.min-1 or rapidly quenched between
two brass plates at a cooling rate of approximately 104 °C.min-1 to obtain 1-mm thick samples.
The latter operation of increasing the quenching rate was conducted to obtain homogeneous
samples, when heterogeneous samples were obtained after only casting. The quenched samples
were designated with the subscript “q” in this paper. Then, a fraction of the quenched samples,
approximately 2 g, was melted again at 1100 °C in Pt-Au crucibles, and slowly cooled at 1
°C.min-1 from 1100 °C to room temperature to simulate the typical natural cooling rate in the
bulk of industrial nuclear glass canisters. These slowly cooled glass samples were designated
by a subscript “sc” in this paper. All the quenched and slowly cooled samples were transparent
with a brown color, owing to the presence of Fe2O3 and macroscopically homogeneous, except
for three slowly cooled samples (S10.Mo50sc, S20.P50sc, and S30.Rsc). The sample S10.Mo50sc,
with the highest MoO3 content (5 wt%) was brown and opaque with macroscopic white phases
on its surface and samples S20.P50sc and S30.Rsc with respectively the highest P2O5 content
10
2.2. Samples characterization
DTA measurements were performed on a DTA/TG STA 449 Netzsch apparatus, using
approximately 150 mg of the powdered quenched samples with a controlled grain size of 80 -
125 μm, and a heating rate of 10 °C.min-1 to determine the glass transition temperature T g
(measured as the onset of the first endothermic effect). For the samples that were not completely
vitreous after quenching, Tg corresponds to the glass transition temperature of the residual glass
surrounding the crystals.
The microstructure of the quenched and slowly cooled samples was studied using a FEG-SEM
Zeiss supra 55VP microscope with a tungsten wire and operating at 15 kV with a working
distance of 8.8 mm. EDS analysis was carried out on the slowly cooled samples to determine
the nature of the heterogeneities detected on the SEM images. The composition of S10.Mo50sc
molybdate phases (see Section 3.3) corresponds to the average of five EDS measurements and
the error is the standard deviation of these measurements. To estimate the surface proportion of
the molybdate phases on the SEM images of the S10.Mo50sc sample, a set of five hundred
images were collected and processed with ImageJ software. The composition of several
quenched samples were checked by electron probe microanalysis (EPMA), with a CAMECA
SX100 (CAMPARIS, Paris, France) apparatus, operating at 15 kV and 4 nA. The Li2O content
was not directly analyzed, but deduced based on the difference from the total oxide content.
According to EPMA performed on several samples (results not shown), it appeared that the
analyzed compositions were close to the nominal compositions which indicates that no
important volatilization of oxides such as B2O3 and alkali oxides occurred during melting. Thus,
hereafter, the actual compositions of the samples of the different series were considered similar
to the nominal compositions. EPMA was also used to determine the composition of the residual
glass of the slowly cooled sample S10.Mo50sc (see Section 3.3). The result corresponds to an
11
XRD was conducted at room temperature on an X’Pert PRO MPD PANalytical instrument using Cu-Kα radiation (λKα1 = 0.15406 nm and λKα2 = 0.15444 nm) in Bragg-Brentano (θ-2θ)
geometry (U = 40 kV and I = 40 mA), and on a Bruker instrument using Co-Kα radiation (λKα1
= 0.17890 nm and λK α2 = 0.17929 nm) in Bragg-Brentano (θ-2θ) geometry (U = 35 kV and I
= 28 mA). For this analysis, the samples were crushed into powders. On the PANalytical
diffractometer, the XRD patterns were recorded over 2θ ranging from 10 to 90°, with a step of
0.017°, and an acquisition time per step of 489 s (i.e., a total acquisition time of 5 h). On the
Bruker apparatus, the XRD patterns were recorded over 2θ ranging from 10 to 80°, with a step
of 0.020°, and an acquisition time per step of 960 s (i.e., a total acquisition time of 5 h 05 min).
For the homogeneity of the results, all the patterns recorded with the Bruker diffractometer
were converted to the Cu wavelength. The identification of the crystalline phases present in
several samples was performed by comparing the patterns with the International Centre for
Diffraction Data (ICDD) database PDF4+2019 using HighScore and DIFFRAC.EVA software
packages. To extract the lattice parameters of the crystalline phases, refinements were
conducted using the “Le Bail” method [43], thanks to FullProf software.
3. Results
Glass transition temperature Tg
Tg was measured for each sample and the results, presented in Table 4, reveal that: (i) increasing
the loading rate from 10 to 30 wt% (by comparing S10.Rq, S20.Rq and S30.Rq samples) leads
to a significant increase of 44 °C in Tg; (ii) increasing the MoO3 content from 0 to 2.2 mol%
(compare S10.Mo0q, S10.Rq and S10.Mo50q samples, Fig.1) does not have significant impact
on Tg that remains close to 420°C; (iii) increasing the P2O5 content from 0 to 4.7 mol% (by
12
samples for the Series S20) leads to an increase of 13 °C and 39 °C in Tg respectively for the
Series S10 and S20; and (iv) increasing the ZrO2 content from 0 to 8.55 mol% (by comparing
S10.Zr0q, S10.Rq, S10.Zr50q samples for the Series S10, S20.Rq and S20.Zr50q samples for the
Series S20) only leads to a slight increase of 7 °C in Tg. The origin of these different effects
will be further detailed and discussed in Section 4.1.
Microstructural analysis
3.2.1. Effect of increasing the waste loading on the microstructure
Here, we present the studies on the incorporation of different loadings, namely 10, 20, and 30
wt% of the oxides representing the reference waste (Table 1) in glasses S10.R, S20.R and
S30.R, respectively (Table 3). The incorporation of 10 and 20 wt% of waste in the glass
(samples S10.R and S20.R) led to homogeneous glasses, both for the quenched and slowly
cooled samples according to both SEM and XRD (not shown here). However, the quenched
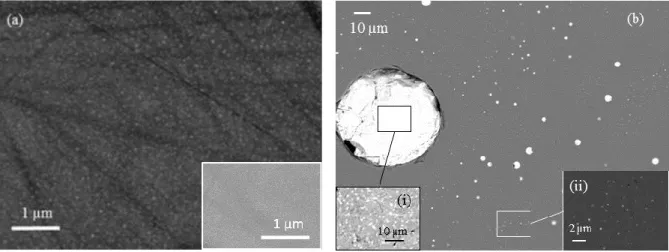
S30.Rq and the slowly cooled S30.Rsc samples were heterogeneous. For the quenched sample
S30.Rq, a high density of nm-sized heterogeneities (size < 100 nm) was clearly visible on the
SEM images (Fig. 3a). For this sample, the XRD pattern (Fig. 2) shows crystallization of two
phosphate phases, NaCaPO4 and NaLi2PO4. The broad diffraction peaks demonstrate a poor
crystallinity or small-size crystallites. The SEM images of the slowly cooled S30.Rsc sample
(Fig. 3b) prove the presence of μm-sized heterogeneities with different contrasts, thus reflecting
the variation in the composition. The globular shape of a high number of particles suggests that
they originated from a phase separation phenomenon in the liquid. For this sample, the
diffraction pattern (Fig. 2) reveals the crystallization of both molybdate and phosphate phases;
it shows the crystallization of Na2MoO4 (cubic low temperature form), CsLiMoO4, NaCaPO4,
NaLi2PO4, and Li3PO4. The EDS analyses confirmed the crystallization of Na2MoO4,
13
image in Fig. 3b). However, as Li cannot be detected by EDS, the exact nature of the alkali
phosphate phase could not be determined by this method.
3.2.2. Effect of varying the waste composition on the microstructure
Glasses with 10 wt% waste loading (Series S10)
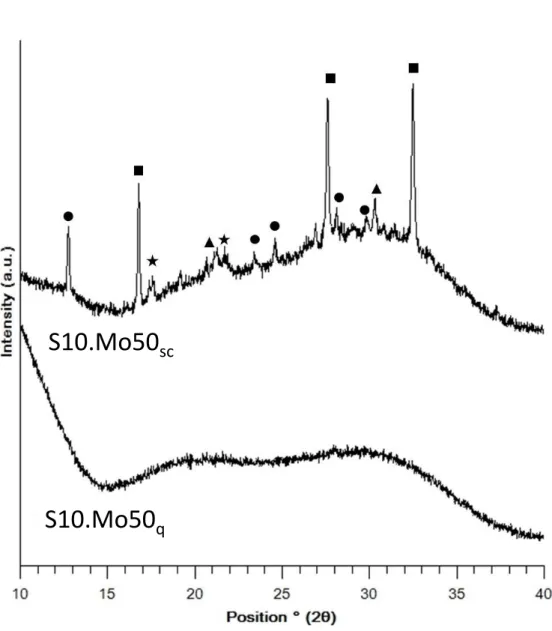
All the samples were homogeneous after both quenching and slow cooling except for
S10.Mo50. The SEM analysis of S10.Mo50q highlighted that a high density of nm-sized
heterogeneities was present essentially in the bulk of the sample (Fig. 4a). The brightness of the
heterogeneities on the SEM image shows that they contain heavy elements, compared to the
surrounding matrix. However, owing to the small size of the phases (<< 1 µm), the EDS
analyses could not determine their composition. In addition, XRD did not allow the detection
of the crystallized phases either (Fig. 5). However, the crystallization of molybdate phases in
the corresponding slowly cooled S10.Mo50sc sample shows that these phases could be
molybdate phases (Fig. 4b). The demixtion of a molybdenum-rich phase may have occurred at
the beginning of the quenching. As no heterogeneity was detected by SEM close to the sample
surface (insert in Fig. 4a), which had a higher quenching rate than the bulk, it confirms that this
phase separation only occurred during quenching, whereas the melt was homogeneous at 1100
°C. For the slowly cooled sample S10.Mo50sc, the XRD pattern (Fig. 5) proves the
crystallization of Na2MoO4 (cubic low temperature form), Na2MoO4.2H2O, and CsLiMoO4.
The presence of Na2MoO4.2H2O may be explained by Na2MoO4 hydration in the laboratory
atmosphere before the recording of the XRD pattern. The weak peaks at 2θ = 17.5 and 21.7°
may be due to the crystallization of the hexagonal high temperature form of Na2MoO4
(metastable at room temperature). Numerous heterogeneities with a highly variable size (from
a few hundreds of nm to 100 µm) were visible on the SEM images (Fig. 4b). The globular shape
14
in the liquid, during the slow cooling. The EDS analyses of the biggest separated globular
particles in the bulk revealed that they are enriched in Mo, Na, and Cs, and probably, Li as well
(not detectable by EDS). SEM images also showed that the brightest zones (μm-size) inside
these separated particles (Fig. 3b, inset (i)) were enriched in Cs and thus, probably corresponded
to CsLiMoO4, whereas the rest of the particles might correspond to Na2MoO4. The presence of
CsLiMoO4 in the separated phase was confirmed by a complementary analysis. On the surface
of the S10.Mo50sc sample, globular particles larger than the ones seen in the bulk were
observed. Thus, it was possible to select and probe using EDS only the brightest phases. Their
Cs2O content (42 wt%) and MoO3 content (50 wt%) were close to those of CsLiMoO4 ([Cs2O]
= 47 wt%, [MoO3] = 48 wt%).
Glasses with 20 wt% waste loading (S20 series)
The aim of employing the S20 series was to increase the waste loading in the glass to 20 wt%
and to focus on the incorporation of P2O5 and ZrO2, raised by 50 wt% in the waste. These two
oxides were chosen because they are only brought by the waste as Cs2O and MoO3 (i.e., these
four oxides are not present in the glass frit composition, Table 2). Cs2O and MoO3 were not
studied in the S20 series because the Cs2O content was already increased (by a factor 10) in the
reference waste compared to the true waste, and MoO3 already led to phase separation and
crystallization with a 10 wt% loading rate (S10.Mo50 sample, Figs. 4 and 5).
The SEM analyses (not presented) showed that S20.R and S20.Zr50 samples were
homogeneous after both quenching and slow cooling. This demonstrates that zirconium
remained solubilized in the glass structure even for this high waste loading. This was not the
case with phosphorus. Indeed, the SEM analysis of S20.P50q sample (Fig. 6a) highlighted the
presence of a high density of nm-size heterogeneities (size < 100 nm). The spherical shape of
15
XRD analyses (Fig. 7) revealed the crystallization of NaCaPO4 and NaLi2PO4. The same phases
were detected by XRD for the slowly cooled S20.P50sc sample (Fig. 7). It is important to remark
that in spite of the high amount of P2O5 in this sample (10 wt%), the incorporation of cesium in
the crystalline phosphate phases was not observed contrary to the case of the molybdate phases
for the MoO3-rich S10.Mo50 sample. For the S20.P50sc sample, two different heterogeneities
containing crystals are clearly visible on the SEM images (insert in Fig. 6b); one appears darker
than the matrix and the other, clearer. According to the EDS measurements, the clearer one was
enriched in Na, Ca, and P; and the darker one was enriched in Na and P; therefore, they could
be attributed to NaCaPO4 and NaLi2PO4 crystals, respectively (Fig. 7). The diffraction peaks of
the slowly cooled samples were slightly sharper than those of the quenched samples (Fig. 7),
probably owing to a larger size of the crystallites in the former because of the longer growth
time during the slow cooling. The microstructure of S20.P50sc sample was complex (Fig. 6b),
and composed of both spherical phases and elongated crystals; the size of the heterogeneities
in this sample was approximately 1 μm. The coexistence of these various crystalline
microstructures may be owing to the different growth temperatures during the sample cooling,
which have led to different viscosities of the supercooled liquid; for example, a dendritic growth
would be favored in the most viscous liquids, corresponding to a lower temperature.
Cs partition coefficient between the glass and crystals
As crystallization of a Cs-rich water soluble phase (CsLiMoO4) [44] was highlighted during the
slow cooling of S10.Mo50 sample (Fig. 5), it was important to focus on the distribution of Cs,
which is the main radioactive element (as 137Cs isotope) present in the waste, between the
globular separated phase and the residual glass (Fig. 4). In the general case, the molar
16
mol% M𝑥O𝑦 (phase 𝑖 𝑇𝑜𝑡⁄ ) = 100. 𝑚𝑓𝑖(M𝑥O𝑦).
𝑉𝑓(𝑖) . 𝑑(𝑖) 𝑀(𝑖) ∑ 𝑚𝑓𝑛1 𝑗(M𝑥O𝑦).𝑉𝑓(𝑗) . 𝑑(𝑗)𝑀(𝑗)
where Tot is the set of all the phases; mfi(MxOy) is the molar fraction of MxOy in phase i; Vf(i)
is the volumetric fraction of phase i; M(i) is the molar weight of phase i; and d(i) is the density
of phase i. For calculating the partition coefficient of Cs2O in our case, all the separated particles
were considered as one phase (Phase 1), and the glass matrix surrounding these particles as
Phase 2. Using the SEM images of the bulk of the S10.Mo50sc sample (Fig. 4b) and ImageJ
processing software, the surface fraction of Phase 1 was estimated to be 3 ±1%. As the particle
distribution in the sample was isotropic and homogeneous, the surface fraction determined by
SEM corresponded to the volume fraction [45]. EDS and EPMA analysis showed that Cs2O
represented 1.07 ±0.10 mol% of the separated particles (i.e., Phase 1), and 5.4×10⁻² ±1.3×10⁻²
mol% of the glass matrix (i.e., Phase 2), respectively. For comparison, the Cs2O nominal
concentration in S10.Mo50 sample was 0.1 mol% (Table 3). Thus, the Cs2O concentration was
approximately 43% lower in the residual glass than in the global sample. The density of the
residual glass matrix was estimated at 2.5 [46], and its molar weight was calculated to be 64
g.mol-1 from the composition determined by EPMA. For the sake of simplicity and because the
cubic form of Na2MoO4 was the most abundant molybdate phase in S10.Mo50sc sample
according to the intensity of the XRD peaks (Fig. 5), the densities and molar weights of all the
crystalline phases present in the globular particles were considered similar to those of the cubic
Na2MoO4 phase (d = 3.604 and M = 103 g.mol-1). According to all these analyses and
hypotheses, the calculations revealed that between 17 and 45 mol% of Cs2O migrated into the
globular separated phases and thus between 55 and 83 mol% of Cs2O remains in the percolating
residual glassy phase. This result will have to be further considered for the chemical durability
17
4. Discussion
Glass transition temperature
Because of the complexity of the glass compositions studied in this work (11-oxide glasses),
and particularly, the composition variations that have been considered among the different glass
series, it is difficult to easily correlate the variations in Tg with those in the concentration of a
particular oxide (Table 4). Nevertheless, we attempted to correlate the strongest Tg variations
observed with the waste loading and inside the different glass series with the strongest
variations in the oxide concentrations from one glass to another.
A comparison of the Tg of samples S10.Rq (417 °C), S20.Rq (437 °C), and S30.Rq (461 °C)
(Table 4) shows that increasing the waste loading led to a significant increase in Tg (+ 44 °C).
According to the molar compositions given in Table 3, the increase in Tg with the increase in
the amount of waste is probably mainly due to both a decrease in the Na2O + Li2O concentration
(–3.2 mol%) and an increase in the ZrO2 and P2O5 contents (+2.8 and +2.2 mol%, respectively).
Indeed, alkali oxides are well-known for their fluidizing effect in silicate glasses, and ZrO2 and
P2O5 are known for their reticulating effect on the silicate network [29,47].
The Tg values of all the quenched samples of the S10 series are between 391 and 427 °C (Table
4). S10.Na50 has a lower Tg (391 °C) than all the other samples (411 - 427 °C), owing to the
higher Na2O content in this glass (26.2 mol%, compared to less than 22.7 mol% for all other
glasses, Table 3).
A comparison of the Tg of S10.Mo0q (0 wt% MoO3), S10.Rq (0.30 mol% MoO3) and S10.Mo50q
(2.22 mol% MoO3) samples with increasing MoO3 content shows that Tg tends to remain
constant (417 - 420 °C, Table 4). Previous works on different silicate glasses indicated that Tg
18
on the silicate network, an evidence of which was provided by 29Si NMR for soda-lime
borosilicate glasses [3,10]. This particular effect of MoO3 content on Tg in the present study
could be explained by considering an increasing extension in glass structure of alkali-, alkaline
earth-, and molybdenum-rich depolymerized domains containing isolated MoO42- entities as it
was proposed for the addition of MoO3 in soda-lime borosilicate glasses [2]. Another structural
explanation was given by Tan et al. [48] for the effect on Tg of MoO3 addition in magnesium
aluminosilicate glasses that did not contain alkali oxides. As in our system, the initial content
of alkali and alkaline earth oxide is high (about 38 mol% in the S10.Mo0 sample) before MoO3
addition, the depolymerized domains are already extended in glass structure which suggests
that MoO3 addition (2.2 mol%, Table 3) does not significantly change the size of these domains;
therefore the amount of MoO3 added to the composition would not significantly modify the
network structure and Tg would to remain constant.
A comparison of the glass transition temperatures of S10.P0q (414 °C), S10.P50q (427 °C), and
S20.P50q (476 °C) (Table 4) shows that increasing the phosphorus oxide content from 0 to 4.7
mol% (Table 3) was responsible for a significant increase in Tg. This evolution is in accordance
with the available literature on borosilicate glasses with high a Na2O/B2O3 ratio (> 1) [26]. It
may be explained by the extraction of alkali or alkaline earth ions from the glassy network to
compensate the isolated PO43- and P2O72- units when P2O5 is added to the glass, which thus
becomes more polymerized. However, S10.P0q and S10.P50q samples were amorphous, and
S20.P50q samplewas strongly crystallized (Fig. 7). Thus, for this last sample, Tg corresponds
the glass transition temperature of the residual glass. The strong crystallization of phosphate
phases could explain the higher Tg increase (+62 °C) between S10.P0q and S20.P50q samples
than between S10.P0q and S10.P50q samples (+13 °C). In fact, the crystallization of NaLi2PO4
andNaCaPO4 in the S20.P50q sample (Fig. 7) definitively isolates a significant proportion of
19
Incorporation of molybdenum, phosphorus, and zirconium in glass
4.2.1. Molybdenum incorporation in glass
In this study, molybdate phase separation (followed or not by crystallization) was observed at
2.0 wt% (1.0 mol%) MoO3 in the slowly cooled S30.Rsc sample (Fig. 3), and at 5.0 wt% (2.2
mol%) MoO3 in the quenched S10.Mo50q sample (Fig. 4). In the quenched S10.Mo50q sample,
heterogeneities were only observable in the bulk of the sample, and the surface (which had the
highest cooling rate) was homogeneous at the SEM scale. This shows that phase separation was
not present in the melt at 1100 °C and only occurred during melt cooling.
The solubility limit of MoO3 in this study is in accordance with those given in literature for
borosilicate glasses [5,6,49]. For instance, in the soda-lime borosilicate glasses studied by
Magnin et al. [49] (66.4 SiO2 - 10.75 B2O3 - 14.05 Na2O - 8.65 CaO, mol%), the MoO3
solubility limit was about 2.5 mol% for the quenched samples and 1 mol% for the slowly cooled
samples. However, higher MoO3 solubility (higher than 5.3 mol%) was reported in magnesium
aluminoborosilicate glasses without alkali oxides [48].
Two molybdate crystalline phases were detected in S30.Rsc and S10.Mo50sc samples, namely
Na2MoO4 and CsLiMoO4 (Figs. 2 and 5). The crystallization occurred during melt cooling after
liquid–liquid phase separation (Fig. 4). The crystallization temperature of pure CsLiMoO4 (860
°C [50]) is known to be much higher than that of Na2MoO4 (688 °C [51]). Thus, CsLiMoO4
may have crystallized first in the separated droplets, and Na2MoO4, later during the cooling,
with surrounding CsLiMoO4 crystals having been already formed.
Regarding the Na2MoO4 crystals, two allotropic forms were present. The main one (which
crystallized in S30.Rsc and S10.Mo50sc samples (Figs. 2 and 5)) is the cubic form, which is
stable at the ambient temperature. The second one, close to the high-temperature hexagonal
20
crystallization of such a high-temperature phase in the slowly cooled sample could be explained
by the formation of nano-sized high temperature molybdate phases that are stabilized by the
surrounding matrix.
In comparison with Na2MoO4, the crystallization of CsLiMoO4 has been rarely reported in
literature. For instance, Morgan et al. [52] highlighted the formation of CsLiMoO4 during the
incorporation of waste in a sodium lithium borosilicate glass (63.4 SiO2 - 20.0 B2O3 - 11.1 Na2O
- 5.5 Li2O, mol%). In the present work, CsLiMoO4 was the only Cs-bearing crystalline phase
observed, which suggests that this phase crystallized preferentially to other Cs-bearing phases,
such as CsNaMoO4 (observed in other works [7,12], and not here). Moreover, the lattice
parameters of the cubic form Na2MoO4 that crystallized in S30.Rsc and S10.Mo50sc samples
(9.117 ±0.001 and 9.122 ±0.001 Å, respectively, according to the Le Bail refinement) are higher
than that of the pure Na2MoO4 phase (9.109 Å [53]). This suggests that the big Cs+ ions could
have partially replaced a fraction of the Na+ ions in this phase, and lead to the lattice expansion.
The molybdate phases that were detected in S30.Rsc and S10.Mo50sc samples were only
alkali-bearing phases, and CaMoO4 crystallization was never observed, whereas several studies
reported the preferential crystallization of CaMoO4 in soda-lime aluminoborosilicate glasses
[10,54,55]. This observation may be explained by the higher alkali oxide content (29 - 32 mol%,
Table 3) and the lower B2O3 and CaO contents (7.1 - 7.9 and 5.2 - 6.1 mol% respectively, Table
3) for the compositions studied in the present work, which were disadvantageous for CaMoO4
crystallization [3,10].
4.2.2. Phosphorus incorporation in glass
Among the different P-rich compositions prepared in this study, the one with the lowest P2O5
content, leading to phosphate crystallization was S30.R with 6.5 wt% (3.2 mol%) P2O5 (Figs.
21
containing 5 wt% (2.2 mol%) P2O5, even after slow cooling. Muñoz et al. [23] highlighted that
phosphorus speciation in silicate glasses strongly depended on the glassy matrix. The higher
the Na2O content and the lower the B2O3 content, the lower the solubility limit would be
because these conditions favor the formation of phosphate groups isolated from the silicate
network (i.e, not connected to the borosilicate network). In quenched sodium borosilicate
glasses with a high Na2O/B2O3 ratio (> 1), these authors demonstrated crystallization of Na3PO4
and Na4P2O7 from 3 mol% P2O5 [23], which is close to the P2O5 content in S30.R sample.
However, in our samples, the crystallization of pure sodium phosphate phases (i.e., Na3PO4,
Na4P2O7) was not observed. Because of the large Na2O excess (> 20 mol%), compared to other
alkali and alkaline earth oxides (< 15 mol% Li2O + Cs2O + CaO) in S20.P50 and S30.R samples,
the crystallization of pure sodium phosphate phases, such as Na3PO4, could be expected as in
the study by Glatz et al. [25] on a P2O5-bearing sodium aluminosilicate glass (51 SiO2 - 18,4
Al2O3 - 27,6 Na2O - 3 P2O5, mol%), or in the study by Muñoz et al. [23] on a P2O5-bearing
sodium borosilicate glass (40 Na2O - 20 B2O3 - 40 SiO2 + 3 P2O5, mol%). In the present work,
the crystallization of NaCaPO4, NaLi2PO4, or Li3PO4 phases, in which phosphorus is only
present as non-connected PO43- units, and the absence of Na3PO4 suggests a common tendency
of calcium, lithium, and phosphorus to separate from the glassy network, together with sodium
which could be explained as follows: firstly, it is known that in alkali and alkaline earth-rich
silicate glasses, phosphorus is mainly incorporated into the glass structure as isolated
orthophosphate PO43- units surrounded by alkali and alkaline earth cations for local
charge-compensation in depolymerized regions [15,17–19]; secondly, owing to the higher field
strength of Li+ and Ca2+, compared to Na+ (FLi+ = 0, 23-0, 26 Å-2, FCa2+ = 0, 33-0, 36 Å-2, FNa+
= 0, 18-0, 19 Å-2 [2]), Li+ and Ca2+ have a higher tendency than Na+ to separate from the silicate
network, leading either to demixtion or crystallization; lastly, it is also well known that in
22
compared to Li+ and Ca2+ ions [56,57]. Thus, all these considerations suggest that lithium and
calcium have a higher tendency than sodium to join phosphorus in the depolymerized regions
of the glass structure, and then form crystalline phases. Eventually, owing to the high Na2O
content in our samples, a significant fraction of Na+ ions is probably mixed with Li+ and Ca2+
ions in the neighborhood of orthophosphate units, which explains the presence of sodium in
NaCaPO4 and NaLi2PO4 crystals.
With regard to the crystallization mechanism of phosphate phases, the nano-sized separated
phases obtained in the quenched S30.Rq and S10.P50q samples suggest that the melt was
homogeneous at 1100 °C, but separated and crystallized during cooling. Moreover, in the
slowly cooled S30.Rsc and S20.P50sc samples, spherical phosphate droplets and elongated
phosphate phases coexist (Figs. 3 and 6). The presence of spherical phosphate phases suggests
that they were formed by liquid–liquid phase separation, followed by crystallization. The
elongated ones may be formed in a more viscous liquid, i.e., at lower temperatures compared
to that of the droplets.
4.2.3. Zirconium incorporation in glass
Similar to Mo6+ and P5+ ions, Zr4+ ion is a high-field strength cation present in high proportions
in the waste that could separate from the silicate network in the liquid melt, and in the quenched
or slowly cooled glass. However, for the glass composition studied in this work, it appeared
that ZrO2 did not lead to phase separation or crystallization at least up to 10 wt% (5.4 mol%) in
the S20.Zr50 sample, even after slow cooling. This indicates that zirconium was solubilized
well in the glassy network probably because it is present as ZrO62- entitiesconnected to the
silicate network with alkali and alkaline earth ions ensuring local charge compensation, as in
the French R7T7 glass and other peralkaline borosilicate glasses [29,35,38]. For higher ZrO2
23
at 1100 °C, it would have been necessary to increase the melting temperature to reach the
liquidus temperature to hope to obtain a glass, but such a temperature would be higher than that
of the vitrification process envisaged in this work.
Application to an industrial process: ability of glass to incorporate the dismantling waste
The results obtained for almost all the samples with 10 wt% of waste loading (Series S10) led
to homogeneous melts and glasses (at SEM and XRD scale). This shows the ability of the glass
composition selected in this work to accept a wide range of waste composition variations.
However, among all the compositions tested in Series S10, one exception was that containing
a high proportion of molybdenum, namely S10.Mo50 sample containing 50 wt% MoO3 in the
waste (Fig. 1). In this case, the results show that the melt at 1100 °C is homogeneous; however,
separated phases and crystallization appeared during melt cooling (Figs. 4 and 5). Because the
crystallized phases may contained cesium (as in CsLiMoO4), which is the main radioactive
element (137Cs) present in the dismantling waste considered in this work, special attention must
be paid to this element. The incorporation of cesium in the crystallized phase CsLiMoO4 at 10
wt% waste loading with 50 wt% of MoO3 in the waste was thus the limiting point. To consider
a further increase in the waste loading, studies should be conducted on the chemical durability
of the waste forms and the Cs-partition in the samples containing 1 wt% of Cs2O (which is
closer to the real waste).
5. Conclusions
The aim of this work was to study the incorporation of ZrO2, P2O5 and MoO3 by melting at
24
and an aluminoborosilicate glass frit highly rich in alkali oxides. Twenty glass compositions
have thus been prepared based on oxide (mainly) powders mixing. The aim of these twenty
compositions was to take into account the wide composition range of the waste and to study the
impact of increasing the waste loading from 10 to 30 wt% in the final glass. The incorporation
of Zr, P and Mo oxides was studied by analyzing the resulting slowly cooled and quenched
glasses by SEM-EDS and XRD.
Molybdenum was the first element of the waste that may lead to phase separation and
crystallization when its content in the simulating wastes is increased. In fact, molybdate
crystallization appeared at 5 wt% (2.2 mol%) MoO3 for quenched samples, and at 2.0 wt% (1.0
mol%) MoO3 for slowly cooled samples. Two molybdate phases (Na2MoO4 and CsLiMoO4)
crystallized. P2O5 may also lead to phase separation and crystallization (NaCaPO4, NaLi2PO4,
and Li3PO4). This phenomena first appeared at 6.5 wt% (3.18 mol%) P2O5 for both the
quenched and slowly cooled samples. The separation tendency of molybdenum and phosphorus
was owing to the high field strength of Mo6+ and P5+ ions, and to the mobility of MoO
42- and
PO43- units that are not connected to the silicate network. Zirconium is more soluble in the glass
probably because of the existence of a connection between Zr6+ ions and Si through Zr-O-Si
bonds. The difficulties encountered in melting Zr-rich compositions at 1100 °C were mainly
because of the high refractory character of ZrO2 in comparison to that of all the other oxides
present in the composition.
Finally, the 10 wt% waste loading is an acceptable waste loading, as almost all the glass
compositions resulting from this loading value are homogeneous. However, the presence of Cs
in the water soluble CsLiMoO4 phase appearing in the case of the waste containing 50 wt%
MoO3, (S10.Mo50 sample) highlights the need to further investigate this case and to study the
25
6. Acknowledgments
This study is a part of the DEM&MELT project, which is a partnership between CEA, industrial
partners (Orano, ECM Technologies), and ANDRA. This project is supported by the French
government program titled “Programme d’Investissements d’Avenir (PIA)”, whose
management was entrusted to ANDRA.
The authors want to express their thanks to Charlène Vallat, Lionel Campayo, and Damien
Perret of CEA Marcoule for their help in SEM and DTA analyses. The authors also gratefully
acknowledge Michel Fialin and Nicolas Rividi (CAMPARIS service, Paris, France) for their
26
References
[1] C. Girold, S. Francois, L. Petit, S. Catherin, T. Prevost, E. Fourcy, A. Viand, French innovative processes in the field of thermal treatment for decommissioning and legacy waste, in: Waste Manag., Phenix, United States, 2018. https://hal-cea.archives-ouvertes.fr/cea-02339255/.
[2] D. Caurant, P. Loiseau, O. Majérus, V. Aubin-Chevaldonnet, I. Bardez, A. Quintas, Glasses, glass-ceramics and ceramics for immobilization of highly radioactive nuclear wastes, Nova Sciences, New York, 2009. https://doi.org/10.1134/S0030400X14050063. [3] D. Caurant, O. Majérus, E. Fadel, A. Quintas, C. Gervais, T. Charpentier, D. Neuville, Structural investigations of borosilicate glasses containing MoO3 by MAS NMR and
Raman spectroscopies, J. Nucl. Mater. 396 (2010) 94–101.
https://doi.org/10.1016/j.jnucmat.2009.10.059.
[4] G. Calas, M. Le Grand, L. Galoisy, D. Ghaleb, Structural role of molybdenum in nuclear glasses: An EXAFS study, J. Nucl. Mater. 322 (2003) 15–20. https://doi.org/10.1016/S0022-3115(03)00277-0.
[5] E. Nicoleau, S. Schuller, F. Angeli, T. Charpentier, P. Jollivet, A. Le, M. Fournier, A. Mesbah, F. Vasconcelos, Phase separation and crystallization effects on the structure and durability of molybdenum borosilicate glass, J. Non. Cryst. Solids. 427 (2015) 120–133. https://doi.org/10.1016/j.jnoncrysol.2015.07.001.
[6] T. Ohkubo, R. Monden, Y. Iwadate, S. Kohara, K. Deguchi, Structural investigation of aluminoborosilicate glasses containing Na2MoO4 crystallites by solid state NMR, Phys.
Chem. Glas. - Eur. J. Glas. Sci. Technol. Part B. 56 (2015) 139–144. https://doi.org/10.13036/17533562.56.4.139.
[7] S. Kroeker, S. Schuller, J.E.C. Wren, B.J. Greer, A. Mesbah, 133Cs and 23Na MAS NMR spectroscopy of molybdate crystallization in model nuclear glasses, J. Am. Ceram. Soc. 99 (2016) 1557–1564. https://doi.org/10.1111/jace.14082.
[8] S. Tan, The incorporation and solubility of sulphate, chloride and molybdate anions in borosilicate and aluminosilicate glasses, PhD Thesis, University oh Sheffield, 2015. [9] C. Cousi, F. Bart, J. Phalippou, Phase separation and crystallisation induced by adding
molybdenum and phosphorus to a soda–lime–silica glass, Glas. Technol. 45 (2004) 65– 67.
[10] D. Caurant, O. Majérus, E. Fadel, M. Lenoir, C. Gervais, O. Pinet, Effect of molybdenum on the structure and on the crystallization of SiO2-Na2O-CaO-B2O3 glasses, J. Am.
27
Ceram. Soc. 90 (2007) 774–783. https://doi.org/10.1111/j.1551-2916.2006.01467.x. [11] J. Teillac, Nuclear wastes (in French), Presses Universitaires de France, 1988.
[12] B.J. Greer, S. Kroeker, Characterisation of heterogeneous molybdate and chromate phase assemblages in model nuclear waste glasses by multinuclear magnetic resonance spectroscopy, Phys. Chem. Chem. Phys. 14 (2012) 7375–7383. https://doi.org/10.1039/c2cp40764g.
[13] S. Kroeker, C.S. Higman, V.K. Michaelis, N.B. Svenda, S. Schuller, Precipitation of mixed-alkali molybdates during HLW vitrification, MRS Online Proc. Libr. Arch. 1265 (2010). https://doi.org/10.1557/PROC-1265-AA03-03.
[14] L.L. Hench, The story of bioglass, J. Mater. Sci. Mater. Med. 17 (2006) 967–978. https://doi.org/10.1007/s10856-006-0432-z.
[15] F. Fayon, C. Duée, T. Poumeyrol, M. Allix, D. Massiot, Evidence of nanometric-sized phosphate clusters in bioactive glasses as revealed by solid-state 31P NMR, J. Phys. Chem. C. 117 (2013) 2283–2288. https://doi.org/10.1021/jp312263j.
[16] E. Leonova, I. Izquierdo-Barba, D. Arcos, A. López-Noriega, N. Hedin, M. Vallet-Regí, M. Edén, Multinuclear solid-state NMR studies of ordered mesoporous bioactive glasses, J. Phys. Chem. C. 112 (2008) 5552–5562. https://doi.org/10.1021/jp7107973.
[17] R. Mathew, C. Turdean-Ionescu, B. Stevensson, I. Izquierdo-Barba, A. García, D. Arcos, M. Vallet-Regí, M. Edén, Direct probing of the phosphate-ion distribution in bioactive silicate glasses by solid-state NMR: Evidence for transitions between random/clustered scenarios, Chem. Mater. 25 (2013) 1877–1885. https://doi.org/10.1021/cm400487a. [18] B. Stevensson, R. Mathew, M. Edén, Assessing the phosphate distribution in bioactive
phosphosilicate glasses by 31P solid-state NMR and molecular dynamics simulations, J.
Phys. Chem. B. 118 (2014) 8863–8876. https://doi.org/10.1021/jp504601c.
[19] Y. Yu, B. Stevensson, M. Edén, Medium-range structural organization of phosphorus-bearing borosilicate glasses revealed by advanced solid-state NMR experiments and MD simulations: Consequences of B/Si substitutions, J. Phys. Chem. B. 121 (2017) 9737– 9752. https://doi.org/10.1021/acs.jpcb.7b06654.
[20] R. Dupree, D. Holland, M.G. Mortuza, M.W.G. Lockyer, An MAS NMR study of network - cation coordination in phosphosilicate glasses, J. Non. Cryst. Solids. 106 (1988) 403–407. https://doi.org/10.1016/0022-3093(88)90298-0.
[21] M.J. Toplis, T. Schaller, A 31P MAS NMR study of glasses in the system xNa2
O-(1-x)Al2O3-2SiO2-yP2O5, J. Non. Cryst. Solids. 224 (1998) 57–68.
28
[22] A. Tilocca, A.N. Cormack, Structural effects of phosphorus inclusion in bioactive silicate glasses structural effects of phosphorus inclusion in bioactive silicate glasses, J. Phys. Chem. B. 111 (2007) 14256–14264. https://doi.org/10.1021/jp075677o.
[23] F. Muñoz, L. Montagne, Influence of phosphorus speciation on the phase separation of Na2O-B2O3-SiO2 glasses, Phys. Chem. Glas. - Eur. J. Glas. Sci. Technol. Part B. 49
(2008) 339–345.
[24] T. Schaller, C. Rong, M.J. Toplis, H. Cho, TRAPDOR NMR investigations of phosphorus-bearing aluminosilicate glasses, J. Non. Cryst. Solids. 248 (1999) 19–27. https://doi.org/10.1016/S0022-3093(99)00098-8.
[25] P. Glatz, Influence of P2O5 on the structure and nucleation of alkali aluminosilicate
glasses, PhD, Sorbonne University, 2018. https://hal-cnrs.archives-ouvertes.fr/tel-02865425/.
[26] F. Muñoz, L. Montagne, L. Delevoye, A. Durán, L. Pascual, S. Cristol, J.F. Paul, Phosphate speciation in sodium borosilicate glasses studied by nuclear magnetic
resonance, J. Non. Cryst. Solids. 352 (2006) 2958–2968.
https://doi.org/10.1016/j.jnoncrysol.2006.04.016.
[27] S. Schuller, F. Bart, Phase separation and crystallization induced by the addition of Mo and P to a calcium-sodium silicate glass, in : Glass Odyssey 6th ESG Conference, in: 2002.
[28] M.D. O’Donnell, S.J. Watts, R. V Law, R.G. Hill, Effect of P2O5 content in two series
of soda lime phosphosilicate glasses on structure and properties–Part II: Physical
properties., J. Non. Cryst. Solids. 354 (2008) 3561–3566.
https://doi.org/10.1016/j.jnoncrysol.2008.03.035.
[29] A. Quintas, D. Caurant, O. Majérus, P. Loiseau, T. Charpentier, J.L. Dussossoy, ZrO2
addition in soda-lime aluminoborosilicate glasses containing rare earths: Impact on the
network structure, J. Alloys Compd. 714 (2017) 47–62.
https://doi.org/10.1016/j.jallcom.2017.04.182.
[30] J.P. Icenhower, C.I. Steefel, Dissolution rate of borosilicate glass SON68: A method of quantification based upon interferometry and implications for experimental and natural weathering rates of glass, Geochim. Cosmochim. Acta. 157 (2015) 147–163. https://doi.org/10.1016/j.gca.2015.02.037.
[31] R. Guillaumont, Chemical elements to consider in the back-end nuclear cycle (in
French), Comptes Rendus Chim. 7 (2004) 1129–1134.
29
[32] D.A. Mckeown, I.S. Muller, A.C. Buechele, I.L. Pegg, C.A. Kendziora, Structural characterization of high-zirconia borosilicate glasses using Raman spectroscopy, J. Non. Cryst. Solids. 262 (2000) 126–134. https://doi.org/10.1016/S0022-3093(99)00691-2. [33] D. Caurant, A. Quintas, O. Majérus, P. Loiseau, T. Charpentier, P. Vermaut, J.-L.
Dussossoy, Structural and crystallization study of a simplified aluminoborosilicate nuclear glass containing rare-earths: effect of ZrO2 concentration, MRS Online Proc.
Libr. Arch. 1265 (2010). https://doi.org/10.1557/PROC-1265-AA03-02.
[34] A.J. Connelly, N.C. Hyatt, K.P. Travis, R.J. Hand, E.R. Maddrell, R.J. Short, The structural role of Zr within alkali borosilicate glasses for nuclear waste immobilisation,
J. Non. Cryst. Solids. 357 (2011) 1647–1656.
https://doi.org/10.1016/j.jnoncrysol.2011.01.005.
[35] L. Galoisy, M. Arrio, P. Ildefonse, G. Calas, Evidence for 6-coordinated zirconium in inactive nuclear waste glasses, J. Am. Ceram. Soc. 82 (1999) 2219–2224. https://doi.org/10.1111/j.1151-2916.1999.tb02065.x.
[36] P. Jollivet, G. Calas, L. Galoisy, F. Angeli, B. Bergeron, S. Gin, M.P. Ruffoni, N. Trcera, An enhanced resolution of the structural environment of zirconium in borosilicate
glasses, J. Non. Cryst. Solids. 381 (2013) 40–47.
https://doi.org/10.1016/j.jnoncrysol.2013.09.013.
[37] F. Angeli, T. Charpentier, M. Gaillard, P. Jollivet, Influence of zirconium on the structure of pristine and leached soda-lime borosilicate glasses : Towards a quantitative approach by 17O MQMAS NMR, J. Non. Cryst. Solids. 354 (2008) 3713–3722.
https://doi.org/10.1016/j.jnoncrysol.2008.03.046.
[38] X. Lu, L. Deng, S. Kerisit, J. Du, Structural role of ZrO2 and its impact on properties of
boroaluminosilicate nuclear waste glasses, Npj Mater. Degrad. 2 (2018) 19. https://doi.org/10.1038/s41529-018-0041-6.
[39] G. Ferlat, L. Cormier, M.H. Thibault, L. Galoisy, G. Calas, Evidence for symmetric cationic sites in zirconium-bearing oxide glasses, Phys. Rev. B. 73 (2006) 214207. https://doi.org/10.1103/PhysRevB.73.214207.
[40] E. Pèlegrin, G. Calas, P. Ildefonse, P. Jollivet, L. Galoisy, Structural evolution of glass surface during alteration: Application to nuclear waste glasses, J. Non. Cryst. Solids. 356 (2010) 2497–2508. https://doi.org/10.1016/j.jnoncrysol.2010.02.022.
[41] S. Schuller, O. Pinet, B. Penelon, Liquid-liquid phase separation process in borosilicate liquids enriched in molybdenum and phosphorus oxides, J. Am. Ceram. Soc. 94 (2011) 447–454. https://doi.org/10.1111/j.1551-2916.2010.04131.x.
30
[42] O. Pinet, R. Boën, Glass ceramics containment matrix for insoluble residues coming from spent fuel reprocessing, J. Nucl. Mater. 447 (2014) 183–188. https://doi.org/10.1016/j.jnucmat.2014.01.008.
[43] A. Le Bail, H. Duroy, J.L. Fourquet, Ab-initio structure determination of LiSbWO6 by
X-ray powder diffraction, Mater. Res. Bull. 23 (1988) 447–452. https://doi.org/10.1016/0025-5408(88)90019-0.
[44] R.F. Klevtsova, P. V. Klevtsov, K.S. Aleksandrov, Synthesis and crystal structure of CsLiMoO4, Sov. Physics, Dokl. 25 (1980) 966–968.
[45] J.C. Russ, R.T. Dehoff, Practical Stereology, 2nd edition, Plenum Press, New York, 1986.
[46] Internal sources, CEA. (n.d.).
[47] D. Li, M.E. Fleet, G.M. Bancroft, M. Kasrai, Local structure of Si and P in SiO2-P2O5
and Na2O-SiO2-P2O5 glasses: a XANES study, J. Non-Crystalline Solid. 188 (1995)
181–189. https://doi.org/10.1016/0022-3093(95)00100-X.
[48] S. Tan, M.I. Ojovan, N.C. Hyatt, R.J. Hand, MoO3 incorporation in magnesium
aluminosilicate glasses, J. Nucl. Mater. 458 (2015) 335–342. https://doi.org/10.1016/j.jnucmat.2014.11.069.
[49] M. Magnin, S. Schuller, D. Caurant, O. Majérus, D. de Ligny, C. Mercier, Effect of compositional changes on the structure and crystallization tendency of a borosilicate
glass containing MoO3, (2009) 59–67.
https://doi.org/s://doi.org/10.1002/9780470538371.ch7.
[50] K.S. Aleksandrov, A.T. Anistratov, S. V. Melnikova, P. V. Klevtsov, A.I. Kruglik, V.N. Voronov, Ferroelectric phase transitions in CsLiMoO4 single crystals, Phys. Status
Solidi. 67 (1981) 377–380. https://doi.org/10.1002/pssa.2210670203.
[51] Y.G. Petrosyan, E. V. Tkachenko, V.M. Zhukovskij, Phase diagrams of Na2MoO4
-MMoO4 (M-Ca, Sr, Ba), Izv. Akad. Nauk SSSR, Neorg. Mater. 11 (1975) 1618–1621.
[52] S.R.J. Morgan, R.J. Hand, N.C. Hyatt, L.W. E., Interactions of simulated high level waste (HLW) calcine with alkali borosilicate glass, MRS Online Proc. Libr. Arch. 807 (2003). https://doi.org/10.1557/PROC-807-151.
[53] A.D. Fortes, Crystal structures of spinel-type Na2MoO4 and Na2WO4 revisited using
neutron powder diffraction, Acta Crystallogr. Sect. E Crystallogr. Commun. 71 (2015) 592–596. https://doi.org/S2056989015008774.
[54] A. Brehault, D. Patil, H. Kamat, R.E. Youngman, M. Lynn, J.C. Mauro, C. Corkhill, J.S. Mccloy, A. Goel, Compositional dependence of solubility/retention of molybdenum
31
oxides in aluminoborosilicate based model nuclear waste glass, J. Phys. Chemsitry B. 122 (2018) 1714–1729. https://doi.org/10.1021/acs.jpcb.7b09158.
[55] T. Taurines, B. Boizot, Synthesis of powellite-rich glasses for high level waste immobilization, J. Non. Cryst. Solids. 357 (2011) 2723–2725. https://doi.org/10.1016/j.jnoncrysol.2011.02.024.
[56] A. Quintas, D. Caurant, O. Majérus, T. Charpentier, J.L. Dussossoy, Effect of compositional variations on charge compensation of AlO4 and BO4 entities and on
crystallization tendency of a rare-earth-rich aluminoborosilicate glass, Mater. Res. Bull. 44 (2009) 1895–1898. https://doi.org/10.1016/j.materresbull.2009.05.009.
[57] D. Caurant, A. Quintas, O. Majérus, T. Charpentier, I. Bardez, Structural role and distribution of alkali and alkaline-earth cations in rare earth-rich aluminoborosilicate
glasses, Adv. Mater. Res. 39–40 (2008) 19–24.
32
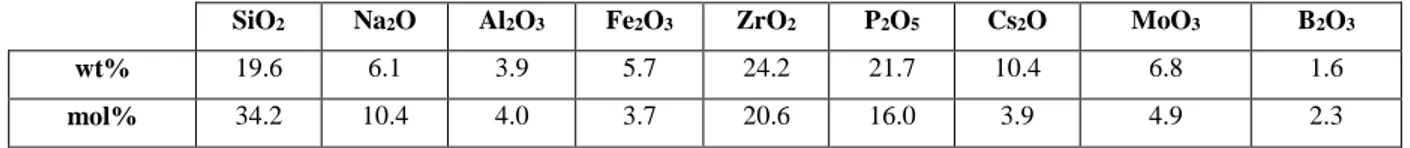
SiO2 Na2O Al2O3 Fe2O3 ZrO2 P2O5 Cs2O MoO3 B2O3
wt% 19.6 6.1 3.9 5.7 24.2 21.7 10.4 6.8 1.6
mol% 34.2 10.4 4.0 3.7 20.6 16.0 3.9 4.9 2.3
Table 1: Average nominal composition of the dismantling waste considered in this study (in
wt% and mol%). To facilitate the study of cesium incorporation in the different phases that
could form in the glasses of the different series, the Cs2O content was increased by a factor of
approximately 10 compared to its actual concentration in the decommissioning and dismantling
33
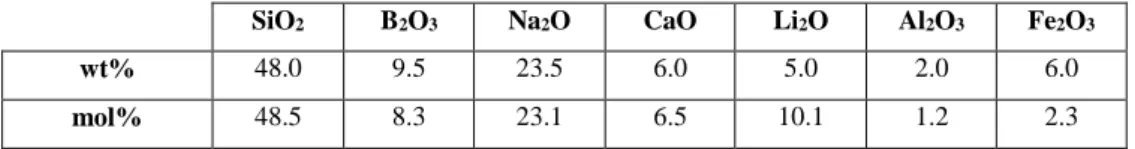
Table 2: Nominal composition of the glass frit that would be added to the dismantling waste
(Table 1) during melting to prepare the nuclear glass (in wt% and mol%).
SiO2 B2O3 Na2O CaO Li2O Al2O3 Fe2O3
wt% 48.0 9.5 23.5 6.0 5.0 2.0 6.0
34
Series S10 (10 wt% waste)
S10.R S10.Mo0 S10.Mo50 S10.P0 S10.P50 S10.Zr0 S10.Zr50 S10.Fe0 S10.Fe50 S10.Si0
SiO2 45.1 (47.7) 45.3 (47.8) 44.2 (47.0) 45.7 (48.1) 44.3 (47.2) 45.8 (48.2) 44.3 (47.1) 45.3 (47.7) 44.2 (47.1) 43.2 (46.1) B2O3 8.7 (7.9) 8.8 (7.9) 8.6 (7.9) 8.8 (8.0) 8.7 (7.9) 8.7 (8.0) 8.5 (7.9) 8.7 (7.9) 8.6 (7.9) 8.8 (8.0) Na2O 21.8 (22.3) 21.8 (22.3) 21.5 (22.0) 21.9 (22.3) 21.5 (22.2) 22.0 (22.4) 22.4 (22.1) 21.8 (22.3) 21.4 (22.1) 21.9 (22.6) CaO 5.4 (6.2) 5.4 (6.1) 5.4 (6.0) 5.4 (6.1) 5.4 (6.1) 5.4 (6.1) 5.3 (6.1) 5.4 (6.1) 5. 4 (6.1) 5.4 (6.1) Li2O 4.5 (10,0) 4.5 (9.6) 4.5 (9.6) 4.5 (9.5) 4.5 (9.6) 4.5 (9.5) 4.4 (9.5) 4.5 (9.5) 4.5 (9.6) 4.50 (9.6) Al2O3 2.2 (1.4) 2.2 (1.4) 2.0 (1.2) 2.3 (1.5) 2.1 (1.3) 2.3 (1.4) 2.0 (1.3) 2.2 (1.4) 2.0 (1.3) 2.3 (1.4) Fe2O3 6.0 (2.4) 6.0 (2.4) 5.7 (2.8) 6.1 (2.2) 5.8 (2.3) 6.1 (2.4) 5.7 (2.3) 5.4 (2.2) 10.4 (4.2) 6.1 (2.4) ZrO2 2.4 (1.3) 2.6 (1.3) 1.3 (0.7) 3.1 (1.6) 1.6 (0.8) 0.00 (0.00) 5.0 (2.6) 2.6 (1.3) 1.3 (0.7) 3.0 (1.5) P2O5 2.2 (0.3) 2.3 (1.0) 1.2 (0.5) 0.00 (0.00) 5.00 (2.2) 2.9 (1.3) 1.4 (0.7) 2.3 (1.0) 1.2 (0.6) 2.7 (1.2) MoO3 0.7 (0.3) 0.00 (0.00) 5.0 (2.2) 0.9 (0.4) 0.4 (0.2) 0.9 (0.4) 0.4 (0.2) 0.7 (0.3) 0.4 (0.2) 0.8 (0.3) Cs2O 1.0 (0.2) 1.1 (0.2) 0.6 (0.1) 1.3 (0.3) 0.7 (0.2) 1.4 (0.3) 0.7 (0.2) 1.1 (0.3) 0.6 (0.2) 1.3 (0.9) Series S10 (10 wt% waste) Series S20 (20 wt% waste) Series S30 (30 wt% waste) S10.Si50 S10.Na0 S10.Na50 S10.Al0 S10.Al50 S20.R S20.Zr50 S20.P50 S30.R S30.Zr50
SiO2 48.2 (50.0) 45.3 (48.0) 44.3 (47.8) 45.3 (47.7) 44.2 (46.6) 42.3 (46.7) 40.99 (45.5) 40.9 (45.7) 39.5 (45.6) 37.5 (43.8) B2O3 8.7 (7.7) 8.8 (7.9) 8.6 (7.7) 8.7 (7.9) 8.6 (7.9) 7.9 (7.6) 7.81 (7.5) 7.8 (7.5) 7.1 (7.1) 7.0 (7.0) Na2O 21.5 (21.6) 21.1 (21.7) 26.1 (26.3) 21.8 (22.3) 21.5 (22.0) 20.1 (21.4) 19.61 (21.2) 19.6 (21.2) 18.3 (20.5) 17.7 (20.0) CaO 5.4 (6.0) 5.4 (6.1) 5.4 (6.0) 5.4 (6.1) 5.4 (6.1) 4.8 (5.7) 4.80 (5.7) 4.8 (5.7) 4.2 (5.2) 4.2 (5.3) Li2O 4.5 (9.4) 4.5 (9.6) 4.5 (9.4) 4.5 (9.5) 4.5 (9.5) 4.0 (8.9) 4.00 (8.9) 4.0 (9.0) 3.5 (8.1) 3.5 (8.2) Al2O3 2.0 (1.3) 2.2 (1.4) 2.0 (1.2) 1.8 (1.1) 6.8 (4.2) 2.4 (1.5) 2.12 (1.4) 2.1 (1.4) 2.6 (1.8) 2.2 (1.5) Fe2O3 5.8 (2.2) 6.0 (2.4) 5.7 (2.2) 6.0 (2.4) 5.7 (2.3) 5.9 (2.5) 5.56 (2.3) 5.5 (2.3) 5.9 (2.6) 5.3 (2.3) ZrO2 1.5 (0.8) 2.6 (1.3) 1.3 (0.6) 2.5 (1.3) 1.3 (0.6) 4.8 (2.6) 10.00 (5.4) 3.1 (1.7) 7.3 (4.1) 15.0 (8.6) P2O5 1.3 (0.6) 2.3 (1.0) 1.1 (0.5) 2.2 (1.0) 1.1 (0.5) 4.3 (2.0) 2.86 (1.4) 10.0 (4.7) 6.5 (3.2) 4.2 (2.1) MoO3 0.4 (0.2) 0.7 (0.3) 0.4 (0.1) 0.7 (0.3) 0.4 (0.2) 1.4 (0.6) 0.90 (0.4) 0.9 (0.4) 2.0 (1.0) 1.3 (0.7) Cs2O 0.7 (0.2) 1.1 (0.3) 0.6 (0.2) 1.1 (0.3) 0.5 (0.1) 2.1 (0.5) 1.37 (0.3) 1.4 (0.3) 3.1 (0.8) 2.1 (0.5)
Table 3. Nominal compositions in wt% and mol% (mol% are indicated in parentheses) of the
three series of samples prepared for this study (series S10, S20, and S30 with 10, 20, and 30