HAL Id: inria-00528985
https://hal.inria.fr/inria-00528985
Submitted on 23 Oct 2010HAL is a multi-disciplinary open access
archive for the deposit and dissemination of sci-entific research documents, whether they are pub-lished or not. The documents may come from teaching and research institutions in France or abroad, or from public or private research centers.
L’archive ouverte pluridisciplinaire HAL, est destinée au dépôt et à la diffusion de documents scientifiques de niveau recherche, publiés ou non, émanant des établissements d’enseignement et de recherche français ou étrangers, des laboratoires publics ou privés.
Mayavi: 3D visualization of scientific data
Prabhu Ramachandran, Gaël Varoquaux
To cite this version:
Prabhu Ramachandran, Gaël Varoquaux. Mayavi: 3D visualization of scientific data. Computing in Science and Engineering, Institute of Electrical and Electronics Engineers, 2011, 13 (2), pp.40-51. �10.1109/MCSE.2011.35�. �inria-00528985�
Mayavi: a package for 3D visualization of scientific
data
Prabhu Ramachandran ∗ Ga¨el Varoquaux †‡
Introduction
Mayavi is an open-source, general-purpose, 3D scientific visualization package. It seeks to pro-vide easy and interactive tools for data visual-ization that fit with the scientific user’s work-flow. For this purpose, Mayavi provides several entry points: a full-blown interactive application; a Python library with both a MATLAB-like inter-face focused on easy scripting and a feature-rich object hierarchy; widgets associated with these objects for assembling in a domain-specific ap-plication, and plugins that work with a general-purpose application-building framework.
In this article, we present an overview of the var-ious features of Mayavi, we then provide insight on the design and engineering decisions made in implementing Mayavi, and finally discuss a few novel applications.
What is Mayavi?
A unique integration with a scientific workflow Mayavi is unlike most other visualization tools through a combination of factors. First of all, the Mayavi project avoids domain-specific cases and strives to build reusable, general-purpose, ab-stractions. This is important since different re-search fields often need to solve similar problems. Second, Mayavi exposes tools and objects that fit closely with a naive user’s expectation, and also allows expert users to handle complex visualiza-tions. Finally, and most important, the project is more than just a visualization library since it pro-vides, in addition to the library, widgets, dialogs, plugins, and an application, to fit in various as-pects of the scientific workflow. A rich interactive
∗Department of Aerospace Engineering, IIT Bombay,
Mumbai, INDIA - 400 076
†Parietal team, INRIA Saclay Ile de France, Parc Orsay
Universit´e, 4 rue J. Monod, 91893 Orsay FRANCE
‡NeuroSpin/CEA Saclay, Bˆat 145, 91191 Gif-sur-Yvette
FRANCE
graphical application, along with simple but full-featured scripting is important because visualiza-tion of complex datasets is best done interactively, as the user can examine the data visually, tweak parameters and build the visualization to suit the data. In addition, to enable batch processing and non-interactive use, Mayavi visualizations can be driven without a user interface. The use of the Python language is central to answering multi-ple scientific use cases, as it is a powerful, yet easy-to-learn, programming language [1]. Thanks to a growing number of high-quality scientific li-braries [2, 3], Python has recently garnered sig-nificant mind-share among scientists. Indeed, it lends itself to interactive use with simultaneous plotting [4, 5] that is ideal for scientific and data-processing development. Mayavi brings power-ful 3D scientific data visualization to this tightly-integrated environment.
There are several excellent general-purpose 3D visualization programs that expose high-quality Python interfaces, such as ParaView [6] or VisIt [7]. Unlike Mayavi, these tools support parallel data visualization as well as 4D datasets. However, Mayavi differs from these tools by a tighter integration with the workflow of a typical scientist using Python for numerical computation: it uses familiar data structures and exposes all its graphical user interfaces as components . First of all, Mayavi operates naturally on numpy arrays, the core data structure used in the main scientific Python projects. As detailed below, the entire VTK API is wrapped with implicit conversion be-tween VTK arrays and numpy arrays and the mlab interface provides convenient functions to visu-alize 3D data described by numpy arrays. This, along with the fact that Mayavi integrates well with IPython, makes it highly convenient for in-teractive work. Second, Mayavi relies on a reflex-ive object model in which each object can be used as a component to create custom dialogs that
bed a Mayavi visualization. (ETS [8]) enables users to create rich, interactive scientific applica-tions that support 2D and 3D plotting requiring only the knowledge of Python and object-oriented programming. Thus Mayavi fills a valuable need in the scientific computing ecosystem.
Powerful underlying technologies
Mayavi is part of the ETS [8] and builds upon a powerful stack of existing libraries. In this section we provide a very brief overview of these.
VTK : The Visualization ToolKit [9] is one of the best, actively-developed, general-purpose, open-source, visualization and graphics li-braries available.
Numpy : The workhorse of scientific comput-ing with Python is the numpy array structure. This multidimensional numerical array trans-forms Python into a high-level array language, similar to MATLAB. It is used as a common data container in most scientific libraries and projects relying on Python.
Traits : The Traits library
(http://code.enthought.com/projects/traits), is the cornerstone of the ETS. Traits extend Python object attributes and provide an elegant mechanism for attribute initialization, validation, delegation, notification (efficient callbacks on attribute modification), and visu-alization (through dialogs using wxPython or Qt4). Henceforth, we refer to an object with traits as a “traited object”.
TVTK : The Traited VTK library (TVTK) is an automatically generated wrapper of VTK com-bined with Traits This is done by wrapping VTK-Python objects and providing a traits-enabled API with a more “Pythonic” feel . All C++-style getters and setters are replaced by traits. VTK has its own C++-based ar-ray structures, and the VTK-Python bindings require tedious manipulations to copy or refer-ence the data from numpy arrays to VTK ar-rays. TVTK provides a seamless API where VTK arrays are converted dynamically from and to numpy arrays, using a view of the same memory where possible. In addition, because of the use of Traits, all TVTK objects pro-vide a default dialog to edit their properties. TVTK is thus a very powerful object
hierar-chy that maps with some simple rules to VTK and forms the foundation of Mayavi.
TraitsUI/Envisage : The user interface of the end-user application relies entirely on Traits and optionally on Envisage. Envisage is an application-building framework, `a la the Eclipse framework , which is used for the ap-plication. At its core, Envisage is a system for defining, registering, and using plugins. Both Traits and Envisage can use wxPython or PyQt as a backend. Thus Mayavi can be used with both toolkits, although currently the wxPython backend is more developed and thus more mature.
Packaging and licensing
A simple pipeline model for visualization VTK relies on an elaborate pipeline model that is assembled to create a visualization. In an effort to to the user, Mayavi exposes a basic pipeline inter-face: data is obtained from a data source, and the user can add visualization modules to display the data in various ways, or filters to modify the data before eventual visualization. Mayavi connects the various components of the pipeline and, to an extent, also takes care of which components can be inter-connected. For example, a cloud of scat-tered points cannot be visualized with a grid plane since there is no fixed grid for these points. The different sources, modules and filters are traited objects that all have associated dialogs and meth-ods that expose the underlying TVTK objects as much as possible without requiring a detailed knowledge of VTK. The Mayavi pipeline collapses together several elements of a VTK pipeline, for instance the Mayavi modules are made of VTK mappers, actors, and eventually widgets or even filterswhen their use helps representing the data. Finally, although loops in the pipeline are possi-ble, Mayavi the pipeline as a tree rather than a graph (see Figure 1), to facilitate its manipula-tion, both through the interactive user interface, and programmatically.
History of the project
Mayavi was created in 2001 [10] by P. Ramachan-dran as an end-user application for scientific visu-alization. The name is a Sanskrit word meaning “magician”. The application was appreciated for its ease of use and interactivity. However, it was
not easy to script from Python. During 2004– 2005, Enthought Inc. hired P. Ramachandran to write TVTK [11] and start work on a new ver-sion of Mayavi. The new verver-sion, “Mayavi2” [12], uses the tools developed at Enthought to focus on reuse and embedding. In 2007, G. Varoquaux joined the project. The project is rapidly gaining features and documentation while the usability is improved based on user feedback. In early 2008, TVTK and Mayavi were each awarded FOSS In-dia awards.
Using Mayavi
Mayavi can be used in different ways, and as such has several entry points.
The mayavi2 application
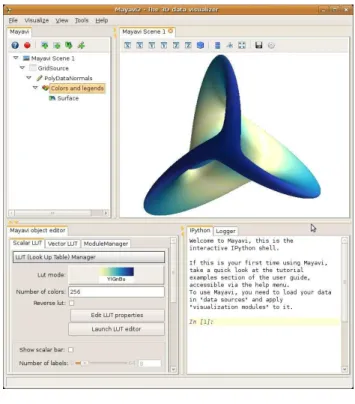
The interactive application, mayavi2, is an end-user tool that can be used without any program-ming knowledge. It provides an interface with menus and several panels to guide the user while creating a visualization (see Figure 1). As de-scribed earlier in the overview, Mayavi presents a simplified pipeline view of the visualization. Through the menus, data can be loaded from files, or created with predefined objects such as a lay-out of the Earth’s continents, parametric surfaces defining for example a Klein bottle, etc. Subse-quently, optional filtering may be performed on the data, and visualization modules are added to create the visualization.
The various pipeline components (sources, mod-ules and filters) appear on a tree view (see the left panel in Figure 1), and more can be added through menus and dialogs. In particular, contex-tual menus suggest to the user the filters or mod-ules that are applicable to a given data source. The pipeline may also be reorganized using drag-and-drop operations on the tree nodes. Objects selected on the pipeline view can be edited in an-other panel (left side of the bottom panel in Fig-ure 1) and modifications are immediately applied to the visualization. It is to be noted that al-though the pipeline shown in the Figure 1 is ex-tremely simple, more complex pipelines can also be setup.
While a raw VTK dataset is a versatile data struc-ture describing data embedded in a 3D space, a Mayavi source tries to expose to the user a sim-ple interface to importing data in Mayavi.
Sim-Figure 1: A view of the mayavi2 application showing the Mayavi logo: a Boy mathematical surface. On the bottom right, an interactive IPython prompt, for prototyping scripts or exploring objects, can be seen. On the upper left stands the tree representing the vi-sualization pipeline. It features a source, here a grid of points created by numpy arrays, a PolyDataNormal filter used to calculate normals of the surface for a smooth rendering, and the Surface module, with its corresponding module-manager node, used to change the colors and legend of the surface. The dialog below the tree can be used to modify the se-lected node, i.e. colors and legend properties in the present case.
ilarly, the Mayavi modules are a single point of entry to changing all the properties of an object displayed on the visualization, and gather all the VTK sub-objects in one object and one dialog. An exception to this rule is that the color maps and the legends can be shared between modules, and thus can be represented as a separate node in the pipeline.
Mayavi offers through its primary tree-based in-terface only a limited subset of VTK’s filters, and the Mayavi sources cannot cover all possible ways to create VTK datasets. This is why Mayavi of-fers a UserDefined filter to plug in almost any VTK filter in the Mayavi pipeline by specifying its name, and a VTKDataSource class to create a Mayavi source from any VTK dataset.
The entire visualization can be saved to disk in
a Mayavi-specific format although, this is one as-pect of Mayavi that needs to be more robust. Al-ternatively, the data generated at any point of the pipeline can be saved to VTK files. .
The mayavi2 application has a couple of features to help create Python scripts from a visualiza-tion. First, the application displays an interac-tive Python shell, where Python commands can be entered for immediate execution. The scripting API described later in this article can be used to create or modify visualizations. Objects dragged from the pipeline tree to the shell appear in it as Python objects for exploration or modifica-tion. Second, the pipeline tree view features a record button (the red button on the toolbar in the left panel of Figure 1). When the record mode is turned on, any modification to objects in the pipeline, or any object added to the pipeline auto-matically generates the necessary lines of Python code to reproduce the action. Fully-functional Python scripts are thus created when the record mode is turned on before adding any object to the pipeline, although the generated code is not al-ways the simplest possible code. In addition, the record mode is also an extremely valuable learning tool for scripting Mayavi or TVTK objects. In-deed, VTK is a very rich visualization library and Mayavi’s object hierarchy can be deep and com-plex. Thus, it can be hard to find the method or attribute corresponding to a given feature. Con-sequently, the record feature is highly convenient even for experienced VTK users.
An extensive user manual is shipped with Mayavi [13] and is accessible from the ap-plication. The user guide is rendered using Sphinx (http://sphinx.pocoo.org/) and em-beds a search bar and an index.
Simple Python scripting
As we have seen, Mayavi can be used in a fully-interactive manner, by a non-programmer, using the mayavi2 application. However, Mayavi can also be used through a simple and yet power-ful scripting API, providing a workflow similar to that of MATLAB or Mathematica. Many sci-entists use Python for their computational work. Visualization is a very important component of such work and is most effective when used inter-actively, as an exploratory and debugging tool. A good example of this is the typical use of mat-plotlib [5] and IPython [4].
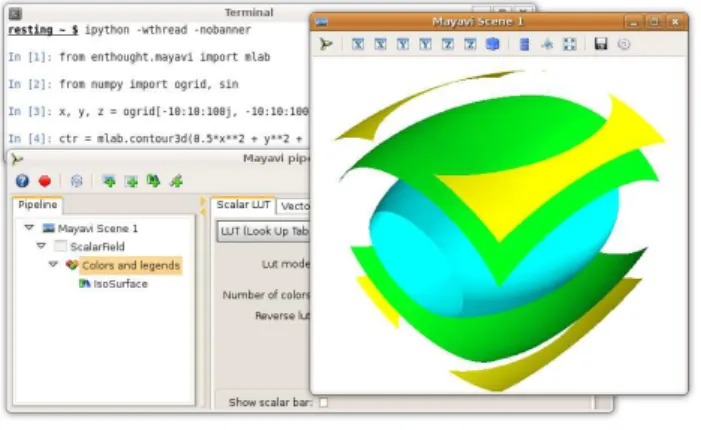
Mayavi’s mlab scripting interface is a set of Python functions that work with numpy arrays and draw some inspiration from the MATLAB and matplotlib plotting functions. It can be used interactively in IPython, or inside any Python script or application. The following example gen-erates iso-contours of a mathematical function, sampled on a regular grid. The resulting visu-alization can be seen in Figure 2.
from enthought.mayavi import mlab from numpy import ogrid
x, y, z = ogrid[-10:10:100j, -10:10:100j, -10:10:100j] ctr = mlab.contour3d(0.5*x**2 + y**2 + 2*z**2)
mlab.show()
Simple plotting commands operating on numpy arrays, such as mlab.contour3d, used in the previous example, build a complete visualiza-tion pipeline. These simple commands hide the pipeline model from the user, for simple use cases. They accept a large number of extra arguments to control the properties of the visualization cre-ated. In addition, as they return the Mayavi mod-ules created, more properties can be changed by modifying their attributes.
Alternatively, mlab offers a direct control of the Mayavi pipeline through separate creation of sources, filters and modules. Thus the call to mlab.contour3din the previous example can be replaced by two commands, one to create a source object from the regularly-spaced volumetric data in a numpy array, and a second to apply an iso-surface module on it:
src = mlab.pipeline.scalar_field(0.5*x**2 + y**2 + 2*z**2) ctr = mlab.pipeline.iso_surface(src)
Manually populating the pipeline requires an un-derstanding of the pipeline model. It is also more powerful as it gives access to a wider range of possibilities through custom-made pipelines. The names of the mlab.pipeline functions to create objects are lower-case-with-underscores versions of the camel-case names of the classes represented, as they appear by default in the pipeline view. Thus, going from a pipeline built interactively to a script is very easy.
Although the window used to display visualiza-tion is very simple, the full power of Mayavi is still available. Clicking the button with the Mayavi logo on the left of the visualization-window tool-bar displays a dialog containing the same pipeline tree view as in the Mayavi application (see
Fig-Figure 2: Working with Mayavi in IPython. The terminal on the background runs the IPython ses-sion from which the visualization window on the foreground (right) was created. The pipeline dialog editing the different visualization objects was cre-ated by clicking on the button with the Mayavi icon on the left of the visualization window’s toolbar.
ure 1). All the interactive functionality of the mayavi2 application is accessible in this dialog: the buttons on the toolbar provide access to help, script recording, or object-creation. Clicking on the pipeline nodes creates dialogs that allow mod-ification of the object properties. The pipeline can be populated and modified by the context menus accessible with a right-click on the nodes.
Animating data and building interactive dialogs Objects created by the mlab functions expose an mlab source attribute, which gives access to the numpy arrays used to create the dataset. Assign-ing new arrays to the mlab source triggers an update of the visualization. The name of the at-tribute one needs to modify on the mlab source object is the name given to the corresponding argument in the function signature documenta-tion, for instance the mlab.contour3d function signature is contour3d(scalars, ...), where scalarsis a 3D array. Thus, we can animate the contour object created previously by modifying in place the scalars it represents:
from time import sleep for i in range(1, 10):
sleep(1)
ctr.mlab_source.scalars = 0.5*x**2 + y**2 + i*z**2
In-place modifications are also useful when em-bedding a visualization in an interactive applica-tion. A Mayavi scene can be displayed as part of a traits-based user interface. The following exam-ple displays a dialog visualizing a 1D parametric
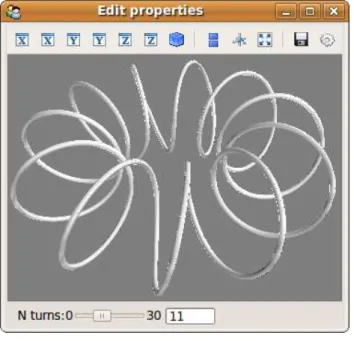
function embedded in a 3-Dimensional space as a curved line. The mathematical curve, defined by the curve function, takes one parameter – the number of minor rotations in the transverse di-rection. The dialog (Figure 3) enables the modi-fication of this parameter with an immediate vi-sualization of the results:
from numpy import linspace, pi, cos, sin
from enthought.traits.api import HasTraits, Range, Instance, \ on_trait_change
from enthought.traits.ui.api import View, Item, HGroup from enthought.mayavi.core.ui.api import SceneEditor, \
MlabSceneModel def curve(n_turns):
phi = linspace(0, 2*pi, 2000)
return [ cos(phi) * (1 + 0.5*cos(n_turns*phi)), sin(phi) * (1 + 0.5*cos(n_turns*phi)), 0.5*sin(n_turns*phi)] class Visualization(HasTraits): n_turns = Range(0, 30, 11) scene = Instance(MlabSceneModel, ()) def __init__(self): HasTraits.__init__(self) x, y, z = curve(self.n_turns) self.plot = self.scene.mlab.plot3d(x, y, z) @on_trait_change(’n_turns’) def update_plot(self): x, y, z = curve(self.n_turns) self.plot.mlab_source.set(x=x, y=y, z=z)
view = View(Item(’scene’, height=300, show_label=False, editor=SceneEditor()),
HGroup(’n_turns’), resizable=True) Visualization().configure_traits()
In the above code example, the Visualization class defines a few traits including the scene trait which is an instance of MlabSceneModel. The configure traits() call at the end of the code creates a dialog representing the object, the lay-out of which is given by the view defined at the end of the class. This view exposes the scene trait using a SceneEditor in the dialog, and the n turns attribute as a slider. On creation of the Visualization object, the curve is plotted in the embedded scene with the plot3d mlab call. When the n turns attribute is modified, the update plot method is called, curve data is re-computed, and the plot object is modified using the mlab source attribute.
In general, the different properties of the objects used in visualizations, such as sources, filters, modules, or even the scenes, can be modified in a script, with instantaneous or delayed update of the scene, by simply setting the corresponding trait. Moreover, the different dialogs that form
Figure 3: The dialog created by the code example. In addition to the interaction with the visualization, dragging the slider bar modifies the visualization in-teractively.
Mayavi, such as the tree view, or the dialog edit-ing an object, can be embedded in a user’s appli-cation. Callbacks between these different dialogs and the scene are already wired. As such, Mayavi forms more than a visualization library; it can be used as a set of interactive components to provide live visualization to a domain-specific application, requiring little knowledge of GUI programming or event-loops.
Embedding in existing applications
Although Traits is a very powerful tool for devel-oping interactive applications, most existing ap-plications are developed using a raw GUI toolkit. It is thus important to integrate the dialogs pro-duced from the code in the previous paragraphs in a non Traits-aware GUI. Traits has a wxPython and a Qt4 backend. While the configure traits method used in the above example to create the dialog creates a full wxPython application and starts the main event loop, the HasTraits class also provides an edit traits method that only creates and returns a panel or dialog. Below is an example showing how the Visualization class defined earlier, and the corresponding dialog, can be embedded in a wxPython application:
import wx
class MainWindow(wx.Frame):
def __init__(self, parent, id):
wx.Frame.__init__(self, parent, id, ’Mayavi in Wx’) self.visualization = Visualization()
self.control = self.visualization.edit_traits( parent=self, kind=’subpanel’).control self.Show()
app = wx.PySimpleApp()
frame = MainWindow(None, wx.ID_ANY) app.MainLoop()
In the above example, the edit traits method is passed the wxPython frame into which the dialog is embedded. The control trait of the object pro-duced by the edit traits call is the wxPython object containing the widget. Similarly, dialogs can be embedded in a PyQt application, as de-tailed in the user guide.
Any Mayavi dialog can be embedded similarly in more complex applications. For instance the various Mayavi pipeline objects also provide an edit traits method to edit their properties. Thus, the work invested in developing powerful widgets for the Mayavi application, such as the pipeline tree view, is readily available to the ap-plication builder.
Extending the mayavi2 application
Instead of creating a new application, one can extend the already-powerful mayavi2 application by adding to it custom functionality or domain-specific elements. The application is built by inte-grating the 3D visualization provided by Mayavi with other functionality, such as a Python shell, via Envisage plugins. Using the same mechanism, one may put together other applications or extend the mayavi2 application. A discussion of the En-visage application-building framework is beyond the scope of this article.
In addition, Mayavi has a mechanism to regis-ter new types of data sources, filregis-ters or mod-ules. These are automatically added to the var-ious menus and the mlab.pipeline interface. A common use case is to add domain-specific file readers or visualization modules. For example, the following code can be placed in a module im-ported in ~/.mayavi2/user mayavi.py to define a reader using numpy to load arrays stored in a text file:
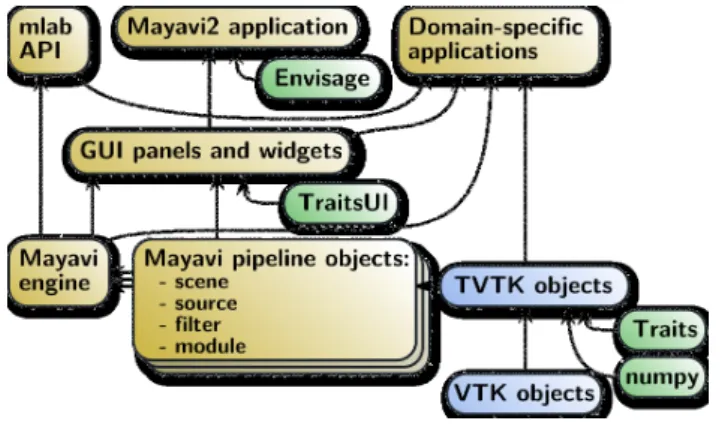
Figure 4: Architecture diagram of Mayavi. The green nodes are external Python modules, the blue nodes are the VTK-based object hierarchy, and the yellow ones form the Mayavi functionality.
from enthought.mayavi.core.api import registry, \ SourceMetadata, PipelineInfo from enthought.mayavi.sources.api import ArraySource import numpy as np
def array_reader(fname, engine):
return ArraySource(scalar_data=np.loadtxt(fname)) registry.sources.append(SourceMetadata(
factory = __name__ + ’.array_reader’, menu_name = "Array text files", extensions = [’txt’], wildcards = ’TXT files (*.txt)|*.txt’, output_info = PipelineInfo(datasets=[’image_data’], attribute_types=[’any’], attributes=[’any’]), ))
Of course, proper use of Mayavi as a platform for domain-specific applications requires a good un-derstanding of the finer details of Mayavi, which is beyond the scope of this article, but is detailed in the user manual [13].
Mayavi architecture and software design
In this section we provide a broad overview of the architecture and software design of Mayavi.
Architecture overview
The general software architecture of Mayavi is summarized in the diagram on Figure 4. The vi-sualization layer of Mayavi relies on TVTK ob-jects. The Mayavi pipeline objects use TVTK objects and have methods that help wire them together and simplify building the VTK pipeline. A central object, the Mayavi Engine, manages all the pipeline objects making up the visualization. The set of pipeline objects and the engine form the core of the Mayavi functionality. The mlab
scripting API controls the engine to create visu-alizations. As all objects rely on the Traits li-brary, UI panels or widgets can be created using the TraitsUI package. The different panels, as well as the core functionality of Mayavi, can be combined with other Envisage plugins to create applications such as the mayavi2 application.
The Engine as a pipeline warden
The Mayavi engine maintains a tree structure of pipeline objects. Each pipeline object main-tains references to its parents and children, and exposes a list of inputs and outputs. The out-put list contains the TVTK datasets flowing be-tween the pipeline elements. The input objects are Mayavi pipeline objects. The Mayavi pipeline objects have callbacks to rewire the underly-ing VTK pipeline if their inputs change. They also feature two events, pipeline changed and data changed, which are propagated down the pipeline to update it. The engine manages the life-cycle of the pipeline objects, i.e. it manages their addition and removal.
The pipeline of the iso-surface example intro-duced with the mlab API in the beginning of the article can be explicitly built with the following code:
from enthought.mayavi.core.api import Engine
from enthought.mayavi.sources.api import ArraySource from enthought.mayavi.modules.api import IsoSurface from enthought.pyface.api import GUI
from numpy import ogrid
x, y, z = ogrid[-10:10:100j, -10:10:100j, -10:10:100j] engine = Engine() engine.start() engine.new_scene() src = ArraySource(scalar_data=(0.5*x**2 + y**2 + 2*z**2)) engine.add_source(src) engine.add_module(IsoSurface()) GUI().start_event_loop()
In the above, the engine manages the connec-tion between the source and modules internally: it maintains the context of the visualization. For instance the new scene method can be overridden in a subclass to create an embedded scene, as done in the mayavi2 application, or a separate window, as when using mlab in IPython. Other subclasses for off-screen rendering are also available. In ad-dition, the engine provides context-dependent ac-tions which can be useful to drive an interactive application in a manner similar to spreadsheet scripting. In the above, the add module call
implicitly adds the IsoSurface instance to the ArraySource source src. It is also possible to build the above pipeline explicitly by selecting and connecting the different objects rather than delegating the task to the engine:
scene = engine.current_scene
src = ArraySource(scalar_data=(0.5*x**2 + y**2 + 2*z**2)) scene.add_child(src)
src.add_child(IsoSurface())
We note that the Engine is not global. While the mayavi2application and mlab provide default en-gines which suffice for most of the use cases, a user can create many different engines for differ-ent needs. As a result, the scope, or context, of the different visualizations and actions can be lim-ited and controlled. This isolation is important when one wishes to avoid side-effects in a large application. It also makes Mayavi much easier to reuse and test. For example, if the Engine was global then any changes to it in a test suite would influence other tests. However, since one may cre-ate as many engines as one desires it is easy to write tests that avoid unnecessary side-effects.
A central registry to avoid duplication
Mayavi provides a large, and growing, list of pipeline objects. They are exposed through many different interfaces, both graphical, and program-ming APIs. In order to avoid code duplication, all the different sources, filters, and modules are specified in a central registry along with informa-tion describing their funcinforma-tionality. The metadata information in the registry is used to generate the different menus of the user interfaces, as well as many of the mlab.pipeline functions, thus en-forcing consistency throughout Mayavi. A sam-ple of this information can be seen in the examsam-ple provided in sectionwhere Mayavi is extended with a new source by adding it to the registry.
Model-view separation
As much as possible, Mayavi uses a reactive pro-gramming style employing callbacks on trait mod-ifications. UIs are created using representations of the objects’ traits. This programming style al-lows for a very clean separation of the model from the view. The model can be fully described by the traits of all the objects on the pipeline. For exam-ple, the script-recording functionality described earlier is implemented in large part by tracking the modifications to these traits. Mayavi’s use
of the Model View Controller (MVC) design pat-tern [14] is not complete and there is some mixing of the view and model. However, while this can be reduced in the future, we believe that the de-sign is already very reusable, offering us most of the advantages of MVC.
The “message-passing” style that replaces method calls by trait assignments is thread-friendly and can be used to avoid dealing with GUI event loops. The code updating the UI for instance is not exposed to the user. As we mostly rely on Traits for views, these are defined in a declarative way (as in the interactive dialog example above). Consequently, no application logic can be found in the view-related code. This is very important for a clean scripting API and also enables scripts to run in a headless (off-screen) mode with no modifications .
Testing and scriptable APIs
As seen above, Mayavi strives to be highly reusable in a variety of contexts for the user and developer. One of the development strategies that really helped make the API reusable and the code reliable is our focus on being able to script the API as much as possible. This was achieved in part by resorting to unit testing, integration test-ing, and some Test-Driven Development (TDD) [15]. Testing and good example scripts forced us to make the API highly reusable and resulted in increased reliability and clean code. This experi-ence corroborates with the advantages claimed by practitioners of TDD.
Summary of key design choices
We believe some architectural decisions are key to the success of Mayavi’s reusability:
Multiple abstraction layers, as summarized by Figure 4. This layered functionality enforces separation
of concerns and enables sharing code between different entry points or APIs to address various use cases.
A central, well-defined object: the Engine. It coordinates the visualization, provides a context, and is thus important in establishing a consistent view of the application, both in the Mayavi code, and in the scripting APIs. In addition, this central object helps avoiding globals. We note that any number of Engines
can be created and used simultaneously, thus the Engine does not preclude the possibility of data-parallel execution.
The use of Traits. Traits’ powerful object model leads to a good design through reactive pro-gramming and strong model-view separation, in addition to providing multiple-backend UIs with little effort.
Model/view separation and loose coupling. It is well known that GUI-related code should be well separated from the core application logic. However, in addition to this, we find that all helper-code unrelated to the core functionality which caters to common end-user needs, such as provided by the mlab API, should also be separate from the core.
Automatically-created objects and functions. The TVTK wrapper code is entirely automat-ically generated. Large parts of the UI-related boilerplate code, and some of the APIs, are auto-generated. This reduces duplication and thus makes the interfaces more consistent, and the code easier to maintain.
Focus on the API. Striving for a simple API greatly improves the developers mental rep-resentation of the library and application’s model, and as a result its architecture. The API should answer common use-cases and be consistent across the various needs. Interac-tion and feedback from users, whose needs sometimes differ from that of the developers, has proven priceless.
Testing and scripting. Unit tests, TDD and ex-ample scripts for users are invaluable in creat-ing a truly reusable tool. These practices are also a great way to notice unwanted tight cou-pling in the object model.
Some real-word applications
Weather visualization using Mayavi
The FloSolver division at NAL (National Aerospace Laboratories, Bangalore) uses Mayavi to visualize data produced by their weather mod-eling code which is used to primarily forecast the monsoon in India. Mayavi is used both as a display device and more importantly to help re-fine the weather models. Data generated from weather simulations is rendered interactively us-ing Mayavi scripted from Python to automate
Figure 5: Four Mayavi applications controlled via the network from a central program providing a syn-chronized view.
many mundane tasks. The automatic script-ing mode of Mayavi is used to record UI ac-tions and generates human readable Python code. This code is then hand-edited to produce vi-sualizations of the weather data. Thus, with-out a direct knowledge of Mayavi’s internals or even a good knowledge of Python, the scien-tists at NAL are able to generate fully-working Python scripts and tailor them to their needs. For the interactive display of the different atmo-spheric fields, each field is displayed on a separate computer running a Mayavi script. The cam-era position of each Mayavi application is con-trolled by an in-house OpenGL application used for display of cloud data obtained from satel-lite images. In order to do this, we wrote a simple TCP and UDP server program that lets a user send Python statements across the net-work which are interpreted by the running Mayavi application. We used the excellent Twisted (http://twistedmatrix.com/trac/) library for this. The size of the resulting server module was about 90 lines of code (without the documenta-tion/comments). Using the server required two additional lines of code in the existing scripts at NAL. The hardware setup at NAL is shown in Figure 5. The left-most screen shows the appli-cation controlling the view of the 4 other Mayavi applications via the network. The right side is a visualization wall consisting of 4 separate LCD panels put together as one. This would not be possible but for the powerful libraries available with Python.
Web-browser based usage of Mayavi
In a recent development, O. Certik and P. Ra-machandran worked together to setup a Sage (http://www.sagemath.org) notebook working with Mayavi in order to perform visualizations on the web. Sage provides, among many other things, a powerful environment to do mathemat-ics on the web through a notebook interface. This interface essentially provides a powerful Python-capable web page where users can interact with a Python interpreter, and embed the results along with images and text seamlessly from a browser window.
In order to have Mayavi working in the Sage notebook, we built VTK with support for us-ing Mesa’s (http://www.mesa3d.org) OSMesa li-brary for pure off-screen rendering. Then by using the existing support in Mayavi for off-screen rendering we are able to render im-ages and generate X3D files, displayed interac-tively by the Sage notebook. The web page http://lab.femhub.org/home/pub/39 demon-strates the resulting Sage notebook. The page uses Mayavi’s mlab interface to generate a visu-alization and produce an X3D file that may be visualized interactively using a browser plugin.
Conclusions
There is a growing trend of moving more and more computational code to high-level environments. Python is an increasingly popular high-level lan-guage for scientific computing because it has the potential to unite a variety of modules into a ho-mogeneous environment.
Mayavi provides a rich and powerful 3D data visu-alization package that tightly integrates the vari-ous aspects of scientific computing and scientific-application development in Python. It strongly focuses on being reusable. In particular, it is well-suited to applied science and engineering prob-lems for which building custom visualization tools is an important challenge. It tries to match the different scientific computing work flows: interac-tively with an end-user application, in scripts, or in custom applications and also for pure off-screen rendering. The visualization model is consistent throughout the various entry points and the in-teractive application can be used to prototype visualizations that can be easily converted into code embedded in scripts or applications. Mayavi dovetails nicely into a rich set of scientific tools
using Python as a natural, easy to use, 3D visu-alization environment.
References
[1] Computing in Science and Engineering special is-sue on scientific computing with Python, vol. 09, no. 3, May/June, 2007.
[2] T. E. Oliphant, “A Guide to NumPy”, Trelgol publishing, http://numpy.scipy.org, 2006. [3] E. Jones, T. E. Oliphant, P. Peterson, “SciPy:
Open source scientific tools for Python”, http://www.scipy.org, 2001.
[4] F. Perez, B. E. Granger, “IPython: A System for Interactive Scientific Computing”, Computing in Science & Engineering, 2007.
[5] J. D. Hunter, “Matplotlib: A 2D Graphics Envi-ronment”, Computing in Science & Engineering, 2007.
[6] Andy Cedilnik, Berk Geveci, Kenneth Moreland, James Ahrens, and Jean Favre, “Remote Large Data Visualization in the ParaView Framework”, In Eurographics Parallel Graphics and Visualiza-tionpp 163–170, May 2006.
[7] Hank Childs, Eric Brugger, Kathleen Bonnell, Jeremy Meredith, Mark Miller, Brad Whitlock, Nelson Max, “A Contract Based System For Large Data Visualization”, 16th IEEE Visualiza-tion 2005, pp. 25, 2005.
[8] Enthought, Inc, Austin, “Enthought Tool Suite”, http://www.enthought.com/products/ets.php [9] W. , K. Martin, W. Lorensen, “The Visualization
Toolkit”, Kitware, 4th edition, 2006.
[10] P. Ramachandran, “MayaVi: A free tool for CFD data visualization.” In 4th Annual CFD Sympo-sium, Bangalore, India. Aeronautical Society of In-dia, August 2001.
[11] P. Ramachandran, “TVTK A Pythonic VTK”, EuroPython Conference Proceedings, Goteborg, Sweden June 2005.
[12] P. Ramachandran. “MayaVi2: The next genera-tion”, EuroPython Conference Proceedings, Gote-borg, Sweden June 2005.
[13] P. Ramachandran, G.
Varo-quaux, “Mayavi Users Guide”,
http://code.enthought.com/projects/mayavi, 2008.
[14] E. Gamma et al, “Design Patterns - Elements of Reusable Object-Oriented Software”, Addison Wesley, 1994.
[15] K. Beck, “Test-Driven Development by Exam-ple”, Addison Wesley, 2003.