HAL Id: hal-01974429
https://hal.archives-ouvertes.fr/hal-01974429
Submitted on 22 Jan 2019
HAL is a multi-disciplinary open access
archive for the deposit and dissemination of
sci-entific research documents, whether they are
pub-lished or not. The documents may come from
teaching and research institutions in France or
abroad, or from public or private research centers.
L’archive ouverte pluridisciplinaire HAL, est
destinée au dépôt et à la diffusion de documents
scientifiques de niveau recherche, publiés ou non,
émanant des établissements d’enseignement et de
recherche français ou étrangers, des laboratoires
publics ou privés.
From depth to regional spatial genetic differentiation of
Eunicella cavolini in the NW Mediterranean
Almudena Cánovas-Molina, Monica Montefalcone, Giorgio Bavestrello,
Mauatassem Billah Masmoudi, Anne Haguenauer, Pachka Hammami, Lamya
Chaoui, Mohammed Kara, D. Aurelle
To cite this version:
Almudena Cánovas-Molina, Monica Montefalcone, Giorgio Bavestrello, Mauatassem Billah Masmoudi,
Anne Haguenauer, et al.. From depth to regional spatial genetic differentiation of Eunicella cavolini
in the NW Mediterranean. Comptes Rendus Biologies, Elsevier Masson, 2018, 341 (9-10), pp.421-432.
�10.1016/j.crvi.2018.09.002�. �hal-01974429�
1
From depth to regional spatial genetic differentiation of Eunicella cavolini in the NW
1
Mediterranean
2
Almudena Cánovas-Molina1, *, Monica Montefalcone1, Giorgio Bavestrello1, Mauatassem Billah
3
Masmoudi2, 3, Anne Haguenauer3, Pachka Hammami3, Lamya Chaoui2, Mohammed Hichem Kara2
4
and Didier Aurelle3,4*
5 6
1 DiSTAV, Dipartimento di Scienze della Terra, dell'Ambiente e della Vita, Università di Genova,
7
Corso Europa 26, 16132 Genova, Italy. 8
2 Laboratoire Bioressources Marines, Université d’Annaba, Badji Mokhtar, BP 230, Oued Kouba,
9
23008, Annaba, Algeria. 10
3 Aix Marseille Univ, Avignon Université, CNRS, IRD, IMBE, Marseille, France
11
4 Aix Marseille Univ., Université de Toulon, CNRS, IRD, MIO UM 110 , 13288, Marseille, France
12 13
*Corresponding authors: Tel.: +33 486 09 06 22. 14
E-mail addresses: [email protected] (A. Cánovas-Molina), [email protected] 15
(D. Aurelle). 16
2 Abstract
17
Connectivity studies in the marine realm are of great importance to understand the evolutionary 18
potential of populations in a context of growing pressures on the marine environment. Here, we 19
investigated the effect of the local, regional and depths spatial scale on population genetic structure 20
of the yellow gorgonian Eunicella cavolini, one of the most common octocoral species of the 21
Mediterranean hard-bottom communities. This species, along with other sessile metazoans typical 22
of coralligenous ecosystems, plays an important role in supporting biodiversity, but is also 23
impacted by direct and indirect consequences of human activities, such as physical destruction or 24
mortality events due to thermal anomalies. Samples were taken from 15 sites located in the 25
Ligurian Sea (NW Mediterranean) in two adjacent regions 100s kilometres apart, i.e. from the areas 26
of Marseille (France) and Portofino (Genoa, Italy), and were analyzed using six microsatellite loci. 27
A pattern of isolation by distance was observed at the regional as well as the local scales. Although 28
E. cavolini showed less genetic structure than other Mediterranean octocorallian species, we 29
observed a significant genetic differentiation between populations few kilometres apart. A low 30
genetic differentiation was also observed between shallow and deep populations. The occurrence of 31
genetically differentiated populations of E. cavolini at the scale of kilometres has important 32
consequences for the management of this species and of the associated communities. 33
34
Key-words: Eunicella cavolini, gorgonian, connectivity, spatial scale, Mediterranean, genetic 35
structure. 36
3 1. Introduction
37
In a context of growing pressures affecting the marine environments, estimating connectivity 38
among populations is essential since the scale of larval dispersal is crucial for understanding 39
species reorganization and populations evolution after large-scale disturbances (Bellwood et al., 40
2004; Salm et al., 2006). Size and interconnectivity of populations are important parameters to 41
estimate for conservation strategies, since small and isolated populations are vulnerable to 42
inbreeding depression, limited spread of beneficial alleles (Alleaume-Benharira et al., 2006). and 43
loss of genetic diversity, which might reduce their evolutionary potential and increase their risk of 44
extinction (Saccheri et al., 1998). Population genetics describes connectivity by comparing allele 45
frequencies among spatially discrete subpopulations. High levels of genetic similarity between 46
populations can indicate gene flow over time, usually through larval dispersal, whereas significant 47
differentiation between populations can correspond to significant and persistent barriers to larval 48
exchange. Nevertheless, the observed level of genetic differentiation depends on the interaction 49
between gene flow, genetic drift and mutation (depending on the time scale or molecular markers). 50
For most benthic marine species with complex life cycles, the exchange of individuals among 51
populations occurs primarily through the pelagic larval stage (Cowen and Sponaugle, 2009). These 52
exchanges depend on biotic and abiotic factors including spawning outputs, larval dispersal, habitat 53
availability, hydrodynamics and trophic interactions (Padrón and Guizien, 2015; Pineda, 2000). 54
Evidence from direct and indirect approaches using geochemical and genetic techniques suggests 55
that the genetic structure of marine populations, while often low, ranges from fully open to fully 56
closed (Cowen and Sponaugle, 2009). 57
Understanding the scale of population connectivity is fundamental for the development of suitable 58
conservation strategies and for the design of marine reserves (Almany et al., 2009; Palumbi, 2004; 59
Shanks et al., 2003). Decisions predicated on the assumption that larvae disperse at long distance 60
may lead to erroneous actions if this assumption is wrong (Cowen et al., 2000). Studies regarding 61
connectivity conducted in the Mediterranean Sea showed the existence of different patterns of 62
genetic differentiation, ranging from complete panmixia to an east–west or north–south genetic 63
Commenté [DA1]: c’est un essai, à voir si c’est mieux?
4 partitioning. These findings warn against any generalization based on the presently available 64
information and strongly indicate the need to obtain genetic connectivity data from a wider array of 65
species, including keystone species such as habitat formers as well as rare or threatened species 66
(Paterno et al., 2017). 67
Among the benthic sessile invertebrates of the Mediterranean, gorgonian octocorals play an 68
important role, contributing to the enhancement of the overall structural complexity, biomass, and 69
species diversity of habitats by their three-dimensional growth pattern (Ballesteros, 2006; Gili and 70
Ros, 1985; True, 1970). Furthermore, organisms living in habitats characterized by the presence of 71
gorgonian corals may experience a sort of buffer zone where environmental alterations occur more 72
slowly and within narrower ranges with respect to the surrounding ‘unforested’ environment (Ponti 73
et al., 2014). 74
The slow population dynamics of gorgonians makes them susceptible to a wide range of direct or 75
indirect anthropogenic stressors: mechanical damage (mainly caused by fishing and unregulated 76
recreational diving), pollution and mucilaginous algal aggregates (Bavestrello et al., 1997, Coma et 77
al., 2004; Mistri and Ceccherelli, 1996), biological invasions (Cebrian et al., 2012), bacterial 78
pathogens and mass mortality events linked to thermal anomalies (Cerrano et al., 2000; Garrabou et 79
al., 2009). For example, during the 2003 mortality event, the yellow gorgonian Eunicella cavolini 80
was affected from the coasts of Provence in south-east France to the gulf of Naples in south Italy, 81
with a percentage of affected colonies reaching 50.8% (Garrabou et al., 2009). This species, along 82
with other anthozoans, is also impacted by other human pressures such as, for example, the side-83
effects of fisheries (Cánovas-Molina et al., 2016a; Topçu and Öztürk, 2015). Considering these 84
threats and the need to extend the knowledge on population dynamics and connectivity for 85
conservation and ecosystem-based management purposes, several studies have been performed on 86
the genetic structure of Mediterranean species from the coralligenous assemblages, most of them 87
on octocorals. These previous genetic studies revealed strong population genetic structure 88
potentially because of short-distance larval dispersal for some coralligenous species such as the red 89
coral Corallium rubrum (Abbiati et al., 2009; Boavida et al., 2016; Costantini et al., 2007a, b; 90
5 Ledoux et al., 2010), the red gorgonian Paramuricea clavata (Arizmendi-Mejía et al., 2015; 91
Mokhtar-Jamaï et al., 2011), the yellow gorgonian E. cavolini (Masmoudi et al., 2016), the only 92
symbiotic Mediterranean gorgonian Eunicella singularis (Constantini et al., 2016; Pey et al., 2013) 93
or the sponge Crambe crambe (Duran et al., 2004). Regarding E. cavolini, the first molecular study 94
gave little information on the genetic structure of this species because of a lack of informative 95
markers (Calderón et al., 2007). The use of microsatellite markers in E. cavolini allowed the 96
identification of different genetic clusters in the Mediterranean corresponding to the main 97
geographical regions, and with different levels of genetic diversity: the allelic richness of eastern 98
Mediterranean populations (i.e. from Turkey) was two-fold lower than in Algeria (Masmoudi et al., 99
2016). The genetic structure in the region of Marseille (France) indicated a differentiation between 100
most populations (Masmoudi et al., 2016). Although no differentiation was observed between 101
depths (between 20 m and 40 m depth) at a given site (Masmoudi et al., 2016), significant 102
differences in thermo-tolerance were demonstrated at the bathymetrical scale (Pivotto et al., 2015). 103
In the present work, we focused on the yellow gorgonian Eunicella cavolini (Koch, 1887), an 104
octocoral species widely distributed in the Mediterranean, which can be observed from less than 10 105
m to more than 100 m depth (Sini et al., 2015). The genetic structure of this species has been 106
studied mainly at the basin-wide Mediterranean spatial scale (Masmoudi et al., 2016). Definition of 107
the boundaries of Marine Protected Areas (MPAs) should consider the connectivity among habitats 108
for management and conservation of marine species (Palumbi, 2004), and this requires a more 109
precise study of connectivity at both the regional and the local spatial scales. In this sense, NW 110
Mediterranean offers an interesting context for genetic structure studies at different spatial scales 111
where the yellow gorgonian forms populations from 15 m depth reaching here the maximum 112
densities of the Mediterranean sites studied by Sini et al. (2015). The absence or low genetic 113
differentiation between shallow and deep E. cavolini observed at Marseille (SE France) is of great 114
importance considering the impact of climate change and the possibility of exchanges between 115
depths with different thermal conditions (Pivotto et al., 2015), and it should be tested in other areas 116
as well. Located 300 km apart in the same Ligurian Sea, Portofino (NW Italy) offers a perfect 117
6 location for the genetic study of Eunicella cavolini populations at regional, local and depth scale. 118
Given the lack of information on the effects of the spatial scale on genetic structure of this species, 119
our aims were: 120
i) to examine the genetic differentiation of E. cavolini at the regional scale in the Ligurian 121
Sea, by focusing on the differences between two adjacent regions 300s kilometres apart, 122
i.e. Marseille in SE France and Portofino in NW Italy, where a number of MPAs have 123
already been established; 124
ii) to analyze the genetic differentiation at the local scale 10s kilometres apart, i.e. within 125
the areas of Marseille and Portofino, in order to acquire insights into the dispersal abilities 126
of this species at small scale; 127
iii) to investigate the vertical connectivity between populations by including samples from 128
different depths. We tested whether the absence of a vertical genetic differentiation 129
previously observed in Marseille can be extended in other areas of the Ligurian Sea. 130
131
2. Materials and methods 132
2.1 Samples collection 133
Colonies of Eunicella cavolini were sampled by scuba divers removing a 3 cm branch (usually 134
terminal) using sea-snips (n=628 colonies in total; see Tab. 1). In order to have colonies separated 135
by few and hundreds of km and at different depths, samples were collected few kilometres apart at 136
five sites in the MPA of Portofino (Genoa, NW Italy) and at ten sites in the area around Marseille 137
(SE France) (Fig. 1). Samples around Marseille were taken at two depths (20 and 40 m) in Riou, 138
Veyron and Méjean sites and at one depth in the other seven sites. Nine colonies were sampled on 139
artificial reefs (REE), which were installed in 2007-2008. Samples at Portofino were collected at 140
two depths (20 m and 40 m), except for Punta Cervara (PAR), where E. cavolini only occurs at 13-141
18 m depth. Geographical distances between sites in the Marseille area ranged from 2 km to 100 142
km whereas in the Portofino area they ranged from 1 km to 6 km (Fig. 1). Distances between 143
Marseille and Portofino ranged from 381 km to 274 km. Sample size was even in all sites, around 144
Commenté [DA3]: Suggestion: "In the area of Marseille, a new Marine Protected Area has recently been designed. It is then important to study its potential connectivity with other populations and MPAs along the coast.’" (we can also indicate that there are almost no other populations on the west side...)
7 30 colonies per site were taken. Once collected, samples were preserved in 95% ethanol at -20°C 145
until DNA extraction. Permits for sampling in the MPA of Portofino were obtained from the local 146
competent authority of the Area Marina Protetta Portofino. All sampling activities were performed 147
in accordance with the Italian and French laws. 148
149
Table 1. Information on the samples collection of Eunicella cavolini in Marseille (France) 150
and Portofino (Italy). Sampling dates are indicated (day/ month/ year). 151
Area Site Label Depth (m) Latitude Longitude Sample size (n) Date Portofino Punta
Cervara-Paraggi PAR 14 44° 18.653'N 9° 12.785'E 28 8/05/2015 Portofino Punta Faro shallow PFS 20-23 44° 17.910'N 9° 13.156'E 22 12/05/2015 Portofino Punta Faro deep PFD 36-40 44° 17.910'N 9° 13.156'E 15 12/05/2015 Portofino Casa del Sindaco
shallow CSS 19-21 44° 18.182'N 9° 12.147'E 33 6/05/2015 Portofino Casa del Sindaco
deep CSD 38-40 44° 18.182'N 9° 12.147'E 26 6/05/2015 Portofino Secca Gonzatti
shallow SGS 18-20 44° 18.547'N 9° 10.686'E 29 28/04/2015 Portofino Secca Gonzatti
deep SGD 39-42 44° 18.547'N 9° 10.686'E 31 28/04/2015 Portofino Punta Torretta
shallow PTS 15 44° 18.713'N 9° 09.979'E 30 22/04/2015 Portofino Punta Torretta deep PTD 35 44° 18.713'N 9° 09.979'E 31 22/04/2015 Marseille Sec de Sarraniers SAR 40 42° 59.272'N 6° 17.030'E 33 7/11/2011 Marseille Cave 3PP 3PP 15 43° 09.795'N 5° 36.000'E 30 17/02/2012 Marseille Riou shallow RIS 20 43° 10.360'N 5° 23.420'E 32 15/03/2012 Marseille Riou deep RID 40 43° 10.360'N 5° 23.420'E 31 15/03/2012 Marseille Pouard on Île Plane POU 15-25 43° 11.340'N 5° 23.130'E 30 14/02/2012 Marseille Veyron shallow VES 20 43° 12.414'N 5° 15.176'E 30 24/11/2011 Marseille Veyron deep VED 40 43° 12.414'N 5° 15.176'E 30 24/11/2011 Marseille Somlit SOM 58 43° 14.050'N 5° 17.050'E 30 28/11/2011 Marseille Saména SAM 10 43° 13.780'N 5° 20.880'E 34 16/01/2012 Marseille Cap Cavau CAV 25 43° 15.630'N 5° 17.390'E 29 1/02/2012 Marseille Méjean shallow MJS 18-20 43° 19.700'N 5° 13.480'E 33 16/03/2012 Marseille Méjean deep MEJ 30-40 43° 19.700'N 5° 13.480'E 31 24/02/2012 Marseille Artificial reef REE 15-20 43° 15.702'N 5° 20.398'E 10 7/05/2015
8 Fig. 1. Geographical location of the 15 sites in the Ligurian Sea where populations of Eunicella 153
cavolini were sampled and analyzed in the present study. A: ten sampling sites in the area of 154
Marseille (SE France); B: five sampling sites in the area of Portofino (NW Italy). Refer to Tab. 1 155
for the labels of each site. 156
157
2.2 DNA extraction and microsatellite genotyping 158
Total genomic DNA was extracted using QIAamp® DNA Mini Kit (Qiagen®) according to
159
manufacturer's instructions. Individuals were genotyped at six microsatellite loci: C21, C30, C40, 160
S14, EVER007, EVER009 (Holland et al., 2013; Molecular Ecology Resources Primer 161
Development Consortium et al., 2010; Pivotto et al., 2015). The loci were amplified through PCR 162
Multiplex using the Type-it® Microsatellite PCR Kit (Qiagen®). PCR amplifications were done in a
163
final reaction volume of 10 μL containing 1 μL of DNA, 5 μL of MasterMix, 3 μL of H2O
Milli-164
Q® and 1 μL of primer mix (with each primer at 2 µM). 165
Electrophoresis was carried out at the IMBE laboratory on an ABI 3130 genetic analyzer and at the 166
Genotyping and Sequencing facility at Montpellier (Plateforme Génotypage - Séquençage, 167
Université de Montpellier) on an ABI 3500xL Genetic Analyzer (Applied Biosystems), using 168
GeneScan LIZ 600 (Applied Biosystems) as the internal size standard. Four reference individuals 169
were included in each migration for cross-validation. Electropherograms were analysed with 170
GeneMapper® version 4.0 (Applied Biosystems).
171 172
2.3 Genetic diversity and structure 173
We used MICRO-CHECKER v.2.2.3 (Van Oosterhout et al., 2004) to check for scoring errors 174
owing to stutters, large allele dropout and to estimate null allele frequencies. We used GENCLONE 175
2.0 (Arnaud-Haond and Belkhir, 2007) to test for the occurrence of repeated multilocus genotypes 176
(MLGs). Repeated MLGs were omitted from the following analyses. 177
Linkage disequilibrium was tested among all pairs of loci at each site with a permutation test (n = 178
1000) using GENETIX v.4.05 (Belkhir et al., 2004). The f estimator of FIS (Weir and Cockerham,
179
1984) was computed for each population using GENETIX. Departures from panmixia were tested 180
with an exact implemented in GENEPOP 4.5.1 with default parameters (Rousset, 2008). 181
9 We analysed the genetic diversity for each population by computing observed (Ho) and Nei’s 182
(1973) unbiased expected heterozygosity (He) with GENETIX. Allelic richness [Ar (g)] and 183
private allelic richness [Ap (g)] were estimated with a rarefaction procedure using the HP-RARE 184
software (Kalinowski, 2005) with the minimum number of genes set to 18. FreeNA was used to 185
estimate FST for each pair of populations using the ENA correction described in Chapuis and
186
Estoup (2007), to provide more precise estimates of FST considering the presence of null alleles. As
187
a complementary measure of genetic differentiation, we computed the estimator of actual 188
differentiation Dest (Jost, 2008) with the online Software for the Measurement of Genetic Diversity 189
(Crawford, 2010; SMOGD 1.2.5). Exact tests of genic differentiation were performed with 190
GENEPOP with default parameters. 191
We estimated contemporary connectivity among populations with BAYESASS 3.0 (Wilson and 192
Rannala, 2003). This software was used to assess the proportions of individuals assigned to their 193
hypothesized population and to the other populations. As the S14 locus showed strong departures 194
from panmixia, we performed this analysis without this locus. The current implementation of 195
BAYESASS is limited to 20 populations. We therefore performed two analyses: one for Portofino 196
with 9 populations, and another for Marseille with 13 populations. The added benefit of this 197
method over a standard genetic distance method is the ability to estimate the direction of gene flow. 198
To ensure consistent and accurate estimates, we varied seed numbers and explored the number of 199
runs needed (i.e. burn-in) to be discarded before data collection. The burn-in length was set after 200
log-likelihood values peaked. We also varied seed numbers and mixing parameters to get 201
acceptance rates between 40% and 60% (Wilson and Rannala, 2003). Delta values of m = 0.05, P = 202
0.15, and F = 0.3 yielded an average number of changes in the accepted range. For each analysis, 203
we performed five independent (i.e. with different seeds) replicate runs (their average value was 204
then used) of the algorithm for 500 000 iterations, and a burn-in of 200 000 generations was 205
determined an appropriate number of runs for convergence and stabilization of posterior 206
probabilities with a sampling frequency of 2000. As a complementary analysis to BAYESASS, we 207
used the GENECLASS2 software for the assignment of individuals (Piry et al., 2004). We used the 208
10 criterion of Rannala and Mountain (1997), and the computation of the probability according to 209
Paetkau et al. (2004) with 1000 simulated individuals, and a type I error of 0.01. The colonies 210
sampled on artificial reefs in Marseille (REE) were also analyzed separately with GENECLASS2: 211
we used the other populations from Marseille as reference samples to study the potential origin of 212
colonies on the reefs. Considering the strong departure from panmixia observed for the S14 locus, 213
we did not use it with GENECLASS2. 214
The Bayesian method implemented in STRUCTURE v.2.2 (Falush et al., 2003, 2007; Pritchard et 215
al., 2000) was used to evaluate the number of genetic clusters (K) in our data set from individual 216
genotypes without prior information on their geographical locations. Again, as the S14 locus 217
showed strong departures from panmixia, we repeated the analysis without this locus. 218
STRUCTURE was launched using the admixture model, with correlated allele frequencies among 219
clusters and the recessive allele option to cope with null alleles (Falush et al., 2007). Ten 220
independent runs were performed for each K using 500000 iterations and a burn-in period of 221
200000. Following the recommendations of Jakobsson et al. (2008) and Rosenberg et al. (2002) for 222
cases of large datasets, we first studied the results of STRUCTURE at several small values of K 223
during a first round of analysis, and then we looked for additional substructure on partitioned 224
datasets during a second round. For the first round, the whole dataset (622 individuals) was used. K 225
was set to vary between 1 and 6. As the analysis of the whole dataset indicated the presence of two 226
clusters corresponding to the two sampling regions, we performed a second analysis by separating 227
the Marseille sites from the Portofino sites. The choice of the best K values was based on the result 228
of STRUCTURE HARVESTER (Earl and von Holdt, 2012) with the Evanno’s criterion (Evanno et 229
al., 2005), and we retained the values which seemed the most informative, i.e. those with the lowest 230
levels of individual admixture: we therefore discussed K = 2 and 3 for the global analysis and K = 231
2 for the analysis within regions. The merging of the different runs and the visualization of the 232
results were done with the CLUMPAK software (Kopelman et al., 2015). 233
We tested for isolation by distance (IBD) by examining the correlation between pairwise FST
(1-234
FST) values and the logarithm of the geographical distances [Ln(d)] between populations (Rousset,
235
Commenté [DA4]: Evanno, G., Regnaut, S., & Goudet, J. (2005). Detecting the number of clusters of individuals using the software STRUCTURE: a simulation study. Molecular ecology, 14(8), 2611-2620.
11 1997) with IBD Web Software (IBDWS 3.16; Jensen et al., 2005). Geographical distances were 236
measured using GOOGLE EARTH 6.2.2.6613 (available at https:// www.google.fr/intl/fr/earth/), 237
considering the minimum distances by sea between sites. IBD was assessed independently within 238
Marseille and Portofino, as well as across the entire Liguro-Provençal area in the Ligurian Sea. The 239
significance of the correlation between the two distance matrices was tested using a Mantel test (n 240
= 1000) in IBD Web Software. 241
Whenever necessary, corrections for multiple tests were performed with the False Discovery Rate 242
(FDR) method of Benjamini and Hochberg (1995). 243 244 3. Results 245 3.1 Genetic variability 246
All loci were polymorphic in all populations except for locus EVER007 in PFD and C30 in PTD. 247
The total number of alleles ranged between 4 for EVER007 and 16 for S14, with a mean of 10.5 248
alleles per locus. Observed heterozygosity varied from 0 for EVER007 in PFD and C30 in PTD to 249
0.86 for EVER009 in PAR and PFD. Expected heterozygosity ranged from 0 for EVER007 in PFD 250
and C30 in PTD to 0.86 for S14 in VED. MICRO-CHECKER suggested the presence of null 251
alleles for S14, as indicated by the general excess of homozygotes for most allele size classes. 252
Global significant linkage disequilibrium (LD) between the loci C21 and S14 was detected 253
considering all samples only (P < 0.05). When considering each population separately, significant 254
LD among pairs of loci was observed in nine populations, but these were not the same pairs of loci 255
in the different populations. After FDR correction, significant LD was only detected in VES 256
between loci EVER009 - C30. Seven cases of duplicated MLGs were observed (Table S1). In two 257
cases, the repeated MLGs were observed in different populations (PTD vs SGD, MJS vs CAV). 258
Two repeated MLGs were observed on artificial reefs and four MLGs were observed in the CSS 259
population. 260
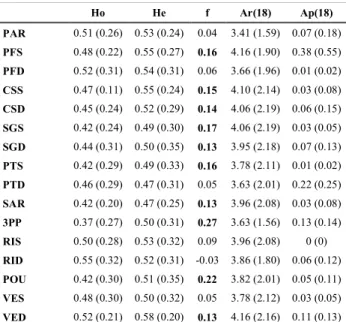
At the population level, expected heterozygosity ranged from 0.58 for VED to 0.46 for SAM. Ar 261
(18) values ranged from 3.41 in PAR to 4.25 in MEJ. Ap (18) values were scattered from 0 in RIS 262
12 and REE to 0.38 in PFS (Tab. 2). No difference of expected heterozygosity was found between the 263
areas of Portofino (He= 0.52 ± 0.02) and Marseille (He=0.51± 0.02). 264
265
3.2 Deviations from Hardy–Weinberg equilibrium 266
Significant multilocus heterozygote deficiencies were observed in ten populations: PFS, CSS, CSD, 267
SGS, SGD, PTS, SAR, 3PP, POU and VED (Tab. S2). When not considering the locus S14, 268
significant heterozygote deficiencies was observed only in VED and 3PP (Tab. S2). For EVER007, 269
EVER009 and C21, the null hypothesis of panmixia was rejected for two populations. For C30 and 270
C40, the null hypothesis of panmixia was not rejected for any population. Multilocus FIS values (f)
271
ranged between -0.03 for RID and 0.27 for 3PP, with a mean value equal to 0.10. Considering each 272
locus separately, f values ranged from -0.34 for C40 in SOM to 0.78 for S14 in 3PP (Tab. S2). 273
274
Table 2. Measures of genetic diversity for 22 populations of Eunicella cavolini based on six 275
microsatellites loci. Ho: observed heterozygosity; He: unbiased expected heterozygosity; f: Weir 276
and Cockerham (1984) estimator of multilocus FIS; Ar(18) and Ap(18): allelic and private allelic
277
richness, respectively, with rarefaction for a corresponding sample size of 18. Standard deviations 278
over loci are in brackets. Values in bold are significant at the 0.05 level after FDR correction. 279 280 Ho He f Ar(18) Ap(18) PAR 0.51 (0.26) 0.53 (0.24) 0.04 3.41 (1.59) 0.07 (0.18) PFS 0.48 (0.22) 0.55 (0.27) 0.16 4.16 (1.90) 0.38 (0.55) PFD 0.52 (0.31) 0.54 (0.31) 0.06 3.66 (1.96) 0.01 (0.02) CSS 0.47 (0.11) 0.55 (0.24) 0.15 4.10 (2.14) 0.03 (0.08) CSD 0.45 (0.24) 0.52 (0.29) 0.14 4.06 (2.19) 0.06 (0.15) SGS 0.42 (0.24) 0.49 (0.30) 0.17 4.06 (2.19) 0.03 (0.05) SGD 0.44 (0.31) 0.50 (0.35) 0.13 3.95 (2.18) 0.07 (0.13) PTS 0.42 (0.29) 0.49 (0.33) 0.16 3.78 (2.11) 0.01 (0.02) PTD 0.46 (0.29) 0.47 (0.31) 0.05 3.63 (2.01) 0.22 (0.25) SAR 0.42 (0.20) 0.47 (0.25) 0.13 3.96 (2.08) 0.03 (0.08) 3PP 0.37 (0.27) 0.50 (0.31) 0.27 3.63 (1.56) 0.13 (0.14) RIS 0.50 (0.28) 0.53 (0.32) 0.09 3.96 (2.08) 0 (0) RID 0.55 (0.32) 0.52 (0.31) -0.03 3.86 (1.80) 0.06 (0.12) POU 0.42 (0.30) 0.51 (0.35) 0.22 3.82 (2.01) 0.05 (0.11) VES 0.48 (0.30) 0.50 (0.32) 0.05 3.78 (2.12) 0.03 (0.05) VED 0.52 (0.21) 0.58 (0.20) 0.13 4.16 (2.16) 0.11 (0.13)
13 SOM 0.46 (0.18) 0.49 (0.24) 0.07 3.65 (1.64) 0.05 (0.12) SAM 0.43 (0.26) 0.46 (0.27) 0.08 3.62 (1.83) 0.07 (0.18) CAV 0.48 (0.18) 0.51 (0.24) 0.08 4.22 (1.68) 0.17 (0.18) MJS 0.51 (0.33) 0.49 (0.33) -0.02 3.99 (2.18) 0.14 (0.23) MEJ 0.48 (0.31) 0.50 (0.34) 0.06 4.25 (2.36) 0.13 (0.31) REE 0.50 (0.29) 0.51 (0.25) 0.06 3.60 (1.55) 0 (0) Mean Value 0.47 (0.04) 0.51 (0.03) 0.10 3.88 (0.24) 0.08 (0.09) 281
3.3 Population genetic structure 282
The mean global FST was 0.07 (± 0.04), the mean FreeNA corrected FST was 0.07 (± 0.03), and the
283
mean Dest was 0.17 (± 0.08). Pairwise multilocus FST between all populations ranged from 0.002
284
between MJS and MEJ to 0.166 between PAR and SAM (Tab. S3). Pairwise FreeNA corrected FST
285
ranged from 0.01 (PFS vs PFD, CSS vs CSD, CSD vs SGD, RIS vs RID, VES vs SOM, MEJ vs 286
SAM) to 0.17 (PAR vs SAM). Pairwise Dest ranged from 0 (VED vs VES) to 0.38 (CSD vs POU) 287
(Tab. S4). After the FDR correction, all pairwise exact tests of genic differentiation were 288
significant apart from CSS vs CSD and RIS vs RID (two comparisons between depths; Tab. S3). 289
Apart from depth, significant comparisons were found with a minimum distance of 0.99 km in 290
Portofino and 2.95 km in Marseille. When locus S14 was omitted, two additional differentiation 291
tests were non-significant: VES vs SOM and PFS vs PFD. 292
The correlation between FST (1 - FST) and Ln(dist) was significant using geographical distances
293
(rLn(dist) = 0.596; P< 0.001), confirming the occurrence of an IBD model of gene flow (Fig. 2).
294
Within areas, correlations were also significant for the Portofino (rLn(dist) = 0.625; p < 0.001) and
295
Marseille areas (rLn(dist) = 0.436; p < 0.001) (Fig. 2B and 2C). The IBD slope was similar in the two
296
areas (0.019 in Portofino and 0.015 in Marseille). When using FST corrected by FreeNA, IBD was
297
significant at the global level (p < 0.001), within Marseille (p = 0.04) and within Portofino (p = 298
0.002). Again, the IBD slope was similar in the two areas (0.032 at Portofino and 0.035 at 299
Marseille; data not shown). 300
14 Fig. 2. Isolation by distance (IBD) pattern for all populations (A), taking into account the minimum 302
geographical distances between populations. Separate analyses of IBD for Portofino populations 303
(B) and Marseille populations (C). The graphs show the linear regression of the genetic distance 304
measured as FST (1 - FST) over logarithms of the geographical distance (m).
305 306
The results of the genetic clustering using STRUCTURE indicated that the highest Delta (K) value 307
for the whole dataset was 2 (data not shown). With K = 2, the clustering showed a clear distinction 308
between Marseille and Portofino, and K = 3 did not provide additional information (Fig. 3). The 309
addition of locus S14 to the analysis gave a very similar result (data not shown). Each of these two 310
regional clusters was then subjected to a second round of STRUCTURE. The highest Delta (K) 311
value was 3 at Marseille and 4 at Portofino. Nevertheless, inside each region, the results did not 312
indicate the presence of any additional cluster: in both cases, all individuals were equally shared 313
among clusters for all K (data not shown). 314
315
Fig. 3. Population structure as inferred by the STRUCTURE analysis. Each individual is 316
represented by a vertical line partitioned into K-coloured segments that represent the individual’s 317
membership fraction in K clusters. Each population is delineated by black vertical lines and named 318
as in Table 1. 319
320
Migration analysis using the BAYESASS analysis indicated similar levels of self-recruitment in the 321
two regions: the proportion of individuals derived from the source population varied between 0.69 322
(PFD) and 0.80 (PAR) at Portofino, and between 0.68 (CAV) and 0.80 (POU) at Marseille (Tab. 323
S5). The estimates of migration rates between populations were generally low and with quite large 324
standard errors. The assignment analysis of GENECLASS2 indicated that the probability of 325
assignment (averaged over all individuals of the population) was higher for populations from their 326
region of origin than for another region: the intra-region assignment probability was 0.31 (± 0.10) 327
for Portofino and 0.32 (± 0.10) for Marseille (Table S6). The within-region highest assignment 328
probabilities corresponded to the population where individuals were sampled: these retention 329
probabilities were very similar among populations and regions: 0.46 (± 0.02) at Portofino and 0.45 330
(± 0.03) at Marseille. The assignment probability of Portofino individuals to Marseille populations 331
15 was 0.11 (± 0.07) and 0.16 (± 0.07) in the other direction. The assignment probabilities of E. 332
cavolini colonies sampled on artificial reefs near Marseille did not allow the identification of a 333
single main origin, and for a given colony the probabilities were often similar among different 334
candidate populations (Table S7). Only the colony 14B displayed a much higher probability of 335
origin for one population (Saména) than for the other populations. The colonies 15J, 15M, 15O and 336
15P displayed low assignment probabilities (< 0.10) for all the populations tested here. 337 338 4. Discussion 339 4.1 Genetic diversity 340
The analysis of six microsatellite loci evidenced low genetic diversity for Eunicella cavolini (He by 341
population over loci = 0.51) when compared with other Mediterranean octocorals: Corallium 342
rubrum studied in the same area (He by population over loci = 0.77; Ledoux et al., 2010) and 343
Paramuricea clavata (He by populations over loci = 0.74; Mokhtar-Jamaï et al., 2011). There 344
could be several possible and non-mutually exclusive reasons. i) the microsatellites used here were 345
less variable because of their sequence or origin: S14 and EVER007, and 009 correspond to cross-346
amplification from E. singularis and E. verrucosa respectively; ii) the species is less variable than 347
other octocoral species, likely due to the impact of past bottlenecks; iii) a geographical effect: the 348
comparison of populations from Marseille with other Mediterranean areas indicated that in the NW 349
Mediterranean, the genetic diversity of E. cavolini is lower than in the SW Mediterranean 350
populations, but higher than in the E Mediterranean (Masmoudi et al., 2016). Nevertheless, even in 351
the area of the highest genetic diversity for E. cavolini, the expected heterozygosity was somewhat 352
lower than in the two others Mediterranean octocorals (He = 0.68 in Algeria; Masmoudi et al.,
353
2016). A comparative study of the demographic history of these species with similar markers (such 354
as Single Nucleotide Polymorphisms, SNPs) could help in understanding the origin of these 355
differences. 356
16 4.2 Genetic structure at large spatial scale
358
A pattern of isolation by distance was observed at the regional spatial scale with significant genetic 359
structuring found between the two regions. Values of FST for the Liguro-Provençal geographical
360
area ranged between 0.002 and 0.166, with a mean value of 0.09. If we make comparisons with 361
other octocorals, FST for the Liguro-Provençal area was between 0.07 and 0.14 with a mean value
362
of 0.09 for P. clavata (Mokhtar-Jamaï et al., 2011), and between 0.09 and 0.2 with a mean value of 363
0.13 for C. rubrum (Ledoux et al., 2010). Such comparisons between species can be impacted by 364
different levels of heterozygosities among markers, which influences the highest FST values (Jost et
365
al. 2018). As previously mentioned, Hexp is lower in E. cavolini based on our markers, than in C. 366
rubrum and P. clavata. Despite this, FST is lower for E. cavolini than for the other species. It thus
367
shows that genetic differentiation within the Liguro-Provençal area is higher for C. rubrum than for 368
E. cavolini and P. clavata. Such differences in the levels of genetic differentiation between species 369
could be due to differences in dispersal abilities or in local effective sizes. Although all brooders 370
are more likely to exhibit restricted gene flow (Carlon et al., 1999), C. rubrum has a mean dispersal 371
ability of 10s of meters or less (Constantini et al., 2007a), whereas for P.clavata it would be around 372
1 km (Mokhtar-Jamaï et al., 2011) and for E. cavolini our results suggest a mean dispersal ability of 373
less than 1 km. Nevertheless this may be at odd with experimental data on larval phase duration in 374
the red coral (Martinez-Quintana et al., 2015), and this does not preclude the possibility of 375
exchanges at higher distances (Ledoux et al., 2010b), even if their frequency remains unknown. 376
The structure pattern revealed by STRUCTURE showed a distinction between Portofino and 377
Marseille. This pattern is also supported by the higher values of FST between areas (average FST=
378
0.092) than within areas (average FST= 0.063 for Portofino and average FST= 0.069 for Marseille),
379
and by the marked differences in assignment probabilities between regions compared to within 380
regions. These results indicate a limited gene flow between the two regions for the yellow 381
gorgonian, which could be linked to intrinsic limits to dispersal at such distances (the two regions 382
are 273 km apart), and/or to the effect of a barrier to gene flow. The genetic analyses of yellow 383
gorgonian populations in other intermediate positions between Marseille and Portofino, could help 384
17 in testing whether there is a genetic barrier between the two regions, or if the observed differences 385
are induced by sampling along a geographical gradient of genetic differences (i.e. IBD, Aurelle and 386
Ledoux, 2013). The asymmetry of assignment probabilities between the two regions suggests a 387
higher gene flow from east to west that is consistent with the main direction of currents in this area 388
(Berline et al., 2014). Nevertheless, the confidence intervals are overlapping and more precise 389
estimates would be useful here to test this hypothesis. 390
Regarding the larval biology of E. cavolini, very little information is available, but it may 391
contribute to the observed genetic structure. Eunicella cavolini is also a brooding species, which 392
implies more reduced larval dispersal abilities. Such low larval dispersal is observed in other 393
coralligenous species, where the studies available to date showed significant differentiation from a 394
few kilometres or tens of cm (Abbiati et al., 2009; Calderon et al., 2007; Goffredo et al., 2004; 395
Ledoux et al., 2010). In contrast to these cases, another Mediterranean benthic species, the sea 396
urchin Paracentrotus lividus, displayed a much larger genetic structure (Paterno et al., 2017). It 397
would therefore be interesting to study on more species the ecological or evolutionary factors 398
leading to the selection of different dispersal strategies in these species. Indeed multispecific
399
approaches can reveal common barriers to gene flow and identify cold and hot spots of genetic
400
diversity (Cahill et al., 2017).
401 402
4.3 Genetic structure at small spatial scale 403
A pattern of isolation by distance was observed also at the local spatial scale with significant 404
genetic structuring found within the two regions. The populations from each area, Marseille and 405
Portofino, correspond to a single genetic cluster according to STRUCTURE. The additional genetic 406
clusters identified within regions were not informative and corresponded to the limits of inference 407
of this method. Within regions, most populations appeared genetically differentiated except for 408
comparisons between depths (see below). Significant genetic differentiation was found between 409
sites few kilometres apart. The pattern of differentiation within regions did not correspond to 410
different clusters, but to the isolation by distance of differentiated populations. The use of FST and
411
Commenté [DA5]: Cahill, A. E., De Jode, A., Dubois, S., Bouzaza, Z., Aurelle, D., Boissin, E., ... & Merigot, B. (2017). A multispecies approach reveals hot spots and cold spots of diversity and connectivity in invertebrate species with contrasting dispersal modes. Molecular ecology, 26(23), 6563-6577.
18 Dest gives different and complementary information on genetic differences between populations 412
(Jost et al., 2018). Here at different scales, DEST estimates where higher than Fst: DEST then
413
indicates an important allelic differentiation between populations, higher than the differentiation 414
estimated from fixation index alone (Jost et al., 2018). At a local scale, and on the basis of DEST,
415
one can identify populations with particularly high differentiation: such as Pouard in Marseille, or 416
Punta Faro Deep in Portofino. These sites did not correspond to particularly distant populations, 417
and the origin of these differences remains to be studied (see below). More generally, in the short 418
term, the interaction between gene flow and genetic drift precludes the homogenization of genetic 419
diversity at the metapopulation scale. 420
The BAYESASS software was used to estimate contemporary connectivity among sites. The 421
inferred non-migration rates fell mostly within two classes (around 0.67 and 1). Such values 422
correspond to the bounds of the prior distribution and could indicate a bias in the inference 423
(Meirmans, 2014), despite the use of five independent runs. The Sarranier, 3PP cave and Punta 424
Cervara populations displayed higher non-migration rates (above 0.9), which would agree with 425
their relative geographical isolation, but this was also observed for a few a priori less isolated 426
populations such as Somlit and Saména. The GENECLASS2 software was then used to obtain 427
another estimate of contemporary migration. With this method, the low probabilities of assignment 428
to the population of origin could be the result of a quite low within region genetic structure. As a 429
comparison, much higher levels of self-recruitment were inferred with this method for P. clavata, 430
including for some sites studied here around Marseille (Mokhtar-Jamaï et al., 2011). This confirms 431
that the dispersal abilities of E. cavolini are higher than those of P. clavata. Within a given region, 432
sporadic gene flow could take place and contribute to limiting the observed differentiation 433
compared to other octocoral species. In this case, the use of additional genetic markers could be 434
tested to obtain higher probabilities of assignment. 435
Some of the studied sites could be more isolated because of the distance (e.g. Sarranier and 3PP 436
cave), a particular position behind a headland (e.g. Punta Cervara), or caused by oceanographic 437
features, which still remain to be investigated (Pouard, Punta Faro Deep). Population genetic 438
Commenté [DA6]: Jost, L., Archer, F., Flanagan, S., Gaggiotti, O., Hoban, S., & Latch, E. (2018). Differentiation measures for conservation genetics. Evolutionary Applications.
19 structure is a pattern shaped by the interaction between physical drives (e.g. currents, barriers) and 439
biological processes, such as larval biology and demography (e.g. fluctuations in population 440
density due to habitat fragmentation and recruitment; Padrón and Guizien, 2015). Different levels 441
of genetic drift could induce contrasted levels of genetic structure, either because of different 442
current population sizes or different demographic histories. Regarding the colonization of artificial 443
reefs near Marseille, several populations could correspond to potential sources. The very low 444
assignment probabilities for four colonies indicate that non-sampled populations may have 445
contributed to this new population. This possibility of connection with different populations may 446
seem at odds with the observed differentiation for most populations. Nevertheless, gene flow in 447
populations might be limited by established colonies (e.g. through space limitation), which is not 448
the case in new populations. Recolonization might then not be limited in an area with enough 449
surrounding populations. As similar results was obtained on P. clavata by Arizmendi-Meja et al. 450
(2015), who observed that a recently founded population may correspond to several source 451
populations. 452
A study combining more markers (such as SNPs, Paterno et al., 2017) and integrating the putative 453
larval characteristics with local hydrodynamics, could help to better understand the observed 454
structure and to estimate connectivity patterns (e.g. Thibaut et al., 2016). In addition, the possibility 455
of hybridization between E. cavolini and the other species of the genus Eunicella (i.e. E. singularis 456
and E. verrucosa) occurring in the same area (Aurelle et al., 2018) could also shape the observed 457
genetic structure and diversity, depending on the density of the different species and on the 458
frequency of genetic incompatibilities. These processes are only beginning to be considered in this 459
context, but would require an in-depth study. 460
461
4.4 Genetic structure between depths 462
Over seven comparisons between depths, only in two sites we found no genetic difference with 463
depths. This is partly contradictory with the lack of genetic differentiation observed between depths 464
in the Marseille area (Masmoudi et al., 2016), where seven loci (six loci in the present paper) and a 465
Commenté [DA7]: Arizmendi-Mejía, R., Linares, C., Garrabou, J., Antunes, A., Ballesteros, E., Cebrian, E., ... & Ledoux, J. B. (2015). Combining genetic and demographic data for the conservation of a Mediterranean marine habitat-forming species. PLoS One, 10(3), e0119585.
20 permutation test (exact test in the present paper) were used. These differences suggest that the 466
differentiation between depths is quite low, but near significance depending on sampling effort or 467
drift effects, and that the exact test is more powerful than the permutation test. Two others 468
Mediterranean octocoral species, Paramuricea clavata (Mokhtar-Jamaï et al., 2011) and Corallium 469
rubrum (Constantini et al., 2011; Ledoux et al., 2010) showed a generalized genetic differentiation 470
with depths in the area of Marseille. Intrinsic biological differences (e.g. spawning date compared 471
to water stratification or larval properties) interacting with hydrodynamics might explain the 472
differences observed between these two species and E. cavolini. For the congeneric species E. 473
singularis, a strong restriction to gene flow was observed between 30 m and 40 m depth (Costantini 474
et al., 2016). We did not observe this for E. cavolini, but enlarging this study over a wider 475
bathymetrical range might be interesting. 476
The pattern of genetic structure along the depth gradient can be compared with the pattern of 477
adaptation of E. cavolini. Environmental variables, such as light and temperature, vary along the 478
depth gradient and can induce local adaptation (Webster et al., 2017). Thermo-tolerance 479
experiments showed that the response to thermal stress is very different between depths in E. 480
cavolini, with a lower thermo-tolerance in deep individuals (Pivotto et al., 2015). Such differential 481
phenotypic buffering is observed in a context of low and non-significant genetic differentiation for 482
a studied site (e.g. in the site of Riou, and see also Pivotto et al., 2015). For E. cavolini, the 483
adaptation to the different thermal regimes could correspond to acclimatization or to a combination 484
of genetic and non-genetic effects. In addition, the reduced number of loci analysed here does not 485
allow us to reject the possibility of genetic adaptation determined by other genomic regions. More 486
generally, E. cavolini can be found in a wide range of light conditions (Cánovas Molina et al., 487
2016b), which could point to the general physiological plasticity of the species. 488
The role of deep environments as possible refugia from disturbances for shallow marine species 489
(i.e. the deep refugia hypothesis) has been widely recognized (Bongaerts et al., 2010); however, the 490
genetic differentiation of E. cavolini with depth, although low, questions the possibility for deep 491
populations to act as a regular source of new larvae in the event of mass mortality of shallow 492
21 colonies due to thermal anomalies (Cerrano et al., 2000; Garrabou et al., 2009). Moreover the 493
possible adaptation of octocorals to different depths (Ledoux et al., 2015), including in E. cavolini 494
(Pivotto et al., 2015), could influence the evolution of populations along this depth gradient. 495
496
5. Conclusion 497
Our results confirm the strong genetic structure observed in the Mediterranean octocorals studied 498
so far, which contrasts with what has been observed for other anthozoan species (e.g. Alcyonium 499
digitatum in the northeast Atlantic; Holland et al., 2017). The genetic structure in Eunicella 500
cavolini is lower than in Paramuricea clavata and Corallium rubrum, the other two typical benthic 501
species occurring in coralligenous assemblages of the Mediterranean Sea. The high differentiation 502
observed at the large spatial scale of 100s of kilometres, i.e. between the two regions, argues for the 503
importance of local management of such benthic species. For example, a network of connected 504
MPAs focusing on this species, as well as on other species of the coralligenous assemblages with 505
similar dispersal abilities, should ideally consider these spatially restricted dispersal abilities. The 506
weaker but significant genetic structure observed in E. cavolini at the small spatial scale of 507
kilometres, i.e. among sites within the same region, suggests that gene flow can be important in the 508
short-term evolution of populations. The identification of sites with important genetic 509
differentiation could be taken into account in conservation. Regarding the response to climate 510
change, the observed diversity in thermo-tolerance levels is correlated with the genetic structure 511
estimated with microsatellites. 512
513
Supplementary data: 514
Supplementary material is available at the online version of the manuscript.
515
S1 Table. Results of the test of occurrence.
516
(DOC)
517
S2 Table. Multilocus and monolocus values of FIS estimator.
518
(DOC)
519
Commenté [DA8]: Ledoux, J. B., Aurelle, D., Bensoussan, N., Marschal, C., Féral, J. P., & Garrabou, J. (2015). Potential for adaptive evolution at species range margins: contrasting interactions between red coral populations and their environment in a changing ocean. Ecology and evolution, 5(6), 1178-1192.
22
S3 Table. Pairwise FST values.
520
(DOC)
521
S4 Table. Results of mean Dest and FST estimates.
522
(DOC)
523
S5 Table. Results of the Bayesian assessment of migration proportions.
524
(DOC)
525
S6 Table. Assignment probabilities with GENECLASS2.
526
(DOC)
527
S7 Table. Assignment probabilities with GENECLASS2 for colonies from artificial reefs.
528 (DOC) 529 530 Acknowledgments 531
We are grateful to Alice Oprandi, Simone Musumeci (DiSTAV, Università degli Studi di Genova), 532
and F. Zuberer (Centre d’Océanologie de Marseille) for field collection support. We thank 533
Sandrine Ruitton for the indication of the sampling of E. cavolini on artificial reefs. We thank the 534
molecular biology service of the IMBE. This study was funded by the Università degli Studi di 535
Genova (A. Cánovas-Molina PhD fellowship), by the project PRIN 2010-11 Bioconstructions 536
funded by the Italian Ministero dell'Istruzione, dell'Università e della Ricerca and by the Algerian – 537
French collaboration program Tassili n°12MDU853. The project leading to this publication has 538
received funding from European FEDER Fund under project 1166-39417 539
540
I state in behalf of all co-authors, that no conflict of interest exists in this work. 541
542
References 543
Abbiati, M., Costantini, F., Fauvelot, C., 2009. Proceedings of the 1st Mediterranean Symposium 544
on the Conservation of the Coralligenous and Other Calcareous Bio-Concretions. In: 545
Pergent-Martini C. and Brichet M. (Eds.), RAC/SPA Publ, Tunis, pp. 28-33. 546
Alleaume-Benharira, M., Pen, I., Ronce, O., 2006. Geographical patterns of adaptation within a 547
species’ range: interactions between drift and gene flow. J. Evol. Biol. 19, 203-215. 548
23 Almany, G.R., Connolly, S.R., Heath, D.D., Hogan, J.D., Jones, G.P., McCook, L.J., Mills, M., et 549
al., 2009. Connectivity, biodiversity conservation and the design of marine reserve 550
networks for coral reefs. Coral Reefs 28, 339-351. 551
Arizmendi-Mejía, R., Linares, C., Garrabou, J., Antunes, A., Ballesteros, E., Cebrian, E., Díaz, D., 552
et al., 2015. Combining genetic and demographic data for the conservation of a 553
Mediterranean marine habitat-forming species. PloS One 10, e0119585. 554
Arnaud-Haond, S., Belkhir, K., 2007. GENCLONE: a computer program to analyse genotypic data, 555
test for clonality and describe spatial clonal organization. Mol. Ecol. Notes 7(1), 15-17. 556
Aurelle, D., Baker, A., Bottin, L., Brouat, C., Caccone, A., Chaix, A., et al., 2010. Permanent 557
genetic resources added to the molecular ecology resources database 1 February 2010–31 558
March 2010. Mol. Ecol. Resour. 10, 751-754. 559
Aurelle, D., Ledoux, J.P., 2013. Interplay between isolation by distance and genetic clusters in the 560
red coral Corallium rubrum: insights from simulated and empirical data. Conserv. Genet. 561
14, 705-716. 562
Aurelle, D., Pivotto, I.D., Malfant, M., Topçu, N.E., Masmoudi, M.B., Chaoui, L., Kara, M.H., et 563
al., 2017. Fuzzy species limits in Mediterranean gorgonians (Cnidaria, Octocorallia): 564
inferences on speciation processes. Zool. Scripta 46 (6), 767-778. 565
Ballesteros, E., 2006. Mediterranean coralligenous assemblages: a synthesis of present knowledge. 566
Oceanogr. Mar. Biol. 44, 123-195. 567
Bavestrello, G., Cerrano, C., Zanzi, D., Cattaneo-Vietti, R., 1997. Damage by fishing activities in 568
the Gorgonian coral Paramuricea clavata in the Ligurian Sea. Aquat. Conserv. Mar. 569
Freshw. Ecosyst. 7, 253-262. 570
Belkhir, K., Borsa, P., Chikhi, L., Raufaste, N., Bonhomme, F., 2004. GENETIX 4.05, Logiciel 571
Sous Windows TM Pour La Génétique Des Populations. Laboratoire, Génome, 572
Populations, Interactions, CNRS UMR 5000, Université de Montpellier II, Montpellier, 573
France. 574
Bellwood, D.R., Hughes, T.P., Folke, C., Nystroem, M., 2004. Confronting the coral reef crisis. 575
Nature 429, 827-833. 576
Benjamini, Y., Hochberg, Y., 1995. Controlling the false discovery rate: a practical and powerful 577
approach to multiple testing.J. R. Stat. Soc. Series B 57 (1), 289-300. 578
Berline, L., Rammou, A.-M., Doglioli, A., Molcard, A., Petrenko, A., 2014. A connectivity-based 579
eco-regionalization method of the Mediterranean Sea. PloS One 9, e111978. 580
Boavida, J., Paulo, D., Aurelle, D., Arnaud-Haond, S., Marschal, C., Reed, J., Goncalves, J.M., et 581
al., 2016. A well-kept treasure at depth: precious red coral rediscovered in Atlantic deep 582
coral gardens (SW Portugal) after 300 years. PloS One, 11, e0147228. 583
Bongaerts P., Ridgway T., Sampayo E.M., Hoegh-Guldberg O., 2010. Assessing the ‘deep reef 584
refugia’ hypothesis: focus on Caribbean reefs. Coral Reefs 29, 309-327. 585
24 Calderón, I., Ortega, N., Duran, S., Becerro, M., Pascual, M., Turon, X., 2007. Finding the relevant 586
scale: clonality and genetic structure in a marine invertebrate (Crambe crambe, Porifera). 587
Mol. Ecol. 16, 1799-1810. 588
Cánovas-Molina, A., Montefalcone, M., Bavestrello, G., Cau, A., Bianchi, C.N., Morri, C., Canese, 589
S., et al., 2016a. A new ecological index for the status of mesophotic megabenthic 590
assemblages in the Mediterranean based on ROV photography and video footage. Cont. 591
Shelf Res. 121, 13-20. 592
Cánovas Molina, A., Montefalcone, M., Vasallo, P., Morri, C., Bianchi, C.N., Bavestrello, G., 593
2016b. Combining literature review, acoustic mapping and in situ observations: an 594
overview of coralligenous in Liguria (NW Mediterranean Sea). Sci. Mar. 80 (1), 7-16. 595
Cebrian, E., Linares, C., Marschal, C., Garrabou, J., 2012. Exploring the effects of invasive algae 596
on the persistence of gorgonian populations. Biol. Invasions 14, 2647-2656. 597
Cerrano, C., Bavestrello, G., Bianchi, C.N., Cattano-Vietti, R., Bava, S., Morganti, C., Morri, C., et 598
al., 2000. A catastrophic mass- mortality episode of gorgonians and other organisms in the 599
Ligurian Sea (North-western Mediterranean), summer 1999. Ecol. Lett. 3, 284-293. 600
Chapuis, M., Estoup, A., 2007. Microsatellite null alleles and estimation of population 601
differentiation. Mol. Biol. Evol. 24, 621-631. 602
Coma, R., Pola, E., Ribes, M., Zabala, M., 2004. Long-term assessment of the patterns of mortality 603
of a temperate octocoral in protected and unprotected areas: a contribution to conservation 604
and management needs. Ecol. Appl. 14, 1466-1478. 605
Costantini, F., Fauvelot, C., Abbiati, M., 2007a. Fine-scale genetic structuring in Corallium 606
rubrum: evidence of inbreeding and limited effective larval dispersal. Mar. Ecol. Prog. 607
Ser. 340, 109-119. 608
Costantini, F., Fauvelot, C., Abbiati M., 2007b. Genetic structuring of the temperate gorgonian 609
coral (Corallium rubrum) across the western Mediterranean Sea revealed by 610
microsatellites and nuclear sequences. Mol. Ecol. 16, 5168-5182. 611
Costantini, F., Gori, A., Lopez-González, P., Bramanti, L., Rossi, S., Gili, J.M, et al., 2016. Limited 612
genetic connectivity between gorgonian morphotypes along a depth gradient. PLoS 613
One,11 (8), e0160678. 614
Costantini, F., Rossi, S., Pintus, E., Cerrano, C., Gili, J.-M., Abbiati, M., 2011. Low connectivity 615
and declining genetic variability along a depth gradient in Corallium rubrum populations. 616
Coral Reefs 30, 991-1003. 617
Cowen, R.K., Lwiza, K.M.M., Sponaugle, S., Paris, C.B., Olson, D.B., 2000. Connectivity of 618
marine populations: open or closed? Science 287, 857-859. 619
Cowen, R.K., Sponaugle, S., 2009. Larval dispersal and marine population connectivity.Annu. 620
Rev. Mar. Sci. 1, 433-466. 621
Crawford, N.G., 2010. SMOGD: software for the measurement of genetic diversity. Mol. Ecol. 622
Resour. 10: 556-557. 623
25 Duran, S., Pascual, M., Estoup, A., Turon, X., 2004. Strong population structure in the marine 624
sponge Crambe crambe (Poecilosclerida) as revealed by microsatellite markers. Mol. 625
Ecol. 13, 511-522. 626
Earl, D.A., von Holdt, B.M., 2012. STRUCTURE HARVESTER: a website and program for 627
visualizing STRUCTURE output and implementing the Evanno method. Conserv. Genet. 628
Resour. 4 (2), 359-361. 629
Falush, D., Stephens, M., Pritchard, J.K., 2003. Inference of population structure using multilocus 630
genotype data: Linked loci and correlated allele frequencies. Genetics 164, 1567-1587. 631
Falush, D., Stephens, M., Pritchard, J.K., 2007. Inference of population structure using multilocus 632
genotype data: dominant markers and null alleles. Mol. Ecol. Notes 7, 574-578. 633
Gaines, S.D., White, C., Carr, M.H., Palumbi, S.R., 2010. Designing marine reserve networks for 634
both conservation and fisheries management. Proc. Natl. Acad. Sci. USA 107, 18286-635
18293. 636
Garrabou, J., Coma, R., Benssoussan, N., Bally, M., Chevaldonné, P., Cigliano M., Diaz, D., et al., 637
2009. Mass mortality in NW Mediterranean rocky benthic communities: effects of the 638
2003 heat wave. Glob. Change Biol. 15, 1090-1103. 639
Gili, J.M., Ros, J., 1985. Study and cartography of the benthic communities of Medes Islands (NE 640
Spain). Mar. Ecol. 6, 219-238. 641
Goffredo, S., Mezzomonaco, L., Zaccanti, F., 2004. Genetic differentiation among populations of 642
the Mediterranean hermaphroditic brooding coral Balanophyllia europaea (Scleractinia: 643
Dendrophylliidae). Mar. Biol. 145, 1075-1083. 644
Holland, L., Dawson, D., Horsburgh, G., Krupa, A., Stevens, J., 2013. Isolation and 645
characterization of fourteen microsatellite loci from the endangered octocoral Eunicella 646
verrucosa (Pallas 1766). Conserv. Genet. Resour. 5, 825-829. 647
Holland, L., Jenkins, T., Stevens, J., 2017. Contrasting patterns of population structure and gene 648
flow facilitate exploration of connectivity in two widely distributed temperate octocorals. 649
Heredity 119, 35-48. 650
Jakobsson, M., Scholz, S.W., Scheet, P., Gibbs, R., VanLiere, J.M., Fung, H.C., Szpiech, Z.A., et 651
al., 2008. Genotype, haplotype and copy-number variation in worldwide human 652
populations. Nature 451, 998-1003. 653
Jensen, J., Bohonak, A., Kelley, S., 2005. Isolation by distance, web service. BMC Genetics, 6: 13. 654
Jost, L., 2008. GST and its relatives do not measure differentiation. Mol. Ecol. 17 (18), 4015-4026. 655
Kalinowski, S.T., 2005. HP-RARE 1.0: a computer program for performing rarefaction on 656
measures of allelic richness. Mol. Ecol. Notes 5, 187-189. 657
Kopelman, N.M., Mayzel, J., Jakobsson, M., Rosenberg, N.A., Mayrose, I., 2015 Clumpak: a 658
program for identifying clustering modes and packaging population structure inferences 659
across K. Mol. Ecol. Resour. 15, 1179-1191. 660
26 Ledoux, J.B., Aurelle, D., Bensoussan, N., Marschal, C., Féral, J.P., Garrabou, J., 2014. Potential 661
for adaptive evolution at species range margins: contrasting interactions between red coral 662
populations and their environment in a changing ocean. Ecol. Evol. 5 (6), 1178-1192. 663
Ledoux, J.B., Mokhtar-Jamaï, K., Roby, C., Féral, J.P., Garrabou, J., Aurelle, D., 2010b. Genetic 664
survey of shallow populations of the Mediterranean red coral Corallium rubrum 665
(Linnaeus, 1758): new insights into evolutionary processes shaping nuclear diversity and 666
implications for conservation. Mol. Ecol. 19, 675-690. 667
Masmoudi, M.B., Chaoui, L., Topçu, N.E., Hammami, P., Kara, M.H. Aurelle, D., 2016. 668
Contrasted levels of genetic diversity in a benthic Mediterranean octocoral: Consequences 669
of different demographic histories? Ecol. Evol. 6, 8665-8678. 670
Meirmans, P.G., 2014. Nonconvergence in Bayesian estimation of migration rates. Mol. Ecol. 671
Resour. 14, 726-733. 672
Mistri, M., Ceccherelli, V.U., 1996. Effects of a mucilage event on the Mediterranean gorgonian 673
Paramuricea clavata. Short term impacts at the population and colony levels. Ital. J. Zool. 674
63, 221-230. 675
Mokhtar-Jamai, K., Pascual, M., Ledoux, J.B., Coma, R., Feral, J.P., Garrabou, J., Aurelle, D., 676
2011. From global to local genetic structuring in the red gorgonian Paramuricea clavata: 677
the interplay between oceanographic conditions and limited larval dispersal. Mol. Ecol. 678
20, 3291-3305. 679
Nei, M., 1973. Analysis of gene diversity in subdivided populations. Proc. Natl. Acad. Sci. USA 680
70, 3321-3323. 681
Padrón, M., Guizien, K., 2015. Modelling the effect of demographic traits and connectivity on the 682
genetic structuration of marine metapopulations of sedentary benthic invertebrates. ICES 683
J. Mar. Sci. 73 (7), 1935-1945. 684
Paetkau, D., Slade, R., Burden, M., Estoup, A., 2004. Genetic assignment methods for the direct, 685
real-time estimation of migration rate: a simulation-based exploration of accuracy and 686
power. Mol. Ecol. 13, 55-65. 687
Palumbi, S.R., 2004. Marine reserves and ocean neighborhoods: the spatial scale of marine 688
populations and their management.Annu. Rev. Environ. Resour. 29, 31-68. 689
Paterno, M., Schiavina, M., Aglieri, G., Ben Souissi, J., Boscari, E., Casagrandi, R., et al., 2017, in 690
press. Population genomics meet Lagrangian simulations: Oceanographic patterns and 691
long larval duration ensure connectivity among Paracentrotus lividus populations in the 692
Adriatic and Ionian seas. Ecol. Evol. 7, 2463-2479. 693
Pey, A., Catanéo, J., Forcioli, D., Merle, P.L., Furla, P., 2013. Thermal threshold and sensitivity of 694
the only symbiotic Mediterranean gorgonian Eunicella singularis by morphometric and 695
genotypic analyses. C. R. Biol. 336, 331-41. 696
Pineda, J., 2000. Linking larval settlement to larval transport: assumptions, potentials and pitfalls. 697
Oceanography of the Eastern Pacific 1, 84-105. 698
Commenté [DA9]: rajouter l’autre article:
Ledoux, J. B., Garrabou, J., Bianchimani, O., Drap, P., Féral, J. P., & Aurelle, D. (2010a). Fine‐scale genetic structure and inferences on population biology in the threatened Mediterranean red coral, Corallium rubrum. Molecular ecology, 19(19), 4204-4216.