HAL Id: hal-02619590
https://hal.archives-ouvertes.fr/hal-02619590
Submitted on 25 May 2020HAL is a multi-disciplinary open access archive for the deposit and dissemination of sci-entific research documents, whether they are pub-lished or not. The documents may come from teaching and research institutions in France or abroad, or from public or private research centers.
L’archive ouverte pluridisciplinaire HAL, est destinée au dépôt et à la diffusion de documents scientifiques de niveau recherche, publiés ou non, émanant des établissements d’enseignement et de recherche français ou étrangers, des laboratoires publics ou privés.
Yuan Dynasty): probing crystalline and glassy phases
Tian Wang, Pu Chen, Minli Wang, Zhen Sang, Pei Zhang, Fen Wang,
Philippe Sciau
To cite this version:
Tian Wang, Pu Chen, Minli Wang, Zhen Sang, Pei Zhang, et al.. Micro-structural study of Yaozhou celadons (Tang to Yuan Dynasty): probing crystalline and glassy phases. Journal of the European Ceramic Society, Elsevier, 2020, �10.1016/j.jeurceramsoc.2020.03.066�. �hal-02619590�
Micro-structural study of Yaozhou celadons (Tang to Yuan
Dynasty): probing crystalline and glassy phases
Tian Wang
1, Pu Chen
1, Minli Wang
1, Zhen Sang
1, Pei Zhang
1, Fen Wang
1*,
Philippe Sciau
1,2*1 Institute of silicate cultural heritage, School of material science and engineering,
Shaanxi key laboratory of green preparation and functionalization for inorganic materials, Shaanxi University of Science and Technology, Xi’an, 710021 China.
2 CNRS, CEMES, Toulouse University, 31055 Toulouse, France.
E-mail: philippe.sciau@cemes.fr; wangf@sust.edu.cn
Abstract
The Yaozhou kiln complex is a representative production center of ancient northern China, famous for the celadon production. In this work, bubbles, glassy matrix and residual crystals of celadon glazes produced from the Tang to Yuan Dynasty were analyzed by using optical microscopy, Raman spectroscopy and scanning electron microscopy-energy dispersive X-ray spectroscopy (SEM-EDS). The results revealed that the Song, Jin and Yuan productions present bigger bubble and higher area ratios of the Si-O bending over stretching modes than the Tang and Wudai productions. This is consistent with firings at higher temperatures during Song, Jin and Yuan Dynasties. It is also in agreement with the historical studies, which revealed the change from wood-firing to coal-firing during Song Dynasty. The observation of calcium phosphate in Yaozhou productions indicated that the glaze ash had been used. No iron-based particle was identified by Raman spectroscopy in the glazes of all periods. The green color is certainly due to iron ion dispersed in the glassy matrix. Our study also confirmed no significant change in glaze raw materials used for Yaozhou productions from Tang to Yuan Dynasty.
Keywords: Cultural heritage material, Yaozhou kiln, Celadon, Raman spectroscopy, Microstructure, Technological evolution
1. Introduction
Celadon, as one of the most famous Chinese fine ware, represents a milestone of the ceramic manufacture with a jade-like coating and relief decorations [1]. The earliest major type of celadon was produced by the Yue kilns (Zhejiang province) until the end of North Song Dynasty (1127 AD). From the Tang Dynasty (618-907 AD) the celadon production spread in the North China with the apparition of number of new kilns. Among them, the best known and the more representative is certainly the Yaozhou kiln complex. Its high quality production is characterized by a high
transparent glaze of sky-green color developed during the Wudai period (907-960 AD) and of then the olive-green color of North Song Dynasty [2]. The latter had significantly influenced the development of some southern kilns, such as Rongxian kilns (Guangxi province) [3] or Xicun kilns (Guangdong province) [4]. The Yaozhou productions had been widely exported to East Asia and the Islamic world [5].
The color variations of Yaozhou celadon from Tang to Yuan Dynasty have attracted many attentions in order to understand the development of high quality productions. Many parameters were considered in these studies such as the bubble distribution [4], the nature of vitreous glaze (mixture of disorder [SiO4]4- units
substituted with Al, Ca, K phases …) [6,7], residual crystals [7], colorant elements (Fe and Ti) [7–10] and make-up soil [11,12]. Large size variations of bubbles in the glaze can increase the opacity of celadon [4]. The high Fe2+/Fe3+ ratio and glassy phase
separation droplet could be well linked to the color origin of sky-green celadon [7–9]. Distorted octahedral geometry [Fe3+O
6] with different Fe-O bonds insides can vary
glaze colors from light bluish green to yellowish green [10]. The make-up soil was used to cover up the influence of dark body on glaze color and improve the gloss of porcelain [11,12]. However, most of researches were devoted to the elemental and morphological analyses of the glaze and make-up soil. Few researches focused on the residual crystals and glassy matrix. Only Shi Pei et al. reported the presence of cristobalite, mullite, quartz and anorthite crystals in Wudai productions, giving rise to decrease glaze transparency [7]. In addition the authors revealed that the phase separation droplets in glassy matrix could increase the blue tone of sky-green glaze.
Micro-Raman spectroscopy is known to be an suitable non-destructive method to investigate both the glassy matrix and the residual crystals [13–22]. The silicate glaze consists in [SiO4]4- tetrahedral units that are covalent in nature and could exhibit
remarkable Raman features [15,21,22]. Based on the Raman features, one can extract information concerning the structural changes occurring in vitreous glaze via the study of their vibrational bonds [23]. Besides, micro-Raman is able to precisely probe the position of residual crystals in glaze and well define their nature, including even atomic substitutions in their crystalline structure [14,16–20].
In this work, we have studied the residual crystals and glassy matrix of Yaozhou celadon glazes from Tang to Yuan Dynasty (618-1368 AD) using Raman spectroscopy combing with SEM-EDS. The bubble sizes of glaze were also measured by optical microscopy and taken into account in the comparisons among productions. Based on the results, we tried to bring out technical evolutions in Yaozhou celadon productions from Tang to Yuan Dynasty.
2. Experimental details
2.1 Sample description and preparation
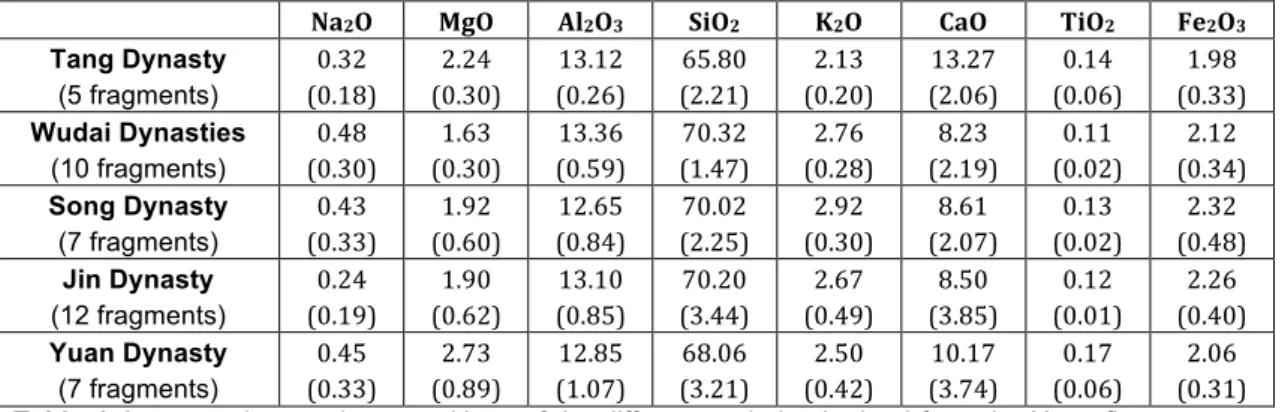
Forty-one samples of Yaozhou production were selected (5 of Tang period, 10 of Wudai period, 7 of Song period, 12 of Jin period and 7 of Yuan period). All samples were provided by the museum of Yaozhou kiln. Their elemental composition has been analyzed by X-ray fluorescence. The results are given in table 1 and are consistent with the data of literature [2,6]. The bubble observation (optical spectroscopy) and
glassy matrix analyses (micro-Raman spectroscopy) were performed on the tidy surface of fragments (Fig. 1a), while crystalline phases measurements (micro-Raman spectroscopy and SEM-EDS) were carried out over cross-sections (Fig. 1b). Under the microscope with magnification of x1000, the crystals with size of tens of microns were clearly observed (Fig.1c and d).
Na2O MgO Al2O3 SiO2 K2O CaO TiO2 Fe2O3
Tang Dynasty (5 fragments) 0.32 (0.18) 2.24 (0.30) 13.12 (0.26) 65.80 (2.21) 2.13 (0.20) 13.27 (2.06) 0.14 (0.06) 1.98 (0.33) Wudai Dynasties (10 fragments) 0.48 (0.30) 1.63 (0.30) 13.36 (0.59) 70.32 (1.47) 2.76 (0.28) 8.23 (2.19) 0.11 (0.02) 2.12 (0.34) Song Dynasty (7 fragments) 0.43 (0.33) 1.92 (0.60) 12.65 (0.84) 70.02 (2.25) 2.92 (0.30) 8.61 (2.07) 0.13 (0.02) 2.32 (0.48) Jin Dynasty (12 fragments) 0.24 (0.19) 1.90 (0.62) 13.10 (0.85) 70.20 (3.44) 2.67 (0.49) 8.50 (3.85) 0.12 (0.01) 2.26 (0.40) Yuan Dynasty (7 fragments) 0.45 (0.33) 2.73 (0.89) 12.85 (1.07) 68.06 (3.21) 2.50 (0.42) 10.17 (3.74) 0.17 (0.06) 2.06 (0.31)
Table 1 Average elemental compositions of the different periods obtained from the X-ray fluorescence
analysis on the glaze surface of the Forty-one samples [2, 6]. The values are given in equivalent oxide wt % and the standard variations are indicated in brackets as well as the number of analyzed samples.
Fig. 1 Preparation of a cross-section from the WSXA16B-04 sample (Wudai Dynasties): selection and
cutting of zone including glaze and body (a), cross-section mounted in epoxy resin (b), optical image (dark field mode) of glaze and body (c) and an enlargement of crystals observed in the glaze (d).
2.2 Analytical techniques 2.2.1 Microscope analyses
The bubble observation was performed on the surface of fragments using a non-destructive handheld microscope (Anyty, 3R-WM601) with the magnification at the range of x50 to x200. The flat surfaces of cross-sections were observed using a desk type microscope (Nikon, H600L) with the magnification at the range of x100, x200, x500 and x1000, respectively.
2.2.2 SEM-EDS analyses
Prior analysis, the selective samples were covered by a thin layer of carbon. The morphological and elemental analyses of the glaze were conducted using a JEOL JSM 6460 LV scanning electron microscopy (SEM) with an Oxford INCA PentaFETx3 energy dispersive X-ray spectrometer (EDS). Elemental mappings were performed with a pixel size of about 0.2 µm and quantified afterwards thanks to internal standards.
2.2.3 Raman spectroscopy analyses
Raman measurements were performed at room temperature using a Renishaw inVia spectrometer (Renishaw) equipped with a cw 532-nm excitation laser. A laser power of 3.35 mW at x50 magnification and 1.31 mW at x100 magnification was employed to analyze surface amorphous glaze and residual crystals insides, respectively, to optimize the signal-to-noise ratio with avoiding any thermal effect. The size of laser spot is around 2 to 3-µm-diameter with an x100 microscope objective to focus laser beam and collect scattered light. The IgorPro software was applied to process the data. Baseline subtraction and minor smoothing were performed during the data analyses. The Raman spectra of glassy matrix were de-convoluted and analyzed by the technique of multiple curve fitting [22,24].
3. Results and discussion 3.1 Bubble observations
Non-destructive handheld microscope was exploited to analyze the surface of fragments. Fig. 2a shows a typical surface of Tang production (YX-01-005) that consists of a few fissures and numerous bubbles with sizes varying from 0.16 mm to 0.42 mm. The bubble size distribution is shown Fig. 2b. The bubbles in glazes produced during the Tang period are relatively small with average size of 0.24 mm and standard deviation of 0.16 (Fig. 2b). Compared with Tang production, the most bubbles of Wudai production are even smaller but a few exceptions are observed with large sizes from 0.8 mm to 1.6 mm, leading to the average bubble size of 0.35 mm and standard deviation of 0.35 (Fig. 2c). Conversely, the bubble sizes of Song production present an obvious increase in average size of 0.56 mm and standard deviation of 0.41 (Fig. 2d). This change seems to have occurred due to the potters changed from wood-firing to coal-firing during Song Dynasty, giving rise to a higher firing temperature and much severe chemical reaction taken place in the firing
Fig. 2 Bubble observation of Tang celadon (sample number: YX-01-005) (a) and histograms of bubble
process[2]. Similar to Song production, Jin production also contains large bubble with average size of 0.56 mm and standard deviation of 0.42 (Fig. 2e). However, this increase ceased during Yuan period and the average bubble size decrease to be 0.48 mm but the standard deviation is also as large as 0.44 (Fig. 2f). The results indicate that the firing temperature used for preparing Yaozhou celadon increased slightly from Tang to Wudai period, then increased severely during Song and Jin period and then decreased slightly during Yuan period. In addition, one can also note that even though Song, Jin and Yuan productions show similar large bubble average sizes, the bubbles in Song production has relatively less variation, indicating that the manufacturing process was better controlled during this period.
3.2 Crystals in glazes
SEM-BSE under low resolution (x150) was applied to observe the glaze of celadon samples in cross-section. A representative SEM image of Wudai sample is shown in Fig. 3a. The glaze appears as a dense layer with a thickness of ~400 µm. The body is less dense with numerous particles (quartz, feldspar etc.). Bubbles with size of several to tens of micron and small particles are also observed in the glaze. The thickness of the glaze of other periods can vary from 190 to 1300 µm.
SEM-EDS study under higher resolution (x1400) was performed to identify the residual crystals in the glazes of each period. Six types of particles with different shapes were observed in glazes (Fig. 3b-f). Their elemental compositions were analyzed by EDS (Fig. 3g-l). The first type seems only contain Ti and O (Fig. 3g), the second type Si, Al, Ca and O (Fig. 3h), the third Ca, P, Mg and O (Fig. 3i), the fourth Si, Zr and O (Fig. 3j), the fifth Si, Ca, Mg and O (Fig. 3k), and the last one Si, Ca and O (Fig. 3l).
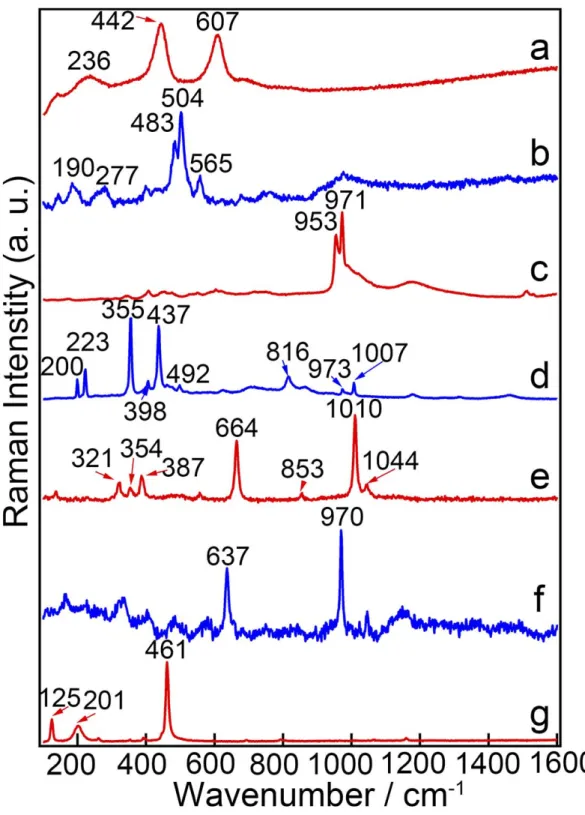
The Raman spectra of the first type confirmed that these crystals were rutile with the characteristic peaks at 223, 443, 607 cm-1 of this structure (Fig. 4a). Crystals rich
in Si, Al, Ca and O (Fig. 3h), Ca, P, Mg and O (Fig. 3i) and Si, Zr and O (Fig. 3j) were identified as anorthite (Fig. 4b), calcium phosphate (Fig. 4c) and zircon (Fig. 4d), respectively. The detection of calcium phosphate indicates the usage of glaze ash (maybe grass wood ash). Zircon is a common minor phase in sands and clays. Its exceptional chemical stability prevents reactions with other phases during the firing. Interestingly, crystal rich Si, Ca, Mg and O (Fig. 3k), and Si, Ca and O (Fig. 3l) was identified as diopside (CaMg[Si2O6]) (Fig. 4e) and wollastonite (β-CaSiO3) (Fig. 4f),
respectively. Both of them are belonged to the subclass of the chain structured silicates, which could enhance the bonding between body and glaze, reduce the glazing temperature, increase the intensity of the glaze, reduce the shrinkage and water swelling of glazes. Few α-quartz crystals were also detected by micro-Raman spectroscopy in productions of each period (Fig. 4g). The non-detection of Fe-based crystals is consistent with the previous results (ref. 7) and indicated a total dilution of iron oxide in the glaze, which is the characteristic of high quality celadons.
All types of crystals were detected in samples of each period and their distribution does not seem to present time characteristic. The results indicate that no significant changes in the selection of raw materials was made from Tang to Yuan period, which
is consistent with the elemental compositions obtained by XRF (Table 1) and published in the literature[2,6].
Fig. 3 SEM-BSE image (a) of a representative cross-section of Wudai celadon. Examples of particles
observed in glaze of different periods (b-f) and corresponding elemental composition detected by EDS (g-l).
Fig. 4 Raman spectra recorded in the crystalline zone of the glazes: (a) rutile, (b) glassy silica and
anorthite, (c) calcium phosphate, (d) zircon, (e) glassy silica and dioposide, (f) glassy silica and wollastonite, (g) glassy silica and quartz.
3.3 Glass structure
Fig.5 displays typical measured and normalized micro-Raman spectra of glassy matrix of sample YX-02-002 (Wudai period) recorded from the glaze surface to the interphase of glaze and body. The four spectra present two main broad peaks at ~550 cm-1 and ~1000 cm-1, which originate from the [SiO
stretching modes, respectively1 [15,21,22]. The intensity of bending modes has no
obvious variation while the intensity of stretching modes decreases from the surface to interface. An additional peak (AP) locating at 476 cm-1 is very likely original from rare earth dioxide [25] but the elemental type need be further identified. De-convolutions of the four spectra illustrated different spectral components (Qn for
stretching components, Qn’ for bending ones) assigned to vibrational bonds of glassy
matrix. At least four or five components are expected for the bending and stretching envelope, respectively, i.e., isolated [SiO4]4-, [Si2O7]6- groups, silicate chains [Si2O6]4-,
sheet-like region [Si2O5]2- and tectosilicates [AlSi3O8]-, respectively [15,21,22]. The
four typical components of the stretching peak could be identified as Q0, Q1, Q2,
Q3~Q4, positioning around 800, 948, 1040 and 1153 cm-1, respectively (Fig.5)
[15,21,22].
Fig. 5 Raman spectra of glassy matrix of YX-02-002 sample (Wudai period) recorded from the glaze
surface to the glaze/body interface. The different components are given.
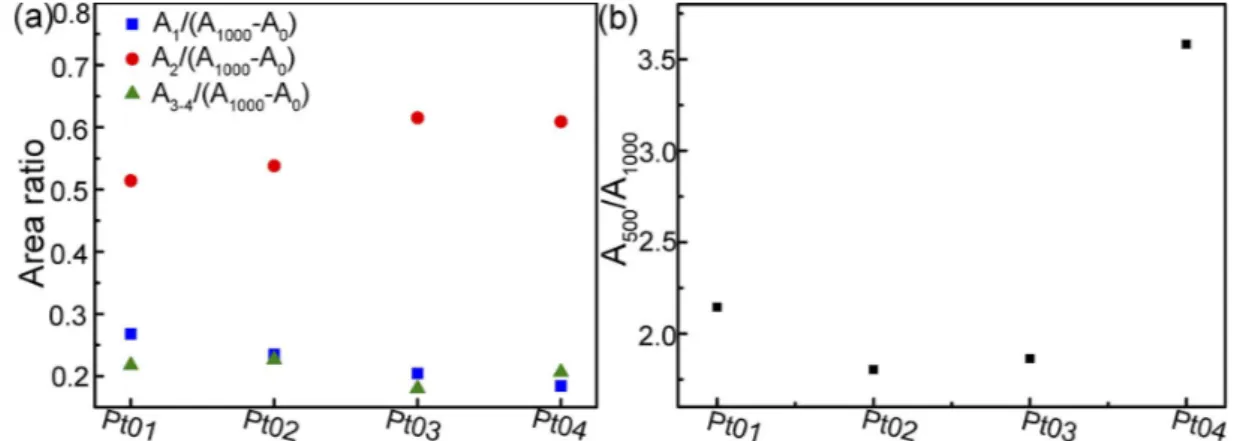
The area ratios of three components over stretching peak subtracting Q0 (abbreviated as A1/(A1000-A0), A2/(A1000-A0) and A3-4/(A1000-A0), respectively) were
calculated to precisely analyze the evolution of each component (Fig. 6)2. Since Q0 related to the isolated [SiO4]4- in our descriptions, it is considered as invariant and
therefore not calculated here. Fig. 6a shows that A1/(A1000-A0) ratio is averagely larger
than ~0.51 but slightly increases from the surface to the core of the glaze. Simultaneously the A2/(A1000-A0) and A3-4/(A1000-A0) ratios slightly decrease. The
results indicate that the nature of the glaze is comparatively homogeneous and the chains entities mainly preserve the main connected framework. Only the network of the glaze from the core to the interface slightly dissociates more in chains entities (Q2
component increases) and less in [Si2O7]6- groups and sheet entities (Q1 and Q3-4
components decrease). The area ratios of bending peak over stretching peak (abbreviated as A500/A1000) were also calculated to analyze the nature of the glaze (Fig.
6b). The ratio is relatively consistent from the surface to the core of glaze and then
1
n represents the number of non-bridging oxygen in each tetrahedron and it could be vary from 0 to 4.
2
A
increases severely at the interphase of body and glaze. The higher value of A500/A1000
of the interface part implies that its elemental composition was significantly influenced by the body due to the higher Al (28.78 wt%) and less calcium (1.01 wt%) amounts of the body than ones of the glaze (Al: 13.16 wt%, Ca: 7.51 wt%), giving rise to a different degree of polymerization.
Fig. 6 Plots of each component (A1, A2, A3-4) over stretching envelope (A1000) subtracting component A0
(a) and the area ratios of the Si-O bending (A500) over stretching (A1000) envelopes (b) recorded on from
the surface to the interface of sample YX-02-002.
The Raman analyses were carried out on five zones selected randomly of vitreous glaze surface of sample YX-02-003 (Wudai period) (Fig. S1) and the area ratios (A1/(A1000-A0), A2/(A1000-A0), A3-4/(A1000-A0) and A500/A1000) are given in Table S1.
The result showed that each area ratio of the five spectra is almost invariable and the standard variation of the four area ratios only varies slightly from 0.03 to 0.07. It indicated that the glassy phase of the glaze is homogeneous in the micro-size scale.
Raman measurements were also performed on the tidy surface of Tang to Jin samples to investigate the structure of glassy matrix (Fig. 7). The bending and stretching peaks were fitted and de-convoluted using the same method mentioned above, shown as Fig. 7a-e. Subsequently, the bar graphs of A1/(A1000-A0), A2/(A1000-A0)
and A3/(A1000-A0) ratios versus number of Tang (Fig. 7f), Wudai (Fig. 7g), Song (Fig.
7h), Jin (Fig. 7i) and Yuan (Fig. 7j) samples were plotted. The results illustrate that the chains entities (red bar) mainly preserve the main connected framework of Yaozhou production but their ratios increase and reach a maximum for Jin production and then decrease slightly for Yuan production. Despite the chains entities, the networks of the glaze from Tang, Song and Yuan productions dissociate more in [Si2O7]6- groups (Q1
component) and less in sheet entities (Q3-4 component) than the networks of Wudai and Jin productions.
Then the area ratios of bending peak (A500) over stretching peak (A1000) of
samples of different periods were also calculated and drawn as the boxplot (Fig. 8a). The results show that A500/A1000 ratios vary obviously from Tang to Yuan Dynasty. The
median of Tang production boxplot is closed to ~1.6 and then increase evidently to ~1.8 for Wudai production. The median of Song production boxplot is closed to one of Wudai production but its upper and lower quartiles are much higher. Then the median increases to ~2.0 for Jin production and then slightly decreases for Yuan production. This variation is agreement with the variation of chains entities ratios (Fig. 7f-j),
indicating that the variation of glass polymerization degree is mainly original from the variation of chains entities ratios. Moreover, the degree of polymerization corresponds to the processing temperature (ca. 1400℃ for A500/A1000~7, 1000°C for A500/A1000~1.3,
and 600°C or less for A500/A1000~0.3) and the viscosity at a given temperature, etc.,
which are characteristics of the elaboration techniques (kiln, atmosphere, etc.) [22]. The results are agreement with bubble observations (Fig .2) and confirm that the firing temperature is relatively modest for Tang and Wudai productions and obviously increases during Song, Jin and Yuan Dynasties, which is consistent with the historical recordings of the change of wood-firing to coal-firing during Song Dynasty [2]. The
Fig. 7 Representative Raman spectra of the glassy matrix of Tang (a), Wudai (b), Song (c), Jin (d)
and Yuan (e) samples after baseline subtraction and the bar graphs of A1/(A1000-A0), A2/(A1000-A0)
and A3/(A1000-A0) ratios versus number of Tang (f), Wudai (g), Song (h), Jin (i) and Yuan (j) samples
firing temperature of Song production can be deduced as around 1300°C. Fig. 8b illustrates the plot of the A500/A1000 ratio as a function of glaze modifiers/network
formers mole ratio: the mole ratio is calculated as
Σ[0.5Na2O+2K2O+CaO]/Σ[SiO2+0.5Al2O3], noted as Σ[M]/Σ[Al]+[Si]. A clear linear
decreasing relationship is observed, shown as the red line in Fig. 8b. The results are agreement with the theory of high A500/A1000 ratios corresponding to silica-rich and
modifier (Na, K, Ca, …)-poor compositions [22].
Fig. 8 Plots of the area ratios of the Si-O bending (A500) over stretching (A1000) envelopes (a) and as a
function of [glass modifier]/[network former] oxide mole composition ratio (b) for samples of different periods.
4. Conclusions
Both the bubble observations and Raman analyses of glassy matrix confirm that the firing temperature is relatively modest for Tang and Wudai productions and increases obviously during Song Dynasty (around 1300°C). The firing temperature is somewhat higher for Jin production and then slightly decreased during Yuan period. The glaze ash is confirmed to be used in Yaozhou productions owing to the observation of calcium phosphate in glaze. Other transparent crystals, i.e., quartz, anorthite and zircon, were also detected, as well as some rutile crystals. These crystals (calcium phosphate, quartz, anorthite and rutile) were detected in samples produced in every period. The results confirm that no significant change took place in the selection of raw materials from Tang to Yuan period. The non-detection of Fe-based crystals is consistent with a total dilution of iron oxide in the glaze, which is the characteristic of high quality celadon.
Acknowledgements
This work has been financially supported by the pre-research funding of Shaanxi University of Science and Technology (No. 2018TPJs-07). It was performed in the framework of the research collaboration agreement (CNRS No. 186116) between the CNRS and the Shaanxi University of Science and Technology.
Appendix A. Supplementary data
Fig. S1 Raman spectra recorded at five zones selected randomly of vitreous glaze surface of sample
YX-02-003 (Wudai period)
A1/(A1000-A0) A2/(A1000-A0) A3-4/(A1000-A0) A500/A1000
Pt01 0.36 0.43 0.21 1.96 Pt02 0.39 0.39 0.23 1.88 Pt03 0.37 0.39 0.24 1.81 Pt04 0.33 0.49 0.18 1.78 Pt05 0.42 0.33 0.25 1.87 St. Dev. 0.03 0.06 0.03 0.07
Table S1 The area ratios of of each component (A1, A2, A3-4) over stretching envelope (A1000) subtracting
component A0 (a) and the area ratios of the Si-O bending (A500) over stretching (A1000) envelopes (b)
References
[1] J.Z. Li, History of science and technology in China, Ceramics Volume, Science Press, Beijing, 1998.
[2] F. Wang, Pottery and porcelain of Yaozhou kiln, Shaanxi University of Science and Technology Press, Shaanxi, 2000.
[3] N. Wood, Chinese Glazes: Their origins, chemistry, and recreation, New and revised, A & C Black, London, UK, 2007.
[4] T. Zhu, H. Huang, H. Wang, L. Hu, X. Yi, Comparison of celadon from the Yaozhou and Xicun kilns in the Northern Song Dynasty of China by X-ray fluorescence and microscopy, J. Archaeol. Sci. 38 (2011) 3134–3140.
[5] Mikami Tsugio (T. Mikami), The road of ceramics, Cultural Relics Publishing House, Beijing, 1984.
[6] F. Wang, P. Shi, J.F. Zhu, Y. Lin, X.W. Wang, Research on the sky-green porcelains from the Five-Dynasty Yaozhou Kiln, J. of Annu. Conf. of Ceram. Branch of China Ceram. Soc. 2016.
[7] P. Shi, F. Wang, J. Zhu, B. Zhang, T. Zhao, Y. Wang, Y. Qin, Study on the Five dynasty sky-green glaze from Yaozhou kiln and its coloring mechanism, Ceram. Int. 43 (2017) 2943–2949.
[8] Y.F. Xiao, M.H. He, S.D. Zhang, W. Hang, Mass spectrometric methods for colorative mechanism analysis of Yaozhou porcelain glaze, Spectrosc. Spectr. Anal. 35 (2015) 2444-2449.
[9] B. Zhang, Z. Y. Gao, NAA and Mössbauer study on the colorative mechanism of Yaozhou celadon in ancient China, Hyperfine Interact. 142 (2002) 593-599.
[10] Y. Li, B. Zhang, H. Cheng, J. Zheng, Revealing the coloration mechanism in the earliest Chinese celadon glaze, J. Eur. Ceram. Soc. 39 (2019) 1675–1682.
[11] E.Y. Wang, Y.F. Xiong, Y.W. Gong, J.W. Wu, J.W. Wang. Study on porcelain’s make-up soil and reaction layer, Chin. Ceram. 54 (2018) 46-51.
[12] X. Ling, M.M. Jia, N. Wei, Z.Q. Yao, L.J. Sun, The analysis of porcelain from Yaozhou kiln by EDXRF, J. Northwest Univ. (Nat. Sci. Ed.), 38 (2008) 57-62.
[13] P. Colomban, Y. Zhang, B. Zhao, Non-invasive Raman analyses of Chinese huafalang and related porcelain wares. Searching for evidence for innovative pigment technologies, Ceram. Int. 43 (2017) 12079–12088.
[14] P. Colomban, F. Ambrosi, A. T. Ngo, T. A. Lu, X. L. Feng, S. Chen, C. L. Choi, Comparative analysis of wucai Chinese porcelains using mobile and fixed Raman microspectrometers, Ceram. Int. 43 (2017) 14244–14256.
[15] P. Colomban, L. Arberet, B. Kırmızı, On-site Raman analysis of 17th and 18th century Limoges enamels: Implications on the European cobalt sources and the technological relationship between Limoges and Chinese enamels, Ceram. Int. 43 (2017) 10158–10165. [16] Z. Liu, C. Jia, L. Li, X. Li, L. Ji, L. Wang, Y. Lei, X. Wei, The morphology and structure of
crystals in Qing Dynasty purple-gold glaze excavated from the Forbidden City, J. Am. Ceram. Soc. 101 (2018) 5229–5240.
[17] P. Colomban, M. Maggetti, A. d’Albis, Non-invasive Raman identification of crystalline and glassy phases in a 1781 Sèvres Royal Factory soft paste porcelain plate, J. Eur. Ceram. Soc. 38 (2018) 5228–5233.
[18] B. Kırmızı, S. Chen, P. Colomban, The Raman signature of protonic species as a potential tool for dating or authentication of glazed pottery, J. Raman Spectrosc. 50 (2019) 696–710. [19] A. Pinto, P. Sciau, T. Zhu, B. Zhao, J. Groenen, Raman study of Ming porcelain dark spots:
Probing Mn-rich spinels, J. Raman Spectrosc. 50 (2019) 711–719.
[20] T. Wang, T. Zhu, M. Brunet, C. Deshayes, P. Sciau, Raman study of Yuan Qinghua porcelain: the highlighting of dendritic CoFe2O4 crystals in blue decorations, J. Raman
Spectrosc. 48 (2017) 267–270.
[21] P. Colomban, O. Paulsen, Non-destructive determination of the structure and composition of glazes by Raman spectroscopy, J. Am. Ceram. Soc. 88 (2005) 390–395.
[22] P. Colomban, Polymerization degree and Raman identification of ancient glasses used for jewelry, ceramic enamels and mosaics, J. Non-Cryst. Solids. 323 (2003) 180–187.
[23] P. Colomban, A. Tournie, L. Bellot-Gurlet, Raman identification of glassy silicates used in ceramics, glass and jewellery: a tentative differentiation guide, J. Raman Spectrosc. 37 (2006) 841–852.
[24] M.T. Nayak, J.A.E. Desa, Roles of iron and lithium in silicate glasses by Raman spectroscopy, J. Raman Spectrosc. 49 (2018) 1507–1513.
[25] O. Mendiuk, M. Nawrocki, L. Kepinski, The synthesis of Ce1−xLnxO2−y (Ln=Pr, Sm, Gd, Tb)


![Fig. 8 Plots of the area ratios of the Si-O bending (A 500 ) over stretching (A 1000 ) envelopes (a) and as a function of [glass modifier]/[network former] oxide mole composition ratio (b) for samples of different periods](https://thumb-eu.123doks.com/thumbv2/123doknet/13709053.434266/12.892.148.757.278.509/bending-stretching-envelopes-function-modifier-network-composition-different.webp)

