HAL Id: hal-00304842
https://hal.archives-ouvertes.fr/hal-00304842
Submitted on 26 Apr 2006
HAL is a multi-disciplinary open access
archive for the deposit and dissemination of
sci-entific research documents, whether they are
pub-lished or not. The documents may come from
teaching and research institutions in France or
abroad, or from public or private research centers.
L’archive ouverte pluridisciplinaire HAL, est
destinée au dépôt et à la diffusion de documents
scientifiques de niveau recherche, publiés ou non,
émanant des établissements d’enseignement et de
recherche français ou étrangers, des laboratoires
publics ou privés.
phosphorus transport in an agricultural landscape, part
II: dissolved phosphorus transport
W. D. Hively, P. Gérard-Marchant, T. S. Steenhuis
To cite this version:
W. D. Hively, P. Gérard-Marchant, T. S. Steenhuis. Distributed hydrological modeling of total
dis-solved phosphorus transport in an agricultural landscape, part II: disdis-solved phosphorus transport.
Hydrology and Earth System Sciences Discussions, European Geosciences Union, 2006, 10 (2),
pp.263-276. �hal-00304842�
www.hydrol-earth-syst-sci.net/10/263/2006/ © Author(s) 2006. This work is licensed under a Creative Commons License.
Earth System
Sciences
Distributed hydrological modeling of total dissolved
phosphorus transport in an agricultural landscape,
part II: dissolved phosphorus transport
W. D. Hively1, P. G´erard-Marchant2, and T. S. Steenhuis2
1Department of Natural Resources, Cornell University, Ithaca, NY 14853, USA
2Soil & Water Group, Department of Biological and Environmental Engineering, Riley Robb Hall Cornell University, Ithaca, NY 14853, USA
Received: 1 July 2005 – Published in Hydrol. Earth Syst. Sci. Discuss.: 22 August 2005 Revised: 6 December 2005 – Accepted: 21 February 2006 – Published: 26 April 2006
Abstract. Reducing non-point source phosphorus (P) loss
to drinking water reservoirs is a main concern for New York City watershed planners, and modeling of P transport can assist in the evaluation of agricultural effects on nutri-ent dynamics. A spatially distributed model of total dis-solved phosphorus (TDP) loading was developed using raster maps covering a 164-ha dairy farm watershed. Transport of TDP was calculated separately for baseflow and for sur-face runoff from manure-covered and non-manure-covered areas. Soil test P, simulated rainfall application, and land use were used to predict concentrations of TDP in overland flow from non-manure covered areas. Concentrations in runoff for manure-covered areas were computed from predicted cumu-lative flow and elapsed time since manure application, using field-specific manure spreading data. Baseflow TDP was cal-ibrated from observed concentrations using a temperature-dependent coefficient. An additional component estimated loading associated with manure deposition on impervious ar-eas, such as barnyards and roadways. Daily baseflow and runoff volumes were predicted for each 10-m cell using the Soil Moisture Distribution and Routing Model (SMDR). For each cell, daily TDP loads were calculated as the product of predicted runoff and estimated TDP concentrations. Pre-dicted loads agreed well with loads observed at the watershed outlet when hydrology was modeled accurately (R2 79% winter, 87% summer). Lack of fit in early spring was at-tributed to difficulty in predicting snowmelt. Overall, runoff from non-manured areas appeared to be the dominant TDP loading source factor.
Correspondence to: T. S. Steenhuis
1 Introduction
Water quality protection programs require the effective con-trol of non-point source (NPS) pollution. Phosphorus (P) has been recognized as a key element controlling surface water eutrophication (Carpenter et al., 1998), and legislative mea-sures have been taken to encourage the reduction of P load-ing on a watershed scale. In the New York City watersheds, maintaining low phosphorus levels is a challenge for the eco-nomic development of local communities. Phosphorus loss from dairy farms has been identified as a significant contribu-tor of non-point-source P loading to Cannonsville Reservoir (Brown et al., 1989), the third largest of the reservoirs that supply New York City’s drinking water. The New York City Watershed Agriculture Program has undertaken a program of Whole Farm Planning and Best Management Practice (BMP) implementation to reduce NPS pollution from regional dairy farms.
Modeling of P loss from watersheds is key to understand-ing the long term effects of agricultural BMPs (Sharpley et al., 2002). Once the significant mechanisms affecting the fate of soil P and its release to streams are identified, their rela-tive importance can be estimated and cost-effecrela-tive preven-tive or remediatory management practices can be efficiently selected.
The fate and transport of P in the soil environment has been shown to be responsive to a broad range of abiotic and biotic processes (Frossard et al.,2000), including: soil test P (Cox and Hendricks, 2000; McDowell and Sharpley, 2001); landuse (Beauchemin et al., 1996); tillage (Kingery et al., 1996); soil mineralogy and particle size distribution (Cox and Hendricks, 2000); erosion (Sharpley et al., 2002); manure application (Beauchemin et al., 1996; Kleinman et al., 1999;
Kleinman and Sharpley, 2003); grazing (Smith and Mon-aghan, 2003); plant uptake (Koopmans et al., 2004); P mass balance and soil accumulation (Cassell et al., 1989); soil moisture and hydrology (McDowell and Sharpley, 2002b); soil type (Needelman et al., 2004) and management (Gint-ing et al., 1998; Klatt et al., 2003; Sharpley and Klein-man, 2003); temperature and precipitation (Correll et al., 1999); sorption kinetics (Morel et al., 2000; Schoumans and Groenendijk, 2000); and preferential flow and soil structure (Akhtar et al., 2003).
Basically, phosphorus can be transported as particulate P, through erosion, or as dissolved P through leaching and over-land flow. Traditionally, control of particulate P in runoff has been considered sufficient to improve water quality (Sharp-ley et al., 1994). However, recent research has shown that particulate P has a much smaller effect on eutrophication levels than dissolved P (Fozzard et al., 1999). This paper focuses only on the transport of total dissolved P (TDP).
The complexity of simulating P loading processes that vary spatially, temporally, and with management practices is amazing. A mechanistic modeling of the interaction of TDP with the environment would require an extensive set of input parameters which are not readily available. There-fore, a reasonable simplification consists in lumping the dif-ferent biotic and abiotic processes, so that P loss is modeled using an export coefficient approach (Clesceri et al., 1986; Hanrahan et al., 2001; Sharpley et al., 2002), where flow volumes are combined with predicted P concentrations that are derived from soil-, environment-, and site-specific data. Such a lumped approach has the advantage of reducing the required number of parameters, thus limiting the risk of over parametrization described by Beven (1996), among others.
In order to apply the export coefficient approach, insight into the generation mechanisms of overland flow is needed (Gburek et al., 1996). Two main processes can be consid-ered. Infiltration-excess overland flow occurs when rain-fall intensity exceeds soil infiltration capacity (Horton, 1933, 1940). The resulting runoff volume generated depends on rainfall intensity, soil type and land cover. In the case of infiltration-excess runoff production, semi-distributed mod-els, such as SWAT (Arnold et al., 1993, 1994; Neitsch et al., 2002; DiLuzio and Arnold, 2004) or GWLF (Haith and Shoemaker, 1987; Haith et al., 1992; Schneiderman et al., 2002), are sufficient to estimate streamflows and TDP loads. In contrast, saturation excess overland flow is generated by precipitation falling on already saturated areas, or when sub-surface flows converge in an poorly drained area (Hewlett and Hibbert, 1967; Dunne and Black, 1970; Hewlett and Nutter, 1970; Dunne et al., 1975; Beven and Kirkby, 1979). Runoff volumes are then a function of topography and soil characteristics. In this case, fully distributed models preserv-ing information about landscape position must be used. In addition, P loading processes are spatially heterogeneous, re-quiring the distributed estimation of above and below ground flow volumes and P loading pathways. In the Catskills
re-gion, where saturation-excess is the dominant process for runoff production, a fully distributed modeling approach is required to adequately characterize overland flow production from source areas that vary spatially and temporally.
Spatially-distributed hydrological modeling of small, up-land watersheds is possible using the Soil Moisture Distribu-tion and Routing model (SMDR). In SMDR, the watershed is divided into a continuous grid of square cells of 10 to 30 m side. At each time step, a water balance is computed on each gridcell of the watershed. Overland flow is generated mainly by saturation excess. Infiltration excess is taken into account on impervious areas such as roads and barnyards. Details of the water balance components are presented in a compan-ion to this paper (G´erard-Marchant et al., 2006). The model has been successfully applied to several New York and Penn-sylvania watersheds (Frankenberger et al., 1999; Kuo et al., 1999; Johnson et al., 2003; Mehta et al., 2004; Srinivasan et al., 2005). The model is designed to simulate sloping areas, and does not work in flatter areas such as alluvial floodplains, nor does it account for infiltration excess runoff that can be produced on dry soils by brief, intense summer rainstorms.
The objective of this paper is to develop and test a fully distributed model that can predict total dissolved P (TDP) transport from small watersheds where saturation-excess runoff production is the dominant hydrological process.
2 Description of the total dissolved P transport model
Four transport processes are considered in the various model components of the SMDR TDP load model: (i) TDP loss from non-manure covered soils in overland flow, (ii) TDP loss in base flow, (iii) TDP loss from manure-covered areas in overland flow, and (iv) TDP loss from impervious areas (roads, farmstead). The four processes are modeled sepa-rately, on a daily basis, for each gridcell, and summed to es-timate daily TDP loads from the entire watershed.
2.1 Component 1. Overland Flow from non Manure-covered Soils
Management history, including manure and nutrient appli-cation, crop removal, and tillage, can have a significant ef-fect on soil P content, with repeated manure application lead-ing to nutrient accumulation and increased risk of leachlead-ing. Sharpley et al. (1996); Maguire and Sims (2002) and Mc-Dowell and Sharpley (2003), among others, have demon-strated that TDP concentrations in overland flow and in base-flow are positively correlated to the quantity and extractabil-ity of P in the top layer of soil. Although more complex re-lationships have been suggested (Kleinman et al., 2000; Mc-Dowell and Sharpley, 2001), a simple linear relationship be-tween soil test P and TDP in runoff is generally valid for soils with P concentrations below a critical P saturation threshold
(Kleinman et al., 1999; Sharpley et al., 2002), and can be expressed as:
D<S>(t ) = µST P (t )SE(t ) (1)
where D<S> is the loss of TDP in overland flow per unit
area [kg m−2], STP the amount of extractable soil P as esti-mated by soil test P [kg m−3], SE the overland flow volume per unit cell area [m3.m−2], and µ a soil-specific coefficient determined from rainfall simulation (Schroeder et al., 2004) or laboratory extraction (Beauchemin et al., 1996; Pote et al., 1996) at a specific temperature. Equation (1) can be simpli-fied to:
D<S>(t ) = cS(t ) SE(t ) (2)
where cS(t )=µ ST P (t ) is the TDP export coefficient
[kg m−3], corresponding to the average predicted TDP con-centration in runoff from a particular cell. This coefficient depends thus partly on soil properties, through the coeffi-cient µ, and partly on land use and management practices that affect the concentration of P in soils, STP. Potential re-lease of TDP from soils, as reflected in the export coefficient, depends on both abiotic factors (soil moisture, temperature, precipitation, de/sorption and transport), and biotic factors (decomposition, mineralization, plant uptake) that vary with climate and season (Frossard et al., 2000; Hansen et al., 2002).
In order to reflect the temporal nature of TDP availabil-ity, the export coefficients associated with each combination of soil and land use are modified with an Arrhenius type of equation (Bunnell et al., 1977; Johnsson et al., 1987; Kuo, 1998): cS(t ) = cSrefQ hT (t, 0)−TS 10 i S (3)
where T (t, 0) is the mean temperature at the soil surface at time t [◦C], TS the base temperature at which the reference
export coefficient cSrefwas estimated [◦C], and QSthe factor
change (range 1 to 5) for a 10◦C change in temperature. Soil surface temperatures can be approximated from long term climate records, as
T (t,0) = Tavg+1Tsin[ω(t − tφ)] (4)
where Tavgis the annual average temperature of the soil sur-face [◦C], 1T the maximum temperature deviation from the annual average [◦C], ω=2π /365 the radial frequency [d−1] and tφa lag time [d] so that ωt =tφwhen T (t, 0)=Tavg.
2.2 Component 2. Baseflow
Although transport in overland flow is the predominant P loading mechanism in many watersheds (Randall et al., 2000), subsurface transport can often be substantial (Maguire and Sims, 2002; Ryden et al., 1973). In particular, soils exhibiting preferential flow through macropores can quickly
transport a significant amount of P to deeper soils (G¨achter et al., 1998; Stamm et al., 1998; Gupta et al., 1999; Akhtar et al., 2003) and to subsurface drains (Hooda et al., 1999; Geohring et al., 2001). Baseflow chemistry has been shown to vary temporally and spatially with changes in land use, representing an integrated signal of climate, geology, and his-torical land use (Wayland et al., 2003).
Once again, the complexity of mixing and equilibrium in-teractions between P forms in the soil and soil-water solu-tion advocates implementing an export coefficient approach. Loads of TDP in baseflow D [kg d1] are thus calculated as:
D<BF >(t ) = cBFBF (t ) A (5)
where cBF is the baseflow export coefficient [kg m−3],
BF (t ) the predicted daily baseflow volume delivered over the watershed (per unit area) [m3m−2d−1], and A is the wa-tershed area [m2].
Seasonal variability of the baseflow export coefficient cBF
is modeled similarly to the soil export coefficient cS, as :
cBF(t ) = cBFrefQ h T (t )−TBF 10 i BF (6)
where QBFand TBFare two calibration parameters. The
dif-ference with Eq. (3) is that base flow originates from deeper in the soil, and therefore uses an estimated below-ground soil temperature. The soil temperature at a depth zT [m] is
calcu-lated assuming that the annual surface temperature varies as a sine wave (de Vries, 1963; Brutsaert, 1982):
T (t, zT) = Tavg+1T e−zT/zesin[ω(t − tφ) − zT/ze] (7)
where zethe equivalent damping depth [m], which is directly
related to thermal diffusivity. It should be noted that the base-flow export coefficient cBF is calculated for the entire
water-shed, rather than on a gridcell basis, and should be calibrated from observed base flow streamwater concentrations of TDP. This direct calibration also serves to account for in-stream processes particular to the watershed, including in-stream manure deposition, stream bank erosion, algal growth, and the effects of hydric soils and sediments. This approach is consistent with the assumption in the hydrology model that all the water percolating out of the topsoils enters a subsur-face reservoir. Ideally one would link P concentration in the baseflow directly to the average DP concentration of the per-colating water or to the soil TDP export coefficients. These processes are currently being investigated but results are not conclusive yet. Therefore, for this paper, simulated DP base-flow concentrations are calibrated with observed DP values.
2.3 Component 3. Overland Flow from Manure-Covered Areas
Surface application of manure can lead to large TDP losses in overland flow (e.g., Sharpley et al., 1998; Haygarth and Sharpley, 2000; Kleinman, 2000) if the nutrients are not in-corporated and runoff production is large. In some circum-stances, P loading from manured areas can be several orders
of magnitude larger than loads produced from non-manured soils (Edwards and Daniel, 1993b). The SMDR TDP model calculates TDP losses from surface applied manure using an extraction coefficient approach, where the coefficient is mod-ified by cumulative runoff and elapsed time since manure ap-plication, on a semi-distributed basis.
Sharpley and Moyer (2000) observed from laboratory ex-periments that the concentration of manure TDP (both or-ganic and inoror-ganic forms) in leachates decreased rapidly during simulated rainfall events. A re-examination of their data shows that during a rainfall event of duration δt [d] with an average rainfall rate R [m3m−2d−1], the load of TDP leached from manure, D<M>(δt ), can be expressed as
(G´erard-Marchant et al., 2005):
D<M>(δt ) = M(t )exp(−kDδV /R) (8)
where M(t) is the amount (per unit area) of water-extractable P available in manure at time t [kg m−2], kD the reaction
constant [d−1], and δV =δt/R is the volume of precipitation during the time interval δt .
G´erard-Marchant et al. (2005) did not observe any clear correlation between the reaction constant kD and simulated
rainfall rate. Therefore, it can be assumed in a first approxi-mation that the ratio kD/R is independent of time and
rain-fall rate, so that in Eq. (8), the event duration δt can be re-placed by the time step 1t, the volume δV by the volume of runoff (per unit cell area) generated during the time step,
1V, and the ratio kD/Rby a constant characteristic volume
Vm. Equation (8) then becomes:
D<M>(1t ) = M(t )[1 − exp(−1V /Vm)]. (9)
If no runoff is generated on the cell during the time step, the volume 1V is identified with the amount of rainfall or snowmelt, but D<M>does not contribute to stream loads.
After application, manure P interacts with soil between rainfall events and is transformed to forms less and less avail-able for transport (Edwards and Daniel, 1993a). Based on the findings of Gascho et al. (1998) and Nash et al. (2000), the decline in availability of manure water-extractable P, M, is modeled as an exponential decay:
M(t ) = M(to)exp[−(t − to)/τ ] (10)
where M(to)is the initial content of water-extractable P in
manure applied at time to, and τ the characteristic decay time
[day]. For lack of additional data, τ is considered a constant, independent of temperature.
A fully distributed modeling requires knowledge not only of the amount of manure applied, but also of the location and method of the application. Unfortunately, the location information is usually not available on a gridcell basis, and a semi-distributed approach must be followed. The water-shed is divided in “manure application zones”, correspond-ing to the smallest area for which information about manure
application is available, such as a field, or a group of adja-cent fields. Each manure application zone is then subdivided in elementary “spreading plots”, with an area equal to that covered with a single load of manure. At each time step, ma-nure is first distributed on each application zone following farmer’s information, then randomly on each spreading plot within each application zone, so that no plot can receive ma-nure again before all plots of the zone are covered. Mama-nure TDP losses in runoff are then computed with Eqs. (9) and (10) for each spreading plot, using precipitation data and sat-uration excess overland flow volumes simulated by SMDR. The simulated overland flow is averaged over each manure application zone, i.e., each spreading plot of one zone re-ceives the average of the estimated runoff volumes for the gridcells within each manure application zone.
2.4 Component 4. Impermeable areas
Overland flow from heavily-manured impervious source ar-eas, including barnyards, roadways, and cowpaths, can play a significant role in delivering water and TDP to the stream (Robillard and Walter, 1984; McDowell and Sharp-ley, 2002a; Hively, 2004), particularly during dry summer periods when the extent of saturated soils is small. Ideally, TDP loads in overland flows from manure-covered impervi-ous areas could be simulated using the same approach as for manure-covered soils described in Eq. (9). However, the tem-poral dynamics of barnyard and roadway P availability are not yet well characterized. Therefore, a more generic “export coefficient” approach is followed, similar to the modeling of TDP release from soils to overland flow. The overall extents of manured and non-manured impervious areas are estimated from fine-scale land use mapping and an equivalent number of gridcells are established as impervious, with extraction co-efficients chosen for periods of active grazing (spring to fall) and animal confinement (winter).
It could be argued that shallow lateral transport of P in the vadose zone is an important factor that should be mod-eled explicitly. However, the spatial heterogeneity of macro-pore flow processes makes this inherently difficult. Although the SMDR model does route water horizontally in the va-dose zone, it was elected to confine the P routing model to the aforementioned four pathways because there is no data available to independently verify P concentrations in macropore flow. Furthermore, water transported horizontally through macropores can be expected to have one of four pos-sible fates: 1) percolation into the subsoil, 2) contact with tile drainage, 3) conversion to surface runoff in the form of seepage and springs, and 4) direct transport into the stream channel. In the case of percolation, this is accounted for in the baseflow component. Tile drainage, however, might be a confounding factor. During grabsampling of runoff on the study watershed (Hively, 2004) P concentrations in flow from tile drains were consistently elevated in comparison to concentrations observed in overland flow from field areas.
Additional work that was done on the farm (Scott et al., 1998) observed that approximately 1/3 of total annual P lost from a grazed pasture was transported through tile drains. Accord-ingly, it might be worth while to attempt to incorporate tile drainage pathways into future versions of the model. In the case of conversion to surface runoff, which we believe to be the dominant fate of vadose zone macropore flow, this will tend to occur at slope breaks, toe slopes, and areas of con-verging groundwater flow pathways. In this case, it is as-sumed that soil P concentrations and land use at the point of surface runoff production control the concentration of P in runoff, as accounted for in the overland flow model com-ponent. It is worth while to note, however, that hydrologi-cally active areas such as springs have unique P source area properties, related in part to the frequency of runoff produc-tion (Hively et al, 2005). Unfortunately, simulating the spa-tial distribution of permanent wet areas consisting of springs originating from faults in the bedrock is only possible with prohibitively intensive data collection. Finally, in the case of direct flow from the vadose zone into the stream, this is ex-pected to comprise a small portion of the total flow from the watershed, and it is accounted for by the calibrated baseflow concentration used in the model.
3 Input data and parameter estimation
The SMDR model and the SMDR TDP transport model were applied to a 164-ha rural watershed that hosts a third-generation dairy farm with approximately 80 milking cows and 35 replacement heifers. The study watershed is located in the Catskills region of New York State, within the Can-nonsville Reservoir basin. Since 1993, the study watershed has been the subject of a long term monitoring study con-ducted by the New York State Department of Environmental Conservation (Bishop et al., 2003) that demonstrated a 43% reduction in TDP loads delivered during runoff events since the implementation of BMPs in 1995 (Bishop et al., 2005). The extensive stream quality dataset and detailed manage-ment records available for this farm provided an ideal context for application of the models and verification of results. A detailed description of the study watershed, and a description of the raster maps for land use, soil type, and manure spread-ing zones, are given in Bishop et al. (2003, 2005), G´erard-Marchant et al. (2006), and Hively (2004). Total dissolved P (TDP) is defined as molybdate reactive orthophosphate found in filtered (45 um) digested (Kjeldahl) water samples. The SMDR model was applied to the study watershed for a ten year period (1 January 1993–31 October 2001) of input data. The calibration process and validation results of this model are presented in a companion paper (G´erard-Marchant et al., 2006). Manure application records were available for a two year period (1997–1998) and the TDP transport model was therefore applied for the same two year period only.
3.1 Climate
The climate of the study area is humid continental, with an average temperature of 8◦C. Annual average precipitation for the year is 1120 mm. Daily minimum and maximum tem-peratures were obtained from a nearby weather station lo-cated at Delhi, New York, 438.9 msl, (National Weather Ser-vice (USDC NOAA) cooperative observer station #302036, “Delhi 2 SE”), located about 20 km SW of the site (NCDC, 2000). Temperatures were corrected by −1.2◦C to account for the difference in elevation from the study watershed.
3.2 Land use
A spatially justified aerial photograph provided the basemap for on-screen digitization of land cover, manure application zones, impermeable areas, streams, artificial drainage, and other important landscape features (Hively, 2004). Combi-nation of this information with field observations, field col-lection of GPS data, farm planning records, and farmer in-terview provided sufficient detail to produce 10-m land use raster maps reflecting annual changes in crop rotation. The resulting land use maps for 1997 and 1998 are presented in Fig. 1.
On-site GPS data collection (Hively, 2004) was used to map the extent of manured and non-manured impermeable areas within the watershed. Because the scale of the imper-meable features was not adequately captured by the transla-tion to 10-m gridcells, the area of each impermeable landuse type was first calculated, and the landuse raster map was sub-sequently hand-edited to reflect appropriate area distribution of each near-barn source area type.
3.3 Observed streamflow and chemistry
Daily stream flows were recorded on a 10-min basis by a gauge on the watershed outlet, and integrated over a day. Ob-served TDP concentrations were derived from flow-weighted automated sampling at the watershed outlet, as described in Bishop et al. (2003).
3.4 Parameters estimation and calibration
The parameters that must be estimated for the TDP transport models are: export coefficients cSreffor each combination of soil and land use (Eq. 3); base temperature Ts and Qs
co-efficients (Eq. 3); reference base flow concentration over the watershed cBFref(Eq. 6); base temperature TBFand QBF
co-efficient (Eq. 6); initial TDP mass in manure M(to)per load
(Eq. 10); manure decay time τ (Eq. 10); and manure charac-teristic volume Vm(Eq. 9). As detailed below, most of these
parameters are estimated a priori from field measurements or data reported in the literature. However, some parameters are obtained a posteriori by calibration. Values of the parameters are summarized in Table 1.
Table 1. Model parameter values.
Parameter Eq. Value
Parameters estimated a priori
Tavg Annual average temperature (4) 6.3 [◦C]
1T Annual temperature amplitude (4) 12.8 [◦C]
tφ Time lag (from Jan., 01) (4) 113 [d]
TS Reference temperature, soil (3) 19.1 [◦C]
TBF Reference temperature, baseflow (6) 15.6 [◦C]
ze Annual damping depth (7) 1.87 [m]
zT Average depth to low-permeability layer (7) 0.6 [m]
M(to) Initial amount of water-extractable P (9) 14 [kg ha−1load−1]
τ Exponential decay characteristic time (10) 7 [d] Vm Manure TDP release characteristic volume (9) 25 [m3m−2]
Parameters estimated a posteriori
QS Q10 base coefficient, soil (3) 1.5 [-]
cBF ref Baseflow reference export coefficient (6) 60 [µg l−1]
QBF Q10 base coefficient, baseflow (6) 2.5 [-]
N 1997 Deciduous Forest Pond Grass/Pasture Shrubs Roads Farmstead Crops 0 500 N 1998 Deciduous Forest Pond Grass/Pasture Shrubs Roads Farmstead Crops Alfalfa 0 500
Fig. 1. Land uses and field boundaries for 1997 (top) and 1998 (bottom).Fig. 1. Land uses and field boundaries for 1997 (top) and 199833 (bottom).
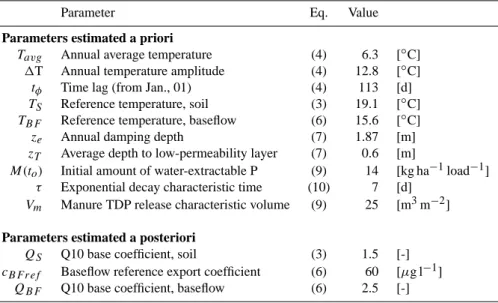
Concentrations of TDP in overland flow were measured using simulated rainfall application at nine locations within the study watershed (Hively et al., 2005). The observed con-centrations, cSobs [mg l−1] were found to correlate well to Morgan’s soil test P (Lathwell and Peech, 1965) for soils with low to moderate soil test P [cSobs=0.0056+0.0180 STP, adjusted R2=0.84] and for manured areas exhibiting exces-sively high soil test P [cSobs=0.4735+0.0065 STP, adjusted R2=0.84]. These equations, in combination with soil test P data collected throughout the watershed, provided initial es-timations of TDP export coefficients for overland flow from non-manured soils. These values were subsequently rounded and adjusted to reflect TDP concentrations observed in sam-ples of overland flow and other data collected on the study farm (Hively, 2004). When soil test P data were not available for a field, a TDP export coefficient was assigned by com-parison with other fields sharing the same management his-tory. Export coefficients were also estimated for impervious areas, such as barnyard and roadways, from the relationship derived for high soil test P soils, subsequently modified to re-flect TDP concentrations observed in grabsamples of surface runoff during rainfall and snowmelt events (Hively, 2004). Eventually, a 10-m raster map gathering all this information was produced, so that each land use category was assigned an estimated TDP release concentration cSref. The resulting map is presented Fig. 2.
Annual average temperature Tavg, temperature deviation
1T, and time lag tφ in Eq. (4) were estimated a priori from
monthly averages of minimum, maximum and mean tem-peratures obtained for a 80-year period (1924–2004) from the Delhi, NY weather station. The reference temperature
Ts for the soil export coefficient in Eq. (3) was set a priori
surface (20◦C). The parameter Q
sfor soil export coefficients
introduced in Eq. (3) was obtained a posteriori by calibra-tion with observed TDP loads. The parameters cBFref and
QBF of the baseflow export coefficient, Eq. (6), were also
obtained a posteriori by calibration for winter and summer low flow events. The equivalent annual damping depth in-troduced in Eq. (7) to compute soil temperatures was set a priori to ze=1.87 m using average thermal diffusivities over
a wide range of soils at field capacity (de Vries and Afgan, 1975; Kuo, 1998). The depth zT at which soil temperatures
were computed was set a priori using SSURGO data equal to the average depth of the soils in the watershed (60 cm). Ref-erence temperature TBF for the baseflow export coefficient,
Eq. (6), was set a priori to the amplitude of the sine wave temperatures at depth zT (11◦C).
Records kept by the collaborating farm supplied the num-ber of manure loads applied on each field and each day for 1997 and 1998. While the data are the best avail-able, the records were frequently vague, and the informa-tion somewhat approximate. Manure spreading was there-fore simulated on a semi-distributed basis, as described above. According to the manure spreader calibration record, one load represents 7670 kg of manure and covers approx-imately 2000 m2 of land surface, or an application amount of 38 350 kg ha−1. Analysis of manure samples gave an average manure concentration of 0.56 gP/kg manure, hence about 4.3 kg per load or 21.5 kg ha−1. The average frac-tion of water-extractable P available just after applicafrac-tion was estimated a priori at 65%, in accordance with Sharp-ley and Moyer (2000). Therefore, each load of manure cor-responded to an initial mass of 2.8 kg of water-extractable P, or 14.0 kg ha−1. Following Nash et al. (2000), the expo-nential decay time τ in Eq. (10) was set a priori to 7 days. The characteristic manure TDP release volume Vm was
es-timated a priori as 25 mm from Sharpley and Moyer (2000) and (G´erard-Marchant et al., 2005).
In translating hydrology to P transport we have attempted to rely on relationships derived from physical processes, in order to make the model have the largest range of possible application. However, each landscape behaves in its own particular way according to the highly variable nature of soil, bedrock, topography, vegetation, and farm management that control hydrologic and P loading processes. The manure-related P loading function is expected to be transferable, and is in fact based upon data from manure extraction studies in Pennsylvania. Users must estimate an initial manure P con-centration and monitor the amount of rainfall and timing of application. In the case of surface runoff, the initial rela-tionship between soil test P and P concentrations in runoff was derived on a site specific basis from simulated rainfall data (Hively et al., 2005). Considerable research has demon-strated that the relationship between soil test P and P in runoff is consistent, but only within soil types, and it is recom-mended that this relationship be established on a local basis (Kleinman et al, 2000; Sharpley et al., 2002, 2003). Such,
N Manure 10 20 30 50 60 80 100 200 300 400 500 600 0 500
Fig. 2. Extraction coefficients map of the study watershed. Units: [µg l−1]. Regularly manured areas outlined in red. Watershed boundary outlined in black.
34
Fig. 2. Extraction coefficients map of the study watershed. Units:
[µg l−1]. Regularly manured areas outlined in red. Watershed boundary outlined in black.
unfortunately, appears to be the nature of soil P loading pro-cesses, due to the inherent effects of particle size distribution and iron/aluminum content upon soil charge and P sorption capacity. That said, the coefficients derived in this model are likely applicable to soils throughout the Catskill landscape that comprises the New York City watersheds.
4 Results and discussion
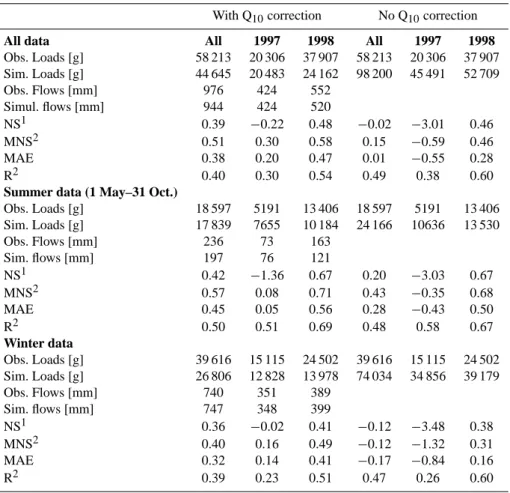
Daily predicted TDP loads for the watershed were calculated as the sum of TDP transported in flow from each gridcell via the four model components (non-manure covered soils, baseflow,manure-covered areas, and impermeable near-barn areas). These values were subsequently compared to the daily observed loads that were recorded at the watershed out-let. Tables 2 and 3 compare the observed and simulated TDP loads over the simulated period, along with the val-ues of various efficiency criteria: standard Nash-Sutcliffe ef-ficiency criterion NS (Nash and Sutcliffe, 1970), modified Nash-Sutcliffe criterion MSN (Chiew and McMahon, 1994), mean absolute error MAE (Ye et al., 1997), and correlation coefficients R2.
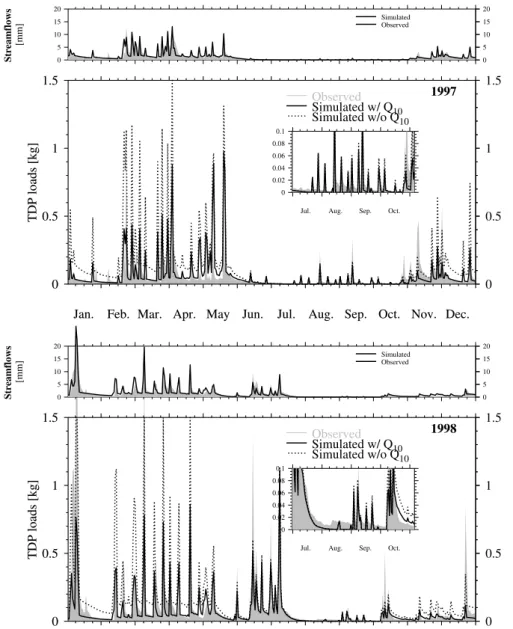
As shown in Fig. 3, the timing of the load peaks was in most cases well reproduced, except on some winter dates (e.g. 15 January 1997, 6 February 1997, 17 January 1998) where flow and load peaks were missed. This discrepancy was attributed to imperfect modeling of snowmelt events, and to the use of offsite climate input data that did not reflect the actual localized on-site precipitation. During the win-ter, TDP load peaks were usually underestimated but overall flow volumes were generally correct. The simulated TDP loads matched well with the observed data during winter low flow events. During summer, however, loads correspond-ing to low-flow events were underestimated. It should be
Table 2. Comparison of annual, summer and winter values of observed and simulated daily TDP loads and efficiency criteria for the simulated
period (1 January 1997–31 December 1998).
With Q10correction No Q10correction
All data All 1997 1998 All 1997 1998
Obs. Loads [g] 58 213 20 306 37 907 58 213 20 306 37 907 Sim. Loads [g] 44 645 20 483 24 162 98 200 45 491 52 709 Obs. Flows [mm] 976 424 552 Simul. flows [mm] 944 424 520 NS1 0.39 −0.22 0.48 −0.02 −3.01 0.46 MNS2 0.51 0.30 0.58 0.15 −0.59 0.46 MAE 0.38 0.20 0.47 0.01 −0.55 0.28 R2 0.40 0.30 0.54 0.49 0.38 0.60
Summer data (1 May–31 Oct.)
Obs. Loads [g] 18 597 5191 13 406 18 597 5191 13 406 Sim. Loads [g] 17 839 7655 10 184 24 166 10636 13 530 Obs. Flows [mm] 236 73 163 Sim. flows [mm] 197 76 121 NS1 0.42 −1.36 0.67 0.20 −3.03 0.67 MNS2 0.57 0.08 0.71 0.43 −0.35 0.68 MAE 0.45 0.05 0.56 0.28 −0.43 0.50 R2 0.50 0.51 0.69 0.48 0.58 0.67 Winter data Obs. Loads [g] 39 616 15 115 24 502 39 616 15 115 24 502 Sim. Loads [g] 26 806 12 828 13 978 74 034 34 856 39 179 Obs. Flows [mm] 740 351 389 Sim. flows [mm] 747 348 399 NS1 0.36 −0.02 0.41 −0.12 −3.48 0.38 MNS2 0.40 0.16 0.49 −0.12 −1.32 0.31 MAE 0.32 0.14 0.41 −0.17 −0.84 0.16 R2 0.39 0.23 0.51 0.47 0.26 0.60
1. Nash-Sutcliffe criterion (Nash and Sutcliffe, 1970)
2. Modified Nash Sutcliffe criterion (Chiew and McMahon, 1994) 3. Mean Absolute Error (Ye et al., 1997)
noted that when the calculation of efficiency criteria was re-stricted to days when predicted flow matched observed flow by +/−25%, then the model accuracy improved substantially (e.g., R2values increased from 0.39 to 0.62 on the total pe-riod), as presented in Table 3, reflecting the fact that if the hydrology is not accurately modeled, the P loading will be in error.
Implementing the Q10temperature modification to the es-timated TDP export coefficients resulted in noticeable im-provements in the predicted TDP load values, as illustrated in Fig. 3 and Table 2. In particular, the decrease of baseflow concentration cBF and soil release concentrations cS with
decreased temperature substantially improved the match be-tween predicted and observed TDP loads during winter low-flow events. However, this improvement had little effect on the various efficiency criteria, suggesting that these criteria may not be very effective for evaluating model performance. The first difficulty of validation is that if hydrology is not accurately simulated, P loading, which is directly
de-pendent on hydrologic estimates, will be inaccurate. There-fore, the derived measures of fit were significantly better for days when hydrology was simulated within 25% of measured flow. The observed dataset is one of the most complete avail-able in the nation, and provides an excellent daily estimate of actual P loads. Although it is difficult to aggregate landscape source factors for comparison with loads measured at a sin-gle outlet, this is a difficulty faced in common by all models. The main of the SMDR P Load Model in this case is that the estimated concentrations were carefully derived from a wide variety of on site measurements (Hively, 2004), and the validation data is therefore as good as any.
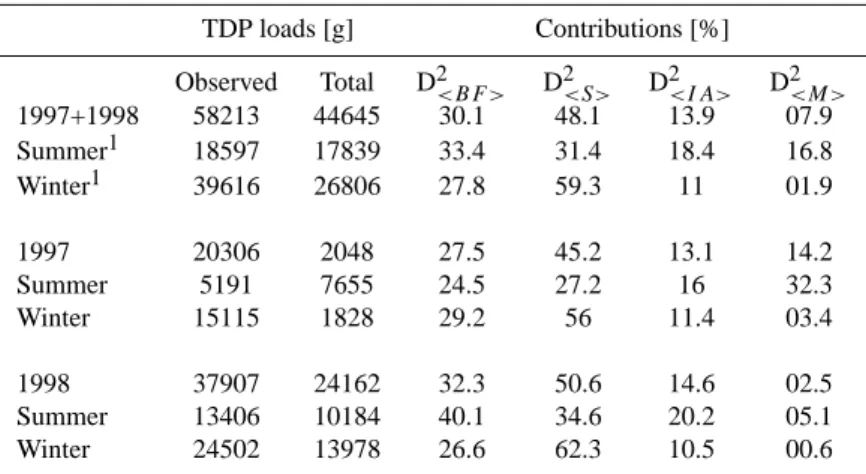
4.1 Relative importance of model components
The relative contributions of each TDP transport component (baseflow, overland flow from soils, from manured areas, and from impervious areas) are reported in Table 4. Overall, pre-dicted total TDP loads delivered from the watershed were
Table 3. Comparison of efficiency criteria of the temperature corrected simulations, for (a) simulated flows matching observed flows
+/−25%; (b) all flows.
Well-simulated flows1 All flows
All 1997 1998 All 1997 1998
Annual
Number of data points 209 124 85 730 365 365
NS2 −0.67 −0.07 −0.83 0.39 −0.22 0.48
MNS3 0.34 0.28 0.37 0.51 0.3 0.58
MAE4 0.13 0.15 0.14 0.38 0.2 0.47
R2 0.62 0.25 0.71 0.4 0.3 0.54
Summer (1 May–31 October)
Number of data points 73 44 29 368 184 184
NS2 0.86 0.43 0.96 0.42 −1.39 0.67
MNS3 0.77 0.55 0.92 0.57 0.08 0.71
MAE4 0.62 0.42 0.76 0.45 0.05 0.56
R2 0.87 0.5 0.96 0.5 0.51 0.69
Winter (1 January–31 March, 1 November–31 December)
Number of data points 136 80 56 362 181 181
NS2 −2.79 −0.76 −3.32 0.36 −0.02 0.41
MNS3 −0.23 −0.12 −0.32 0.4 0.16 0.49
MAE4 −0.49 −0.25 −0.61 0.32 0.14 0.41
R2 0.79 0.2 0.94 0.39 0.23 0.51
1|1− Qsim/Qobs|<0.25
2Nash-Sutcliffe criterion (Nash and Sutcliffe, 1970)
3Modified Nash Sutcliffe criterion (Chiew and McMahon, 1994) 4Mean Absolute Error (Ye et al., 1997)
Table 4. Contributions of each TDP transport component to the total TDP load.
TDP loads [g] Contributions [%]
Observed Total D2<BF > D2<S> D2<I A> D2<M>
1997+1998 58213 44645 30.1 48.1 13.9 07.9 Summer1 18597 17839 33.4 31.4 18.4 16.8 Winter1 39616 26806 27.8 59.3 11 01.9 1997 20306 2048 27.5 45.2 13.1 14.2 Summer 5191 7655 24.5 27.2 16 32.3 Winter 15115 1828 29.2 56 11.4 03.4 1998 37907 24162 32.3 50.6 14.6 02.5 Summer 13406 10184 40.1 34.6 20.2 05.1 Winter 24502 13978 26.6 62.3 10.5 00.6
1Summer: 1 May–31 October; Winter: 1 January–30 April, 1 November–31 December 2BF: baseflow; S: Soils; IA: Impervious areas; M: Manure covered areas
dominated by the effect of overland flow from soils with-out recent manure application (48% of total loading). The greater contribution of soils during winter vs. summer (Ta-ble 4) is likely attributa(Ta-ble to the greater extent of saturated areas during winter months, while in summertime runoff
pro-duction is often concentrated in non-field areas such as slope-breaks, groundwater springs, and impervious areas (Hively et al., 2005). The predicted contribution of TDP from manure-covered soils was overall less than 10% of total loads for the entire simulation period. However, the relative contribution
Jan. Feb. Mar. Apr. May Jun. Jul. Aug. Sep. Oct. Nov. Dec. 0 0.5 1 1.5 TDP loads [kg] Observed Simulated w/ Q10 Simulated w/o Q10
Jan. Feb. Mar. Apr. May Jun. Jul. Aug. Sep. Oct. Nov. Dec. 0 0.5 1 1.5 TDP loads [kg] 0 0.5 1 1.5 1997
Jul. Aug. Sep. Oct.
0 0.02 0.04 0.06 0.08 0.1 0 5 10 15 20 Observed Simulated 0 5 10 15 20 Streamflows [mm]
Jan. Feb. Mar. Apr. May Jun. Jul. Aug. Sep. Oct. Nov. Dec. 0 0.5 1 1.5 TDP loads [kg] Observed Simulated w/ Q10 Simulated w/o Q10
Jan. Feb. Mar. Apr. May Jun. Jul. Aug. Sep. Oct. Nov. Dec. 0 0.5 1 1.5 TDP loads [kg] 0 0.5 1 1.5 1998
Jul. Aug. Sep. Oct.
0 0.02 0.04 0.06 0.08 0.1 0 5 10 15 20 Observed Simulated 0 5 10 15 20 Streamflows [mm]
Fig. 3. Comparison of observed and simulated total dissolved phosphorus (TDP) loads. For a
description of the Q
10modification, see Eq. (6).
35
Fig. 3. Comparison of observed and simulated total dissolved phosphorus (TDP) loads. For a description of the Q10modification, see Eq. (6).
of manured areas varied greatly with time, with almost no contribution during most of the year, to a monthly average of 25% in April and May, with maximum contributions up to 90% on some days of these months. This “encouraging” ob-servation may reflect the efficiency of the manure best man-agement practices implemented on the farm, with no manure spread from November to April and reduced spreading on hydrologically sensitive areas. The estimation of P contribu-tion from manured areas could be improved by field testing the algorithm for modeling TDP loss from manure, since it was derived from off-site experimental results (Sharpley and Moyer, 2000; G´erard-Marchant et al., 2005). Moreover, TDP losses from manure are modeled on a semi-distributed basis:
a fully distributed modeling of manure application could be attained if GPS data were recorded by the spreader unit.
Predicted contributions from the impervious areas ac-counted for about 15% of the total loads over the 2-year sim-ulation period, although the areas were of minor spatial ex-tent (<2% of total watershed area). Here again, the contri-butions varied greatly with time. In summer and fall, trans-port of TDP from impervious areas represented up to 95% of the daily loads. During this period, the watershed tends to be dry, and most runoff occurs from direct precipitation on roads and near barn area. Reciprocally, during winter, when the contribution of roadways to runoff production is small compared to saturation-excess and when cows did not travel
to pastures, the relative contribution of impervious areas to TDP transport was small.
4.2 A call for further improvements
The preliminary model results are encouraging, because the model performed well with minimal calibration. However, there is room for improvement. First, a considerable amount of error in TDP load prediction resulted from error in SMDR-predicted flow volumes. The summer baseflows were un-derestimated (G´erard-Marchant et al., 2006), resulting in the underestimation of TDP loads during summer. Better results could be achieved with improvements in the hydrology of SMDR itself.
Some aspects of the TDP transport model itself could be improved as well. For example, summertime manure depo-sition on fields, or directly in streams, by the grazing herd is not currently considered, although results of rainfall simula-tion have indicated increased P loss following intensive graz-ing (Hively, 2004; Hively et al., 2005). If accurate grazgraz-ing records were available, pasture and impervious area manure deposition could be directly implemented into the current model, using a modification of the algorithm currently used for manure-covered soils. A simpler approach would con-sist of allocating a variable release coefficient to each grazed cell. Finally, improved characterization of P loss from near-barn impervious areas could be attained through monitoring of manure deposition and roadway STP.
5 Summary and conclusion
A distributed model for the simulation of total dissolved phosphorus (TDP) in watershed runoff was developed and implemented. The Soil Moisture Distribution and Routing model (SMDR) provided daily estimates of distributed runoff production. Estimated TDP concentrations in base flow and runoff from non-manured fields were simulated with extrac-tion coefficients adjusted for temperature with an Arrhenius type of equation. Estimated TDP concentrations from ma-nured fields were simulated based on water soluble P in the manure. Estimated TDP losses from impervious areas with manure were simulated with seasonal extraction coefficients. The model was tested for a two year period when the manure spreading schedule was known for a watershed dairy farm. Observed TDP loads at the watershed stream outlet were rea-sonably well simulated when the temperature correction was taken into account. The TDP losses were largely controlled by transport of soil P by overland flow from non-manure cov-ered soils. Phosphorus loss from manured fields was about 10% of total TDP losses on average, with the greatest con-tributions occurring in April and May, during the period that the winter-stored manure was spread and the extent of runoff producing areas was large.
Most of the differences between observed and simulated loads were attributed to an imperfect reproduction of the hy-drological components. Improvements in the estimation of percolation and snowmelt would improve predictions during summer and winter periods respectively.
Although the actual implementation of the soil TDP ex-traction model relies strongly on the accurate spatial distribu-tion of runoff generating areas, the model performance was evaluated by comparing simulated and observed flows and TDP loads summed over the entire watershed. Limitations in experimental data prevent the validation on a distributed ba-sis. Despite this limitation, this simple P loading model pro-vides an adequate starting point for the estimation of lumped TDP losses for various landscape areas and land uses and can be used in realistic manner to evaluate the effects of best management practices.
Acknowledgements. The United States Departments of Agriculture
and Interior provided primary funding for this study. The grant of the Department of Interior was administered by the Water Resources Institute Additional funding was provided by the United States Department of Environmental Protection under the Safe Drinking Water Act, administered by the Watershed Agricultural Council (WAC). The data for validation was obtained from P. Bishop of the New York State Department of Environmental Conservation (NYSDEC). M. R. Rafferty, J. L. Lojpersberger of NYSDEC and S. Pacenka of WRI are acknowledged for the collecting and/or modification this data. In addition we would like to thank the members of the Town Brook Research Group, Watershed Agricultural Program Planners and Landowners for their invaluable discussions on and insights in watershed processes in the Catskill Mountains. Specifically we would like to thank the collaborating farm family for their willingness to participate in the research effort and their patience in dealing with us.
Edited by: N. Romano
References
Akhtar, M. S., Richards, B. K., Medrano, P. A., DeGroot, M., and Steenhuis, T. S.: Dissolved phosphorus losses from undisturbed soil cores: related to adsorption strength, flow rate, or soil struc-ture, Soil Sci. Soc. Amer. J., 67, 458–470., 2003.
Arnold, J. G., Allen, P. M., and Bernhardt, G.: A comprehensive surface-groundwater flow model, J. Hydrol., 142, 47–69, 1993. Arnold, J. G., Williams, J. R., Srinivasan, R., King, K. W., and
Griggs, R. H.: SWAT, Soil and Water Assessment Tool, USDA, Agriculture Research Service, Temple, TX 76502., 1994. Beauchemin, S., Simard, R. R., and Cluis, D.: Phosphorus
sorption-desorption kinetics of soil under contrasting land uses, J. Envi-ron. Quality, 25, 1317–1325, 1996.
Beven, K. J.: A discussion of distributed hydrological modelling, in: Distributed Hydrological Modelling, edited by: Abbott, M. and Refsgaard, J., Kluwer, Dordrecht, NL, 255–277, 1996. Beven, K. J. and Kirkby, M. J.: A physically based, variable
contributing area model of basin hydrology, Hydrol. Sci. Bull., 24(1), 43–69., 1979.
Bishop, P. L., Hively, W. D., Stedinger, J. R., Bloomfield, J. A., Rafferty, M. R., and Lojpersberger, J. L.: Multivariate analysis of paired watershed data to evaluate agricultural BMP effects on stream water phosphorus, J. Environ. Quality, 34(3), 1087–1101, 2005.
Bishop, P. L., Rafferty, M., and Lojpersberger, J.: Event based wa-ter quality monitoring to dewa-termine effectiveness of agricultural BMPs, in: Proceedings of the American Water Resources Asso-ciation 2003, International Congress on Watershed Management for Water Supply Systems, 29 June–2 July 2003, 2003.
Brown, M. P., Longabucco, P., Rafferty, M. R., Robillard, P. D., Walter, M. F.,and Haith, D. A.: Effects of animal waste con-trol practices on non-point source phosphorus loading in the west branch of the Delaware river watershed, J. Soil and Water Con-servation, 44(1), 67–77, 1989.
Brutsaert, W. H.: Evaporation into the Atmosphere, D. Reidel Kluwer, Boston, MA, 1982.
Bunnell, F. L., Tait, D. E. N., Flanagan, P. W., and Van Cleve, K.: Microbial respiration and substrate weight loss. I. a general model of the influences of abiotic variables, Soil Biol. Biochem., 9, 33–40, 1977.
Carpenter, S. R., Caraco, N. F., Corell, D. L., Howarth, R. W., Sharpley, A. N,and Smith, V. H.: Nonpoint pollution of surface waters with phosphorus and nitrogen, Ecol. Appl., 8, 559–568, 1998.
Cassell, E. A., Dorioz, J. M., Kort, R. L., Hoffmann, J. P., Meals, D. W., Kirschtel, D., and Braun, D. C.: Modeling phosphorus dynamics in ecosystems: mass balance and dynamic simulation approaches, J. Environ. Quality, 27, 293–298, 1989.
Chiew, F. H. S. and McMahon, T. A.: Application of the daily rainfall-runoff model MODHYDROLOG to 28 Australian catch-ments, J. Hydrol., 153, 383–416, 1994.
Clesceri, N. L., Curran, S. J., and Sedlak, R. L.: Nutrient loads to Wisconsin lakes: Part I. nitrogen and phosphorus export coeffi-cients, Water Resources Bull., 22(6), 983–990, 1986.
Correll, D. L., Jordan, T. E., and Weller, D. E.: Effects of precipita-tion and air temperatures on phosphorus fluxes from Rhode River watersheds, J. Environ. Quality, 28, 144–154, 1999.
Cox, F. R. and Hendricks, S. E.: Soil test phosphorus and clay con-tent effects on runoff water quality, J. Environ. Quality, 29, 1582– 1586, 2000.
de Vries, D. A.: Thermal properties of soils, in: Physics of Plant Environment, edited by: van Wijk, W., North Holland Pub. Co., Amsterdam, NL, 210–235, 1963.
de Vries, D. A. and Afgan, N. H.: Heat and mass transfer in the biosphere, John Wiley and Sons, New York, NY, 1975.
DiLuzio, M. and Arnold, J. G.: Formulation of a hybrid cali-bration approach for a physically based distributed model with NEXRAD data input, J. Hydrol., 298, 136–154, 2004.
Dunne, T. and Black, R. D.: Partial area contributing to storm run off in a small New-England watershed, Water Resources Re-search, 6(5), 1296–1311, 1970.
Dunne, T., Moore, T. R., and Taylor, C. H.: Recognition and pre-diction of runoff-producing zones in humid regions, Hydrol. Sci. Bull., 20(3), 305–327, 1975.
Edwards, D. R., Daniel, T. C. Drying interval effects on runoff from fescue plots receiving swine manure, Trans. ASAE, 36, 1673– 1678, 1993a.
Edwards, D. R. and Daniel, T. C.: Effects of litter application rate
and rainfall intensity on quality of runoff from fescue grass plots, J. Environ. Quality, 22, 361–365, 1993b.
Fozzard, I. R., Doughty, C. R., Ferrier, R. C., Leatherland, T. M., and Owen, R.: A quality classification for management of Scot-tish standing waters, Hydrobiologia, 395–396, 433–455, 1999. Frankenberger, J. R., Brooks, E. S., Walter, M. T., Walter, M. F., and
Steenhuis, T. S.: A GIS-based variable source area hydrology model, Hydrol. Proc., 13(6), 805–822, 1999.
Frossard, E., Condron, L. M., Oberson, A., Sinaj, S., and Fardeau, J. C.: Process governing phosphorus availability in temperate soils, J. Environ. Quality, 29(1), 15–23, 2000.
G¨achter, R., Ngatiah, J., and Stamm, C.: Transport of phosphate from soil to surface waters by preferential flow, Environ. Sci. and Technol., 32(13), 1865–1869, 1998.
Gascho, G. J., Wauchope, R. D., Davis, J. G., Truman, C. C., Dowler, C. C., Hook, J. E., Sumner, H. R., and Johnson, A. W.: Nitrate-nitrogen, soluble, and bioavailable phosphorus runoff from simulated rainfall after fertilizer application, Soil Sci. Soc. of America Journal, 62, 1711–1718, 1998.
Gburek, W. J., Sharpley, A. N., and Pionke, H.: Identification of critical source areas for phosphorus export from agricultural catchments, in: Advances in Hillslope Processes, edited by: An-derson, M. and Brookes, S., John Wiley & Sons, Chichester, UK, 263–282, 1996.
Geohring, L. D., McHugh, O. V., Walter, M. T., Steenhuis, T. S., Akhtar, M. S., and Walter, M. F.: Phosphorus transport into sub-surface drains by macropores after manure applications: impli-cations for best manure management practices, Soil Sci., 166, 896–909, 2001.
G´erard-Marchant, P., Walter, M. T., and Steenhuis, T. S.: Simple models for phosphorus loss from manure in runoff, J. Environ. Quality, 34(3), 872–876, 2005.
G´erard-Marchant, P., Hively, W. D., and Steenhuis, T. S.: Dis-tributed hydrological modeling of total dissolved phosphorus transport in an agricultural landscape, part I: Runoff generation, Hydrol. Earth Syst. Sci., 10, 245–261, 2006.
Ginting, D., Moncrief, J. F., Gupta, S. C., and Evans, S. D.: Inter-action between manure and tillage system on phosphorus uptake and runoff losses, J. Environ. Quality, 27, 1403–1410, 1998. Gupta, A., Destouni, G., and Jensen, M. B.: Modeling tritium and
phosphorus transport by preferential flow in structured soil, J. Contaminant Hydrol., 35(4), 389–407, 1999.
Haith, D. A., Mandel, R., and Wu, R. S.: Generalized watershed loading functions version 2.0: User’s manual, Technical Report, Department of Agricultural and Biological Engineering, Cornell University, Ithaca, NY, 1992.
Haith, D. A. and Shoemaker, L. L.: Generalized watershed loading functions for stream flow nutrients, Water Resour. Bull., 23, 471– 478, 1987.
Hanrahan, G., Gledhill, M., House, W. A., and Worsfold, P. J.: Phosphorus loading in the Frome catchment, UK: Seasonal re-finement of the coefficient modeling approach, J. Environ. Qual-ity, 30, 1738–1746, 2001.
Hansen, N. C., Daniel, T. C., Sharpley, A. N., and Lemunyon, J. L.: The fate and transport of phosphorus in agricultural systems, J. Soil Water Conserv., 57(6), 408–417, 2002.
Haygarth, P. and Sharpley, A. N.: Terminology for phosphorus transfer, J. Environ. Quality, 29(1), 10–15, 2000.
of small watersheds to precipitation in humid regions, in: Forest hydrology, edited by: Sopper, W. E. and Lull, H. W., Pergamon Press, Oxford, UK, 275–290, 1967.
Hewlett, J. D. and Nutter, W. L.: The varying source area of stream-flow from upland basins, in: Proceedings of the Symposium on Interdisciplinary Aspects of Watershed Management, 6 August 1970, ASCE, Bozeman, MT, 65–83, 1970.
Hively, W. D.: Phosphorus loading from a monitored dairy farm landscape, PhD dissertation, Cornell University, Ithaca, NY, USA, 2004.
Hively, W. D., Bryant, R. B., and Fahey, T. J.: P concentrations in overland flow from diverse locations on a New York dairy farm, J. Environ. Quality, 34(4), 2005.
Hooda, P. S., Moynagh, M., Svoboda, I. F., Edwards, A. C., Ander-son, H. A., and Sym, G.: Phosphorus loss in drainflow from in-tensively managed grassland soils, J. Environ. Quality, 28, 1235– 1242, 1999.
Horton, R. E.: The role of infiltration in the hydrological cycle, Transactions of the American Geophysical Union, 14, 446–460, 1933.
Horton, R. E.: An approach toward a physical interpretation of in-filtration capacity, Soil Sci. Soc. Amer. Proc., 4, 399–418, 1940. Johnson, M. S., Coon, W. F., Mehta, V. K., Steenhuis, T. S., Brooks, E. S., and Boll, J.: Application of two hydrologic models with different runoff mechanisms to a hillslope dominated watershed in the northeastern US: a comparison of HSPF and SMR, J. Hy-drol., 284, 57–76, 2003.
Johnsson, H., Bergstrom, L., and Jansson, P.-E.: Simulated nitrogen dynamics and losses in a layered agricultural soil, Agriculture, Ecosystems, and Environment, 18, 333–356, 1987.
Kingery, W. L., Wood, C. W., and Williams, J. C.: Tillage and amendment effects on soil carbon and nitrogen mineralization and phosphorus release, Soil and Tillage Res., 37(4), 239–250, 1996.
Klatt, J. G., Mallarino, A. P., Downing, J. A., Kopaska, J. A., and Wittry, D. J.: Soil phosphorus, management practices, and their relationship to phosphorus delivery in the Iowa Clear Lake Agri-cultural watershed, J. Environ. Quality, 23(6), 2140, 2003. Kleinman, P. J. A.: Source risk indicators of nutrient loss from
agri-cultural lands, in: Managing nutrients and pathogens in animal agriculture, edited by: Sailus, M., Northeast Regional Agricul-tural Engineering Service, Ithaca, NY, 237–252, 2000.
Kleinman, P. J. A., Bryant, R. B., and Reid, W. S.: Development of pedotransfer functions to quantify phosphorus saturation of agricultural soils, J. Environ. Quality, 28, 2026–2030, 1999. Kleinman, P. J. A., Bryant, R. B., Reid, W. S., Sharpley, A. N.,
and Pimentel, D.: Using soil phosphorus behavior to identify environmental thresholds, Soil Sci., 165(12), 943–950, 2000. Kleinman, P. J. A. and Sharpley, A. N.: Effect of broadcast
ma-nure on runoff phosphorus concentrations over successive rain-fall events, J. Environ. Quality, 32, 1072–1081, 2003.
Koopmans, G. F., Chardon, W. J., Ehlert, P. A. I., Dolfing, J., Suurs, R. A. A., Oenemaa, O., and van Riemsdijk, W. H.: Phospho-rus availability for plant uptake in a phosphoPhospho-rus-enriched non-calcareous sandy soil, J. Environ. Quality, 33, 965–975, 2004. Kuo, W.-L.: Spatial and temporal analysis of soil water and nitrogen
distribution in undulating landscapes using a GIS-based model, PhD dissertation, Cornell University, Ithaca, NY, USA, 1998. Kuo, W.-L., Steenhuis, T. S., McCulloch, C. E., Mohler, C. L.,
We-instein, D. A., DeGloria, S. D., and Swaney, D. P.: Effect of grid size on runoff and soil moisture for a variable-source-area hydrology model, Water Resour. Res., 35, 3419–3428, 1999. Lathwell, D. J., and Peech, M.: Interpretation of chemical soil tests,
Cornell Univ. Agric. Exp. Stn. Bull., 995, Cornell Univ., Ithaca, NY, 1965.
Maguire, R. O. and Sims, J. T.: Soil testing to predict phosphorus leaching, J. Environ. Quality, 31, 1601–1609, 2002.
McDowell, R. W. and Sharpley, A. N.: Approximating phosphorus release from soils to surface runoff and subsurface drainage, J. Environ. Quality, 30(2), 508–520, 2001.
McDowell, R. W. and Sharpley, A. N.: Availability of residual phos-phorus in high phosphos-phorus soils, Communications in Soil Sci-ence and Plant Analysis, 33(7–8), 1235–1246, 2002a.
McDowell, R. W. and Sharpley, A. N.: The effect of antecedent soil moisture conditions on sediment and phosphorus loss dur-ing overland flow: Mahantango Creek catchment, Pennsylvania, Hydrol. Proc., 16(5), 3037–3050, 2002b.
McDowell, R. W. and Sharpley, A. N.: Phosphorus solubility and release kinetics as a function of soil test P concentration, Geo-derma, 112(1–2), 143–154, 2003.
Mehta, V. K., Walter, M. T., Brooks, E. S., Steenhuis, T. S., Walter, M. F., Johnson, M. S., Boll, J., and Thongs, D.: Application of SMR to modeling watersheds in the Catskills mountains, Envi-ronmental Modeling and Assessment, 9, 77–89, 2004.
Morel, C., Tunney, H., Pl´enet, D., and Pellerin, S.: Transfer of phos-phorus ions between soil and solution: perspectives in soil test-ing, J. Environ. Quality, 29, 50–59, 2000.
Nash, D., Hannah, M., Halliwell, D., and Murdoch, C.: Factors affecting phosphorus transport from a pasture-based grazing sys-tem, J. Environ. Quality, 29(4), 1160–1166, 2000.
Nash, J. E. and Sutcliffe, J. V.: River flow forecasting through con-ceptual models, part I – a discussion of principles, J. Hydrol., 10, 238–250, 1970.
NCDC: Climatalogical data annual summary – New York, National Climate Data Center (NCDC), Asheville, NC, 2000.
Needelman, B. A., Gburek, W. J., Petersen, G. W., Sharpley, A. N., and Kleinman, P. J. A.: Surface runoff along two agricultural hillslopes with contrasting soils, Soil Sci. Soci. Amer. Journal, 68, 914–923, 2004.
Neitsch, S. L., Arnold, J. G., Kiniry, J. R., William, J. R., and King, K. W.: SWAT- Soil and Water Assessment Tool 2000 – Theoret-ical documentation, Temple, TX, 2002.
Pote, D. H., Daniel, T. C., Sharpley, A. N., Moore Jr, P. A., Edwards, D. R., and Nichols, D. J.: Relating extractable soil phosphorus to phosphorus losses in runoff, Soil Sci. Soc. Amer. Journal, 60, 855–859, 1996.
Randall, G. W., Iragavarapu, T. K., and Schmitt, M. A.: Nutrient losses in subsurface drainage water from dairy manure and urea applied for corn, J. Environ. Quality, 29(4), 1244–1252, 2000. Robillard, P. D. and Walter, M. F.: Non-point source control of
phosphorus, a watershed evaluation: Vol. i, phosphorus losses from dairy barnyard areas, Tech. rep., Robert S. Kerr Environ-mental Research Laboratory, ORD. USEPA, Ada, OK, 1984. Ryden, J. C., Syers, J. K., and Harris, R. F.: Phosphorus in runoff
and streams, Adv. Agronomy, 25(1), 1–45, 1973.
Schneiderman, E. M., Pierson, D. C., Lounsbury, D. G., and Zion, M. S.: Modeling the hydrochemistry of the Cannonsville water-shed with Generalized Waterwater-shed Loading Functions (GWLF),
J. Amer. Water Resour. Assoc., 38(5), 1323–1347, 2002. Schoumans, O. F. and Groenendijk, P.: Modeling soil
phopsho-rus levels and phosphophopsho-rus leaching from agricultural land in the Netherlands, J. Environ. Quality, 29, 111–116, 2000.
Schroeder, P. D., Radcliffe, D. E., Cabrera, M. L., and Belew, C. D.: Relationship between soil test phosphorus and phosphorus in runoff: Effects of soil series variability, J. Environ. Quality, 33, 1452–1463, 2004.
Sharpley, A. N., Chapra, S., Wedepohl, R., Sims, J. T., Daniel, T. C., and Reddy, K.: Managing agricultural phosphorus for protection of surface waters: Issues and options, J. Environ. Quality, 23(3), 437–451, 1994.
Sharpley, A. N., Daniel, T. C., Sims, J. T., and Pote, D. H.: De-termining environmentally sound soil phosphorus levels, J. Soil Water Conserv., 51(2), 160–166, 1996.
Sharpley, A. N. and Kleinman, P. J. A.: Effect of rainfall simula-tor and plot scale on overland flow and phosphorus transport, J. Environ. Quality, 32(6), 2172–2179, 2003.
Sharpley, A. N., Kleinman, P. J. A, McDowell, R. W., Gitau, M., and Bryant, R. B.: Modeling phosphorus transport in agricultural watersheds: Processes and possibilities, J. Soil Water Conserv., 57, 425–439, 2002.
Sharpley, A. N, Meisinger, J., Breeuwsma, A., Sims, J. T., Daniel, T. C., and Schepers, J.: Impacts of animal manure management on ground and surface water quality, in: Effective management of animal waste as a soil resource, edited by: Hatfield, J., Ann Arbor Press, Chelsea, MI, 173–242, 1998.
Sharpley, A. N and Moyer, B.: Phosphorus forms in manure and compost and their release during simulated rainfall, J. Environ. Quality 29, 1462–1469, 2000.
Smith, C. and Monaghan, R. M.: Nitrogen and phosphorus losses in overland flow from a cattlegrazed pasture in southland, New Zealand J. Agric. Res., 46, 225–237, 2003.
Srinivasan, M. S., G´erard-Marchant, P., Veith, T. L., Gburek, W. J., and Steenhuis, T. S.: Watershed-scale modeling of critical-source-areas of runoff generation and phosphorus transport, J. Am. Water Resour. Assoc, 41(2), 361–375, 2005.
Stamm, C., Fluhler, H., G¨achter, R., Leuenberger, J., and Wun-derli, H.: Preferential transport of phosphorus in drained grass-land soils, J. Environ. Quality, 27(3), 515–522, 1998.
Wayland, K. G., Long, D. T., Hyndman, D. W., Pijanowski, B. C., Woodhams, S. M., and Haack, S. K.: Identifying relationships between baseflow chemistry and land use with synoptic sampling and R-mode factor analysis, J. Environ. Quality, 32, 180–190, 2003.
Ye, W., Bates, B. C., Viney, N. R., Silvapan, M., and Jakeman, A. J.: Performance of conceptual rainfall-runoff models in low yielding ephemeral catchments, Water Resour. Res., 33, 153–166, 1997.
![Fig. 2. Extraction coefficients map of the study watershed. Units: [µg l −1 ]. Regularly manured areas outlined in red](https://thumb-eu.123doks.com/thumbv2/123doknet/14772716.592130/8.892.466.813.93.341/extraction-coefficients-study-watershed-units-regularly-manured-outlined.webp)