HAL Id: hal-01591683
https://hal.archives-ouvertes.fr/hal-01591683
Submitted on 25 Sep 2017HAL is a multi-disciplinary open access archive for the deposit and dissemination of sci-entific research documents, whether they are pub-lished or not. The documents may come from teaching and research institutions in France or abroad, or from public or private research centers.
L’archive ouverte pluridisciplinaire HAL, est destinée au dépôt et à la diffusion de documents scientifiques de niveau recherche, publiés ou non, émanant des établissements d’enseignement et de recherche français ou étrangers, des laboratoires publics ou privés.
Distributed under a Creative Commons Attribution - NonCommercial| 4.0 International License
How Zn can impede Cu detoxification by chelating
agents in Alzheimer’s disease: a proof-of-concept study
Amandine Conte-Daban, Adam Day, Peter Faller, Christelle Hureau
To cite this version:
Amandine Conte-Daban, Adam Day, Peter Faller, Christelle Hureau. How Zn can impede Cu detox-ification by chelating agents in Alzheimer’s disease: a proof-of-concept study. Dalton Transactions, Royal Society of Chemistry, 2016, 45 (39), pp.15671-15678. �10.1039/C6DT02308H�. �hal-01591683�
1
How Zn can impede Cu detoxification by chelating agents in
Alzheimer's Disease: a proof-of-concept study
Amandine Conte-Daban,[a] Adam Day,[a] Peter Faller[a,b] and Christelle Hureau[a],*
Abstract. The role of Cu and Zn ions in Alzheimer's disease is linked to the consequences of
their coordination to the amyloid- (A) peptide, i.e. to the modulation of A aggregation and to the production of Reactive Oxygen Species (ROS), two central events of the so-called amyloid cascade. The role of both ions in A aggregation is still controversial. Conversely the higher toxicity of the redox competent Cu ions (compared to the redox inert Zn ions) in ROS production is acknowledged. Thus the Cu ions can be considered as the main therapeutic target. Because Zn ions are present in higher quantity than Cu ions in the synaptic cleft, they can prevent detoxification of Cu by chelators unless they have an unusually high Cu over Zn selectivity. We describe a proof-of-concept study where the role of Zn on the metal swap reaction between two prototypical ligands and the Cu(Aβ) species has been investigated by several complementary spectroscopic techniques (UV-Vis, EPR and XANES). The first ligand has a higher Cu over Zn selectivity relative to the one of A peptide while the second one exhibits a classical Cu over Zn selectivity. How Zn impacts the effect of the ligands on Cu-induced ROS production and Aβ aggregation is also reported.
[a] A. Conte-Daban, A. Day, Prof. P. Faller, Dr. C. Hureau CNRS, LCC (Laboratoire de Chimie de Coordination)
205 route de Narbonne, BP 44099, 31077 Toulouse Cedex 4 (France) and University of Toulouse, UPS, INPT, 31077 Toulouse Cedex 4 (France) E-mail: christelle.hureau@lcc-toulouse.fr
[b] Prof. Dr. P. Faller
present address: Institute de Chimie (UMR 7177), 4 rue B. Pascal, F-67000 Strasbourg, France
2
INTRODUCTION
Alzheimer’s disease (AD) is the most common cause of dementia in the elderly population with an estimated prevalence of 30 million people worldwide early in the decade.1 AD is a multi-factorial neurodegenerative disease in which many features are involved. This may be the reason why only symptomatic drugs with limited effect are currently available.2 Hence the development of curative treatments is urgently needed. This requires a right understanding of the trafficking between the drug candidate and the biological partners.
In AD, aggregation of the amyloid-β peptide (Aβ), a 40 to 42 amino-acid residues peptide, forming amyloid plaques has been considered to be a central process and an early event in the pathology, known as the amyloid cascade.1, 3, 4 Indeed, while amyloid plaques are observed post-mortem in AD patients' brains, the monomeric soluble Aβ peptide is present in healthy patients. Metal ions, mainly Cu(I/II) and Zn(II), have been related to alteration of the Aβ aggregation process5, 6
and both metal ions are bound to the Aβ peptide within the amyloid plaques.7 It is generally assumed that these metal ions are bound to Aβ under AD conditions, but not in healthy subjects.8 This makes zinc and copper potential therapeutic targets, and hence chelators to remove these metal ions have been developed (for recent reviews, see refs.
8-13
). A milestone article concerning the use of chelators to target metal ions bound to Aβ was the work of Cherny et al. in 2001.14 It was shown that the chelator clioquinol (5-Chloro-7-iodo-quinolin-8-ol) inhibits the accumulation of Aβ in AD model mice. Later the same group showed that a clioquinol derivative named PBT2 improved also the cognitive performance in AD model mice15. More recent works on impact of chelators on AD model mice include the studies of bis-8-aminoquinoline derivatives16 and of so-called metamorphosizers.17 However, these seminal studies did not address the question of which metal is targeted by the chelators. Still now, whether the key target is Cu(I/II) or Zn(II) or both is still uncertain, because the effect of these metal ions on the Aβ aggregation process is dependent on conditions. Indeed, while the impact of Cu(II) and Zn(II) on the aggregation of Aβ and cell toxicity has been studied by different groups and reported in a multitude of publications (see e.g. 18-22 and for recent reviews, see ref. 5, 23), there is no clear trend as results are very condition dependent (concentration, stoichiometry, pH, peptide preparation, etc). However, it is very well established that Zn(II) and Cu(II) do not have the same impact on the aggregation process. Thus it makes a large difference if only one, which one, or both metal ions are targeted by a chelator.
3 In addition, several other factors play a role, like oxidative stress including overproduction of Reactive Oxygen Species (ROS).3 In this context, only Cu(I/II) can catalyse directly the production of ROS, because Zn(II) is redox inert. As a direct consequence, Cu(I/II) ions in contrast to Zn(II) can be considered as the most pertinent biological target in the so-called chelation therapy in the context of oxidative stress.8, 24-27
Zn(II) is the most common metal ion involved in neuronal signal transduction being released by some glutamatergic neurons. Although concentration values reported for Zn(II) vary between studies, they are 10-100 fold higher than for Cu(I/II).3, 8, 28 Aβ peptide, Cu(I/II) and Zn(II) ions are thus all present in the synaptic cleft and both ions can bind to Aβ in its N-terminal part.5 Because Cu(II) and Zn(II) can be bound to the same amino-acid residues of the Aβ peptide, they are in competition for binding to Aβ (see Scheme S1).5, 29, 30
Likewise, they also compete for any other ligands, including chelating drug candidates. This could have a double deleterious impact: (i) assuming that Cu(II) is the target of choice, Zn(II) can impede its detoxification if the chelator binds Zn(II) instead of Cu(II); (ii) considering that Zn(II) is involved in neurotransmission process,31-33 its removal could be detrimental.
In the present article, we investigate the problem of which metal ion binds to which ligand in a 4-partner system with two metal ions (Cu(II) and Zn(II)) and two ligands (Aβ and chelator) in the test tube only. Such metal selectivity issue is an important parameter for chelators to bind the wanted metal ion and is well established in a 3-partner system (the chelator and the two metal ions) for different applications in biology, including in AD as discussed in ref.23. This issue has also been discussed concerning the chelation of metal ions bound to Aβ in a 3-partner system (Aβ and the two metal ions)22, 34, 35 and sometimes inferred for the 4-partner system (see e.g. refs. 12, 25, 36), but no experiment on the 4-partner system have been provided and the question of how specific a chelator has to be was not treated quantitatively. This is the aim of the present report.
In the past, removal of Cu(II) and Zn(II) ions from Aβ has been widely studied but never discussed in terms of mutual interference. More precisely, the capacity to remove Cu(II) only OR Zn(II) only from Aβ was searched even when the two metal ions were studied.25, 27,
36-43
Such chelator formally corresponds to a situation where either KCu >> 1 or KZn >> 1,
where KM is defined in equation 1. Several typical studied chelators, for which the affinities
for Cu and Zn are known, are reminded in the Table 1. They include example of the bis(8-aminoquinoline) series from the Meunier’s group,25, 27 the various ligands from the Lim’s
4 group36-38 and the Schiff base derivatives from the Orvig’s group.39 As can be seen from their KCu values (higher than 1), all of them can remove Cu(II) from Aβ in absence of Zn(II).
However, in presence of Zn(II), most of them mainly extract Zn(II) but not Cu(II) from the peptide; in other words, despite they have a stronger affinity for Cu(II), they are rather selective for Zn(II). Only Schiff base derivatives39 such as the L2 ligand described here44 have
the ability to remove Cu(II) despite the presence of Zn(II). Indeed, to remove Cu(II) from Aβ in the presence of Zn(II), it is not enough that the chelator has a higher Cu(II) affinity than the Aβ. The Cu(II) over Zn(II) selectivity (i.e. affinity of Cu(II) compared to affinity of Zn(II) for a given ligand, SL, equation 3) is crucial. The chelator must have a higher Cu(II) over Zn(II)
selectivity than Aβ (SL >> SAβ, equation 3). In other words, this formally corresponds to a
situation where K >> 1 where K is defined in equation 2 and describes the relative Cu(II) over Zn(II) selectivity of a ligand compare to that of Aβ. Having K >> 1 is not that easy to achieve (Tables 1 and S1) as the Cu(II) over Zn(II) selectivity of Aβ is very high (log (SAβ) = 4.2,
Table 1). The high value of SA is due to a different coordination sphere for Cu(II) and Zn
when bound to the Aβ peptide (Scheme S1). Near physiological pH, Cu(II) is bound to Aβ via the N-terminal amine, the adjacent Asp1-Ala2 carbonyl function, and two imidazole rings from His6 and His13or 14 (so called component I). Another minor species is also present, where the Cu is bound to Aβ via the N-terminal amine, the deprotonated Asp1-Ala2 amide function, a carbonyl function and one imidazole rings from His6 His13 or His14 (so called component II).45 While Zn binding site into Aβ is more debated in the literature,29, 30 recent data support the non-involvement of the N-terminal amine in Zn coordination, a main difference with Cu.46
5
Scheme 1. Top: classical strategy where Zn is not considered corresponding to a situation with low biological
relevance. Bottom: present strategy where Zn is considered in the exchange reaction. Cu removal by a ligand with SL > SA is shown in green and by a ligand with SL < SA in red. In the present study, the Cu:Zn:A:L
stoichiometry was fixed to 1:1:1:1. The complete set of equations describing this situation is detailed in the Supporting Information.
A schematic situation within the synaptic cleft is shown in Scheme 1 and described by the equations and notations given below (with M = Cu(II) or Zn(II)).
Without Zn:
M(Aβ) + (L) Aβ + M(L) is defined by (eq. 1)
where =
and corresponds to the M+ L M(L) equilibrium
With Zn:
Cu(Aβ) + Zn(L) Zn(Aβ) + Cu(L) is defined by (eq. 2)
where =
6 where and corresponds to Cu(L) + Zn Zn(L) + Cu (eq. 3)
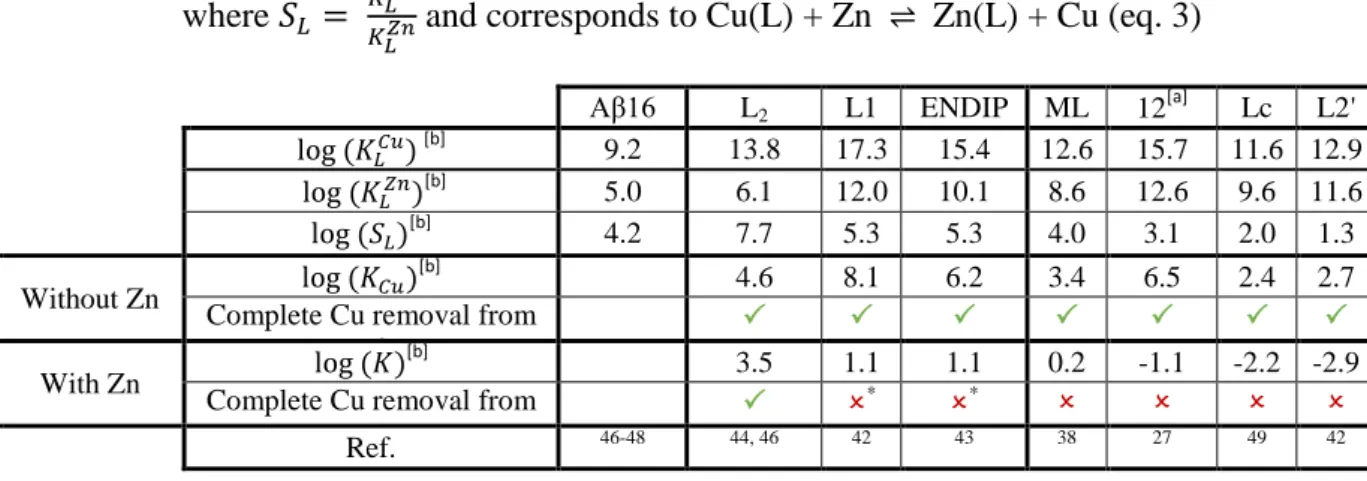
[a] value at pH 7.4 [b] apparent constant value
Table 1. Apparent affinity values at pH 7.1 for Cu and Zn, for A and representative ligands and corresponding KCu and K values in log unit. *: In those cases, the Cu(II) removal from A is partial. For the other ligands
studied in the AD context, see Table S1. Scheme of ligands are given in the Supporting Information (Scheme S2). Only 1:1 M:L complexes were considered here.
Aβ16 L2 L1 ENDIP ML 12 [a] Lc L2' [b] 9.2 13.8 17.3 15.4 12.6 15.7 11.6 12.9 [b] 5.0 6.1 12.0 10.1 8.6 12.6 9.6 11.6 [b] 4.2 7.7 5.3 5.3 4.0 3.1 2.0 1.3 Without Zn [b] 4.6 8.1 6.2 3.4 6.5 2.4 2.7
Complete Cu removal from
Aβ
With Zn
[b] 3.5 1.1 1.1 0.2 -1.1 -2.2 -2.9
Complete Cu removal from
Aβ
* *
7
RESULTS AND DISCUSSION
In the present communication, we illustrate the importance of Zn(II) interference into Cu(II) targeting by ligands, including removing from A and impact on associate events, i.e. ROS production and A aggregation. As a prototypical ligand with an appropriate Cu(II) over Zn(II) selectivity (log (SL2) = 7.7, i.e. SL2 > SAβ)44, 46 we have used a water-soluble Schiff base
derivative noted L2 (in green in Scheme 1) and compare its properties to those of a control
ligand noted Lc (in red in Scheme 1) having an appropriate Cu(II) affinity (log (KCu) = 2.4)
but an inappropriate selectivity (log(SLc) = 2.0, i.e. SLc < SAβ).49 The peptides used here are
either the N-terminal part of the full-length peptide encompassing the residues involved in metal ions coordination (sequence DAEFRHDSGYEVHHQK noted Aβ16) and considered as a valuable and more soluble model of the A403, 50 or the full length Aβ40 peptide, noted Aβ in the following. This is a proof-of-concept study in the sense that the ligands used are not suitable for direct use in vivo due to probable bad Blood Brain Barrier (BBB) penetration ability. Indeed, the main objective is to illustrate the impact of Zn(II) in Cu(II) removal from Aβ, an issue that has been overlooked. It might seem evident to anticipate the outcome of the experiments, since all the affinities of the four complexes are known. However, Zn(II) and Cu(II) bind to several binding sites in fast equilibrium and the main Zn(II) and Cu(II) site do partially overlap.51 This is not a classical situation and it is worth confirming the expected results by a set of complementary experiments. In addition, the approach developed here would also be very useful for other ligand with potential as drug candidates when the affinity constants cannot be determined (for instance due to solubility issue).
8
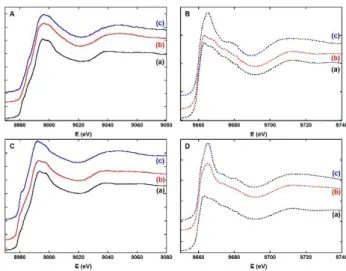
Figure 1. UV-Vis absorption spectra (left) and EPR signatures (right) of (a) Cu(Aβ16), (b) Cu(Aβ16) + Zn(L)
and (c) Cu(L), L = L2 (Top, panels A and B) or Lc (bottom, panels C and D)); For UV-vis experiments: [Aβ16]
= [L] = 0.1 mM, [M] = 0.1 mM, [hepes] = 0.1 M, pH 7.1, T = 25 °C, l = 1 cm; For EPR experiments: [Aβ16] = [L] = [Zn] = 0.20 mM, [Cu] = 0.18 mM, [hepes] = 50 mM, pH 7.1, T = 110 K.
First, Cu(II) removal from Aβ in presence of Zn(II) has been monitored for both L2
and Lc ligands by UV-Vis (Figure 1, left and Figures S1-S2) and EPR (Figure 1, right and Figure S3). UV and EPR signatures show that: (i) for L2 the Cu(II) ion is chelated by the
ligand and not by the peptide (compare traces (b) to traces (a) and (c) in Figure 1, top) and (ii) for Lc, Cu(II) mainly stays bound to Aβ (compare traces (b) to traces (a) and (c) in Figure 1, bottom). To confirm these conclusions by probing both metal centres, XANES (X-ray Absorption Near Edge Structure) measurements were performed. This spectroscopy is the most appropriate: (i) Zn(II) is silent in most of classical techniques and (ii) Cu and Zn K-edges are close enough to be recorded during the same beam-time session. The Cu- and Zn-edges XANES signatures show that: (i) for L2, the Cu(II) is bound to the ligand (compare
traces (b) to traces (a) and (c) in Figure 2, panel A) and the Zn(II) to the Aβ peptide (compare traces (b) to traces (a) and (c) in Figure 2, panel B). This evidences the complete metal exchange between Cu(Aβ) and Zn(L2) and (ii) for Lc, the Cu(II) remains mainly bound to the
Aβ peptide (compare traces (b) to traces (a) and (c) in Figure 2, panel C) and Zn(II) to the ligand ((compare traces (b) to traces (a) and (c) in Figure 2, panel D). This is in line with the absence of metal exchange between Cu(Aβ) and Zn(Lc), although Cu(II) can be removed from Aβ by the control ligand Lc in absence of Zn(II) (Figure S1-S3). Note that the results
9 described here are also obtained when the Zn(II) is pre-incubated with the Cu(Aβ) instead of the ligand.
Figure 2. Normalized Cu (Left, panels A and C) and Zn (Right, panels B and D, dotted lines) K-edges X-ray
absorption near edge structure (XANES) spectra of (a) M(Aβ16) (M = Cu or Zn), (b) Cu(Aβ16) + Zn(L) and (c) M(L), (M = Cu(II) or Zn(II), L = L2 (Top, panels A and B) or Lc (Bottom, panels C and D)); [Aβ16] = [L] = 1.0
mM, [M] = 1.0 mM, [hepes] = 0.1 M, pH 7.1, T = 20 K.
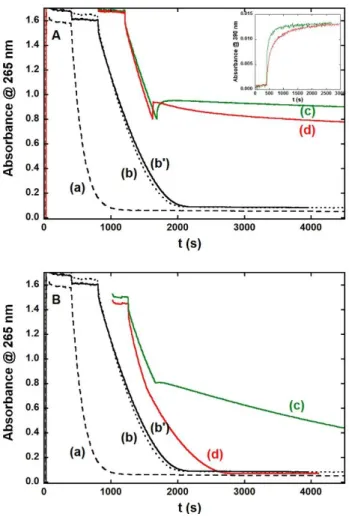
The ability to stop the Cu(Aβ) ROS production is a prerequisite of any Cu(II) chelator in the context of oxidative stress linked to AD. Such ROS production can be studied by proven methods (Scheme S3)35, 44, 52 that rely either on the UV monitoring of consumption of ascorbate (Asc) (Figure 3) or on the detection of the fluorescent 7-OH-CCA formed by reaction between the HO° produced and the 3-CCA (Figure S5). Figure 3, curves a, b and b' show the ascorbate consumption by Cu, Cu(Aβ) and Cu,Zn(Aβ) species. In presence of Aβ, regardless the co-presence of Zn(II), Asc consumption is decreased compared to free Cu(I/II), as previously observed and discussed.35, 44 Curves (c) in panels A and B recorded in absence of Zn(II) show that L2 (panel A) is able to stop Asc consumption by Cu(Aβ) while Lc (panel
B) can slow it down. Note that just after the addition of the L2 (curve (c) panel A), there is an
increase in the absorbance due to the formation of the Cu(L2) complex that absorbs at 265 nm,
the wavelength where the Asc consumption is monitored. Curves (d) in panels A and B show that in presence of Zn(II), L2 (panel A) is able to stop Asc consumption by Cu,Zn(Aβ)
whereas Lc (panel B) has no impact on it, the same trend being observed if Zn(II) is first incubated with the ligand instead of Cu(Aβ) (Figure S6) and if Asc is added at the last chemical reactive (Figure S7). Note that the Asc consumption experiments are confirmed by the CCA experiments (Figure S5). In case of L2, the arrest of Asc consumption is immediate
10 this lag phase, slopes of the Asc consumption are similar for L2 and Zn(L2). This indicates
that the pre-loading of L2 with Zn(II) slightly slows down the arrest of Asc consumption in
line with a slowdown of Cu(II) removal from Aβ by Zn(L2) compared to L2, as monitored by
formation of the Cu(L2) complex (inset in Figure 3, panel A). In summary, these results show
that L2 can arrest ROS production of Cu(Aβ) even in the presence of Zn(II), whereas Lc can
slow it down only in the absence of Zn(II). This is linked to the ability of the Zn(L2) but not of
the Zn(Lc) to remove Cu(II) from Cu(Aβ). In addition, in the course of this experiment, kinetic effects appear when the L2 ligand is preloaded with Zn(II), although not problematic.
11
Figure 3. Ascorbate consumption as a function of time. Time of experiments' starts have been arbitrarily shifted
for the sake of clarity. (a) Cu; (b, b') Cu(Aβ) or Cu,Zn(Aβ), (c) Cu(Aβ) + L, (d) Cu(Aβ) + Zn(L), avec L = L2
(Top, panel A) and L = Lc (Bottom, panel B). Ascorbate is added as the first reactant. The ligands are added when the absorbance at 265 nm ≈ 0.8. [Aβ] = [L] = 12 µM, [Zn] = 12 µM; [Cu] = 10 µM, [Asc] = 100 µM, [hepes] = 0.1 M, pH 7.1, T = 25°C. Inset: monitoring of the Cu(L2) complex formation during the ascorbate
consumption experiments corresponding to curves (c) (green line) and (d) (red line).
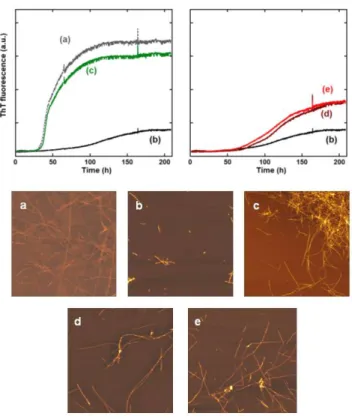
Finally, impact of L2 or Zn(L2) on the Cu(II) modulated Aβ aggregation was
monitored by classical amyloid reporter fluorophore Thioflavine T (ThT) (Figure 4, top). Under the present conditions, aggregation of Aβ in absence or presence of Zn(II) are both characterized by sigmoid-like curves (curves (a) and (d), Figure 4, top), with a first phase corresponding to nucleation, a second one to the elongation and the third one to the plateau. However, the two curves have different kinetic profiles (t1/2 ≈ 50 h for apo-Aβ and t1/2 ≈ 100 h
for Zn(Aβ)), where t1/2 is the time where the ThT fluorescence equals half the value of the
maximum fluorescence. In addition, the maximal ThT fluorescence value is twice higher for the apo-peptide compared to its Zn complex, but numerous fibrils are detected by AFM for both systems (Figure 4, bottom), suggesting that Aβ and Zn(Aβ) both form amyloids fibrils
12 but with different morphology and ThT interaction. Cu(Aβ) aggregation kinetic curve exhibits a less defined process leading to a weaker maximal fluorescence and a longer nucleation phase (t1/2 ≈ 120 h), in line with the detection of oligomers and protofibrils by AFM. When
performed at the beginning of the aggregation process, addition of L2 or Zn(L2) on Cu(Aβ)
induces the formation of apo-type fibrils or Zn-type fibrils, respectively (Figure 4, top, curves (c) and (e)). This indicates Cu(II) removal from Aβ or Cu(II) and Zn(II) exchange between Aβ and L2, respectively. When L2 or Zn(L2) is added later on, similar trends are observed only
if addition is done before the elongation phase (Figure S8). Else if L2 or Zn(L2) addition is
performed on the plateau phase, no modification of the ThT fluorescence is observed although Cu(II) is readily removed from the fibrils as probed by UV-Vis (Figure S9). Deeper investigations are foreseen to delineate the impact of adding the chelator after the formation of the fibrils regardless the presence of Zn(II) and are thus beyond the scope of the present
study.
Figure 4. Top: Kinetic measurement of Aβ aggregates formation using ThT fluorescence. Left: (a) Aβ; (b)
Cu(Aβ) and (c) Cu(Aβ) + L2; Right: (d) Zn(Aβ); (b) Cu(Aβ) and (e) Cu(Aβ) + Zn(L2). [Aβ] = [L2] = [L2-Zn] =
20 µM, [Cu] = 18 µM, [phosphate buffer] = 0.05 M, pH 7.1, T = 37°C. Bottom: AFM pictures corresponding to ThT curves (a-e), 5 µm x 5 µm pictures.
13
CONCLUDING REMARKS
In the present study, we have demonstrated the importance of taking Zn(II) into account when designing Cu(II) chelators against AD. Impact of Zn(II) on the ability to remove Cu(II) from Aβ and to impede related effects on ROS production and peptide aggregation have been investigated. It was shown that in addition to other requirements, such as being able to redox silence the Cu(II) ions and cross the BBB, the ligand has to display a high Cu(II) over Zn(II) selectivity (i.e. higher than the one of A). This condition has been overlooked in the literature and is not so easy to satisfy because Aβ is itself very selective for Cu(II) compared to Zn(II), which is linked to the different binding sites adopted by the two metal centres when bound to Aβ. This suggests that several chelators designed and used in this context (Tables 1 and S1) would chelate only Zn(II) in a synapse, where the high Zn(II):Cu(II) stoichiometry will enhance the effects of the concept described in the present work with a 1:1 Cu(II):Zn(II) ratio. Indeed, the stoichiometric ratio used here represents "the least unfavourable" condition. This is illustrated by the loss of the arrest of ROS production by the L2 ligand in presence of five equivalents of Zn(II) while in presence of one equivalent
of Zn(II) the L2 was able to completely stop the ROS production (Figures S6-S7).
Taking Zn(II) into account when designing Cu(II) chelator is a first step towards studies in biologically pertinent conditions, and on-going works include additional impact of pH, presence of amino-acids and of other ions to be as close as possible to the biological medium. In addition, in the course of the ROS experiments shown here, kinetic issue appears. Indeed, removal of Cu(II) by L2 preloaded with Zn(II) is slower than for the ligand only when
the Cu(Aβ) is producing ROS. In case of the L2 that was not a problem, but similar kinetic
effects could preclude the arrest of ROS production in case of other ligands.
The proof-of-concept shown here for Cu(II) can also apply (i) for Cu(I) chelation, a quite unexplored target, 52 and (ii) for ligands with a redistribution ability. The capacity to re-distribute the Cu(I/II) ions rather than to eliminate them from Aβ seems important since it has been proposed that metal deregulation rather than metal overload is a key parameter in AD.8,
23, 53
Strategies to go further towards potential therapeutic applications include: (i) improving the BBB penetration ability, for instance by addition of sugar moieties,11, 39 or (ii) moving towards multi-functional ligands able to target specific aggregation states, for instance.11, 54
14 Lastly, it is worth mentioning that most if not all amyloid related pathologies (such as Parkinson, ALS, ...) involved also several metal ions (Fe, Cu and Zn) with various toxicity.55 Hence the metal ions selectivity of a chelator relative compared to peptides or proteins of interest and described here for Cu(II), Zn(II) and Aβ is also relevant for other biomolecules and metal ions involved in these diseases.
15
EXPERIMENTAL SECTION.
Chemicals.
Reagents were commercially available and were used as received.
Hepes buffer (sodium salt of 2-[4-(2-hydroxyethyl)piperazin-1-yl]ethanesulfonic acid) was bought from Fluka (bioluminescence grade).
Phosphate buffer were prepared from K2HPO4 and KH2PO4 bought from Fluka.
The Cu(II) and Zn(II) sources were Zn(SO4)(H2O) and Cu(SO4)(H2O)5 and purchased from
Sigma.
A stock solution (5 mM) of ascorbate was prepared in milli-Q water at room temperature just before beginning the experiment. Because ascorbate degrades quickly, a fresh solution was prepared each day.
A stock solution of coumarin-3-carboxylic acid (CCA, 5 mM) was prepared in phosphate buffer (500 mM, pH 7.1) at room temperature. The stock solution was stored at 4°C.
A stock solution of Thioflavine T (ThT) at 250 µM was prepared in water without any further purification with ThT bought from Acros Organics.
Peptides.
Aβ16 peptide (sequence DAEFRHDSGYEVHHQK and referred to as Aβ16) and Aβ40 (sequence DAEFRHDSGYEVHHQKLVFFAEDVGSNKGAIIGLMVGGVV and referred to as Aβ) were bought from GeneCust (Dudelange, Luxembourg) with purity grade > 98%. Stock solutions of the Aβ16 peptide were prepared by dissolving the powder in milliQ water (resulting pH ~ 2) at approx. 10mM. Peptide concentration was then determined by UV-visible absorption of Tyr10 considered as free tyrosine (at pH 2, (ε276-ε296) = 1410 M-1cm-1).
Stock solutions of the Aβ40 peptide were prepared by dissolving the powder in 50mM NaOH at approx. 3mM. Peptide concentration was then determined by UV-visible absorption of Tyr10 considered as free tyrosine (at pH 13, (ε296-ε360) = 2400 M-1cm-1).56 The solutions were
diluted down to the appropriate concentration in peptide. All pH values are given with a ± 0.2 pH unit error.
16 After preparation of the stock solution (see above), Aβ40 peptide is monomerized by FPLC, with a Superdex 75 column. 500 µL of Aβ40 peptide at ~ 3 mM are injected. 15 mM NaOH elutant is used, at 1 mL.min-1. The peptide is detected at 293 nm and at a retention time of approx. 10 min. All the fractions corresponding to the peptide are collected and their concentrations are determined by UV-visible spectroscopy.
X-ray absorption spectroscopy
Cu(II) and Zn(II) K-edge XANES (X-ray absorption near edge structure) spectra were recorded at the BM30B (FAME) beamline at the European Synchrotron Radiation Facility (ESRF, Grenoble, France).57 The storage ring was operated in 7/8+1 mode at 6GeV with a 200mA current. The beam energy was selected using an Si(220) N2 cryo-cooled
double-crystal monochromator with an experimental resolution close to that theoretically predicted (namely ~ 0.5 eV FWHM at the Cu and Zn energy).58 The beam spot on the sample was approximately 300 x 100 µm2 (H x V, FWHM). Because of the low Cu(II) and Zn(II) concentrations, spectra were recorded in fluorescence mode with a 30-element solid state Ge detector (Canberra) in frozen liquid cells in a He cryostat. The temperature was kept at 20 K during data collection. The energy was calibrated with Cu and Zn metallic foils, such that the maximum of the first derivative was set at 8979 and 9659 eV. XANES Cu(II) data were collected from 8840 to 8960 eV using 5 eV step of 2 s, from 8960 to 9020 eV using 0.5 eV step of 3 s, and from 9020 to 9300 eV with a k-step of 0.05 Å-1 and and 3 s per step. XANES Zn(II) data were collected from 9510 to 9630 eV using 5 eV step of 3 s, from 9630 to 9700 eV using 0.5 eV step of 3 s, and from 9700 to 10000 eV with a k-step of 0.05 Å-1 and 3 s per step. For each sample, at least three scans recorded on different spots were averaged and spectra were background-corrected by a linear regression through the pre-edge region and a polynomial through the post-edge region and normalized to the edge jump. XANES samples were prepared from stock solution of peptide, ligands and metallic ions diluted down to approx. 1.0 mM in buffered solution. Samples were frozen in the sample holder after addition of 10% glycerol as a cryoprotectant and stored in liquid nitrogen until used. Cu(II) photoreduction was controlled by recording successive scans at the same spot. It was considered that during the first 20 minutes of recording the photoreduction is insignificant.
Electron Paramagnetic Resonance
Electron Paramagnetic Resonance (EPR) data were recorded using an Elexsys E 500 Bruker spectrometer, operating at a microwave frequency of approximately 9.5 GHz. All spectra
17 were recorded using a microwave power of 20 mW across a sweep width of 150 mT (centred at 310 mT) with modulation amplitude of 0.5 mT. Experiments were carried out at 110 K using a liquid nitrogen cryostat.
EPR samples were prepared from stock solution of peptide and/or ligand diluted down to 0.2 mM in H2O. 0.9 equiv. of 65Cu(II) was added from 25 mM 65Cu(NO3)2 stock solution
prepared in house from a copper foil (Eurisotop). Concentration was determined by formation of the Cu(BCS)23- (BCS=bathocuproinedisulfonic acid, from Sigma-Aldrich) complex in
presence of excess of ascorbate, using a molar extinction coefficient at 483nm of 13000 M-1 cm-1. Samples were frozen in quartz tube after addition of 10% glycerol as a cryoprotectant and stored in liquid nitrogen until used.
UV-Visible spectroscopy
UV-Vis experiments were recorded ona Agilent 8453 UV-Vis spectrometer at 25°C.
Fluorescence Spectroscopy
Fluorescence spectra were measured by using a Fluostar Optima (BMG Labtech) connected to a personal computer.
Thioflavine T measurements
Thioflavin T (ThT), A, Cu(II), Zn(II) and ligands at respective concentrations of 10 µM, 20 µM, 18 µM, 18 µM and 20 µM were mixed in phosphate buffer 50 mM pH 7.1 and placed in 384-well microplate. The time course of ThT fluorescence was then measured (Excitation 440 nm ; Emission 490 nm, bandwidth for emission and excitation 10 nm).
Atomic Force Microscopy (AFM)
Tapping-mode AFM imaging was performed in air on a Smart SPM-1000 microscope (AIST-NT, Novato, USA) equipped with a 100 µm scanner. Sample solutions (20 µM) were deposited on freshly cleaved mica and left for adsorption on the substrate for 10-20 min. They were then rinsed three times with deionized water to remove salts and loosely bound peptide and dried with compressed air before imaging. Commercial Si cantilevers (NanoWorld, Switzerland) with an elastic modulus of ~42 N.m-1 were used. All images were acquired as 512 x 512 pixel images at a typical scan rate of 1.0 kHz with a vertical tip oscillation frequency of 250-350 kHz. Representative images of samples were obtained by scanning at least 5 different locations on at least two different samples of the same chemical system.
18
Coumarin-3-carboxylic acid assay
3-CCA was used to detect HO•. HO• reacts with 3-CCA to form 7-hydroxy-coumarin-3-carboxylic acid (7-OH-CCA), which is fluorescent at 452 nm upon excitation at 395 nm. Under the conditions used in the present study the intensity of the fluorescence signal is proportional to the number of 7-OH-CCA molecules formed. Performing the experiment in phosphate buffer is mandatory to detect formation of HO● since other buffers trap HO●.
Ascorbate consumption assay
Ascorbate consumption was monitored by UV-Vis. Intensity of the Asc absorption band at λ = 265 nm (ε = 14 500 M-1
.cm-1) was monitored as a function of time, with background signal at λ = 800 nm subtracted.
19
ACKNOWLEDGEMENTS
The authors acknowledge Prof. E. Guillon, Drs. S. Sayen and F. Collin, and C. Cheignon for their help in the recording of the XANES data ; Dr. O. Berthoumieu and M. Tasse for their help in acquiring the AFM pictures ; L. Rechignat for the recording of the EPR data and Dr. S. Noël for the L2 synthesis. The authors acknowledge the European Synchrotron Radiation
Facility for provision of beamtime and the FAME staff for their support (20151029). CH thanks the ERC aLzINK - Contract n° 638712 for financial support.
20
References
1. D. M. Holtzman, J. C. Morris and A. M. Goate, Sci. Transl. Med., 2011, 3, 77sr1. 2. J. Godyń, J. Jończyk, D. Panek and B. Malawska, Pharmacol. Rep., 2016, 68, 127. 3. C. Hureau, Coord. Chem. Rev., 2012, 256, 2164.
4. S. H. Barage and K. D. Sonawane, Neuropeptides (Edinburgh), 2015, 52, 1. 5. P. Faller, C. Hureau and O. Berthoumieu, Inorg. Chem., 2013, 52, 12193. 6. A. Tiiman, P. Palumaa and V. Tõugu, Neurochem. Int., 2013, 62, 367.
7. L. M. Miller, Q. Wang, T. P. Telivala, R. J. Smith, A. Lanzirotti and J. Miklossy, J. Struct.
Biol., 2006, 155, 30.
8. K. J. Barnham and A. I. Bush, Chem. Soc. Rev., 2014, 43, 6727. 9. A. Budimir, Acta Pharm., 2011, 61, 1.
10. J. S. Derrick and M. H. Lim, ChemBioChem, 2015, 16, 887.
11. C. Rodriguez-Rodriguez, M. Telpoukhovskaia and C. Orvig, Coord. Chem. Rev., 2012, 256, 2308.
12. M. G. Savelieff, A. S. DeToma, J. S. Derrick and M. H. Lim, Acc. Chem. Res., 2014, 47, 2475.
13. A. Robert, Y. Liu, M. Nguyen and B. Meunier, Acc. Chem. Res., 2015, 48, 1332.
14. R. A. Cherny, C. S. Atwood, M. E. Xilinas, D. N. Gray, W. D. Jones, C. A. McLean, K. J. Barnham, I. Volitakis, F. W. Fraser, Y. Kim, X. Huang, L. E. Goldstein, R. D. Moir, J. T. Lim, K. Beyreuther, H. Zheng, R. E. Tanzi, C. L. Masters and A. I. Bush, Neuron, 2001, 30, 665.
15. P. A. Adlard, R. A. Cherny, D. I. Finkelstein, E. Gautier, E. Robb, M. Cortes, I. Volitakis, X. Liu, J. P. Smith, K. Perez, K. Laughton, Q. X. Li, S. A. Charman, J. A. Nicolazzo, S. Wilkins, K. Deleva, T. Lynch, G. Kok, C. W. Ritchie, R. E. Tanzi, R. Cappai, C. L. Masters, K. J. Barnham and A. I. Bush, Neuron, 2008, 59, 43.
16. J. Ceccom, F. Coslédan, H. Halley, B. Francès, J. M. Lassalle and B. Meunier, PloS One, 2012, 7, e43105.
17. M. W. Beck, S. B. Oh, R. A. Kerr, H. J. Lee, S. H. Kim, S. Kim, M. R. Jang, Brandon T. , J.-Y. Lee and M. H. Lim, Chemical Science, 2015, 6, 1879.
18. C. Opazo, X. Huang, R. A. Cherny, R. D. Moir, A. E. Roher, A. R. White, R. Cappai, C. L. Masters, R. E. Tanzi, N. C. Inestrosa and A. I. Bush, J. Biol. Chem., 2002, 277, 40302.
19. X. Huang, C. S. Atwood, M. A. Hartshorn, G. Multhaup, L. E. Goldstein, R. C. Scarpa, M. P. Cuajungco, D. N. Gray, J. Lim, R. D. Moir, R. E. Tanzi and A. I. Bush, Biochemistry, 1999, 38, 7609.
20. Y. Yoshiike, K. Tanemura, O. Murayama, T. Akagi, M. Murayama, S. Sato, X. Sun, N. Tanaka and A. Takashima, J. Biol. Chem., 2001, 276, 32293.
21 21. M. P. Cuajungco and K. Y. Faget, Brain Res. Rev., 2003, 41, 44.
22. V. Tõugu, A. Karafin, K. Zovo, R. S. Chung, C. Howells, A. K. West and P. Palumaa, J.
Neurochem., 2009, 110, 1785.
23. K. P. Kepp, Chem. Rev., 2012, 112, 5193.
24. G. Eskici and P. H. Axelsen, Biochemistry, 2012, 51, 6289.
25. M. Nguyen, A. Robert, A. Sournia-Saquet, L. Vendier and B. Meunier, Chemistry - A
European Journal, 2014, 20, 6771.
26. M. P. Cuajungco, L. E. Goldstein, A. Nunomura, M. A. Smith, J. T. Lim, C. S. Atwood, X. Huang, Y. W. Farrag, G. Perry and A. I. Bush, J. Biol. Chem., 2000, 275, 19439.
27. C. Deraeve, C. Boldron, A. Maraval, H. Mazarguil, H. Gornitzka, L. Vendier, M. Pitié and B. Meunier, Chemistry- A European Journal, 2008, 14, 682.
28. M. G. Savelieff, S. Lee, Y. Liu and M. H. Lim, ACS Chem. Biol., 2014, 8, 856. 29. V. Tôugu and P. Palumaa, Coord. Chem. Rev., 2012, 256, 2219.
30. C. Migliorini, E. Porciatti, M. Luczkowski and D. Valensin, Coord. Chem. Rev., 2012, 256, 352.
31. N. L. Bjorklund, V. M. Sadagoparamanujam and G. Taglialatela, J. Neurosci. Methods, 2012, 203, 146.
32. S. Bohic, J. F. Ghersi-Egea, J. Gibon, P. Paoletti, J. Arnaud, S. Hunot, A. Boom and A. Bouron, Rev. Neurol. (Paris). 2011, 167, 269.
33. C. J. Frederickson, J. Y. Koh and A. I. Bush, Nat. Rev. Neurosci., 2005, 6, 449.
34. C. A. Damante, K. Ösz, Z. Nagy, G. Grasso, G. Pappalardo, E. Rizzarelli and I. Sóvágó,
Inorg. Chem., 2011, 50, 5342.
35. B. Alies, I. Sasaki, O. Proux, S. Sayen, E. Guillon, P. Faller and C. Hureau, Chem. Commun., 2013, 49, 1214.
36. M. G. Savelieff, Y. Liu, R. R. P. Senthamarai, K. J. Korshavn, H. J. Lee, A. Ramamoorthy and M. H. Lim, Chem. Commun., 2014, 50, 5301.
37. J.-S. Choi, J. J. Braymer, R. P. R. Nanga, A. Ramamoorthy and M. H. Lim, Proc. Natl. Acad.
Sci. U. S. A., 2010, 107, 21990.
38. S. Lee, X. Zheng, J. Krishnamoorthy, M. G. Savelieff, H. M. Park, J. R. Brender, J. H. Kim, J. S. Derrick, A. Kochi, H. J. Lee, C. Kim, A. Ramamoorthy, M. T. Bowers and M. H. Lim, J.
Am. Chem. Soc., 2014, 136, 299.
39. T. Storr, M. Merkel, G. X. Song-Zhao, L. E. Scott, D. E. Green, M. L. Bowen, K. H. Thompson, B. O. Patrick, H. J. Schugar and C. Orvig, J. Am. Chem. Soc., 2007, 129, 7453. 40. D. E. Green, M. L. Bowen, L. E. Scott, T. Storr, M. Merkel, K. Böhmerle, K. H. Thompson,
B. O. Patrick, H. J. Schugar and C. Orvig, Dalton Trans., 2010, 39, 1604.
41. T. Storr, L. E. Scott, M. L. Bowen, D. E. Green, K. H. Thompson, H. J. Schugar and C. Orvig,
22 42. A. K. Sharma, S. T. Pavlova, J. Kim, D. Finkelstein, N. J. Hawco, N. P. Rath, J. Kim and L.
M. Mirica, J. Am. Chem. Soc., 2012, 134, 6625.
43. A. Lakatos, v. Zsigo, D. Hollender, N. V. Nagy, l. Fülöp, D. Simon, Z. Bozso and T. Kiss,
Dalton Trans., 2010, 39, 1302.
44. S. Noël, F. Perez, S. Ladeira, S. Sayen, E. Guillon, E. Gras and C. Hureau, J. Inorg. Biochem., 2012, 117, 322.
45. C. Hureau and P. Dorlet, Coord. Chem. Rev., 2012, 256, 2175.
46. S. Noël, S. Bustos, S. Sayen, E. Guillon, P. Faller and C. Hureau, Metallomics, 2014, 6, 1220. 47. T. Kowalik-Jankowska, M. Ruta, K. Wisniewska and L. Lankiewicz, J. Inorg. Biochem.,
2003, 95, 270.
48. I. Zawisza, M. Rozga and W. Bal, Coord. Chem. Rev., 2012, 256, 2297.
49. A. P. Katkov, T. A. Matkovskaya, N. I. Krutikova, A. S. Monakhov and N. M. Dyatlova,
Russ. J. Inorg. Chem., 1991, 391, 693.
50. V. Minicozzi, F. Stellato, M. Comai, M. Dalla Serra, C. Potrich, W. Meyer-Klaucke and S. Morante, J. Biol. Chem., 2008, 283, 10784.
51. P. Faller, C. Hureau and G. La Penna, Acc. Chem. Res., 2014, 47, 2252.
52. E. Atrian-Blasco, E. Cerrada, A. Conte-Daban, D. Testemale, P. Faller, M. Laguna and C. Hureau, Metallomics, 2015, 7, 536.
53. D. J. Bonda, H.-g. Lee, J. A. Blair, X. Zhu, G. Perry and M. A. Smith, Metallomics, 2011, 3, 267.
54. S. Noël, S. Cadet, E. Gras and C. Hureau, Chem. Soc. Rev., 2013, 42, 7747.
55. H. Kozlowski, M. Luczkowski, M. Remelli and D. Valensin, Coord. Chem. Rev., 2012, 256, 2129.
56. P. Faller, C. Hureau, P. Dorlet, P. Hellwig, Y. Coppel, F. Collin and B. Alies, Coord. Chem.
Rev., 2012, 256, 2381.
57. O. Proux, X. Biquard, E. Lahera, J. J. Menthonnex, A. Prat, O. Ulrich, Y. Soldo, P. Trévisson, G. Kapoujvan, G. Perroux, P. Taunier, D. Grand, P. Jeantet, M. Deleglise, J.-P. Roux and J.-L. Hazemann, Phys. Scr., 2005, 115, 970.
58. O. Proux, V. Nassif, A. Prat, O. Ulrich, E. Lahera, X. Biquard, J. J. Menthonnex and J.-L. Hazemann, J Synchrotron Radiat., 2006, 13, 59.
23 Because Zinc ions are co-localized with Copper ions in the synaptic cleft, they can prevent Cu removal from the amyloid- peptide and the resulting Cu detoxification by a chelator, unless it has a Copper over Zinc selectivity higher than the amyloid- peptide.
![Figure 1. UV-Vis absorption spectra (left) and EPR signatures (right) of (a) Cu(Aβ16), (b) Cu(Aβ16) + Zn(L) and (c) Cu(L), L = L 2 (Top, panels A and B) or Lc (bottom, panels C and D)); For UV-vis experiments: [Aβ16]](https://thumb-eu.123doks.com/thumbv2/123doknet/13662109.429671/9.892.268.621.106.467/figure-absorption-spectra-signatures-right-panels-panels-experiments.webp)