HAL Id: cea-02509263
https://hal-cea.archives-ouvertes.fr/cea-02509263
Submitted on 16 Mar 2020
HAL is a multi-disciplinary open access
archive for the deposit and dissemination of
sci-entific research documents, whether they are
pub-lished or not. The documents may come from
teaching and research institutions in France or
abroad, or from public or private research centers.
L’archive ouverte pluridisciplinaire HAL, est
destinée au dépôt et à la diffusion de documents
scientifiques de niveau recherche, publiés ou non,
émanant des établissements d’enseignement et de
recherche français ou étrangers, des laboratoires
publics ou privés.
Spent Fuel Pool
L. Chomat, A. Benakli, P. Le Bescop, J. Wall
To cite this version:
L. Chomat, A. Benakli, P. Le Bescop, J. Wall. Boric acid attack of the reinforced concrete used in
Spent Fuel Pool. GLOBAL 2015, Sep 2015, Paris, France. �cea-02509263�
Proceedings of Global 2015 September 20-24, 2015 - Paris (France) Paper 5452
Boric acid attack of the reinforced concrete used in Spent Fuel Pool
CHOMAT Laure1,*, BENAKLI Anouchka1, LE BESCOP Patrick1, WALL James2
1CEA, DEN, DPC, SECR, Laboratory of Study of Concrete and Clay Behavior, CEA Saclay, Bâtiment 158, 91191 Gif/Yvette
Cedex, France.
2
EPRI, Electric Power Research Institute, Charlotte, NC 28262, USA.
* Corresponding Author, E-mail: laure.chomat@cea.fr
Abstract –In the framework of Spent Fuel Pools (SFP) lifetime studies, an investigation of the concrete degradation in
aqueous boric acid has been requested by the Electric Power Research Institute. The main goal of this study is to identify the physico-chemical degradation mechanisms involved in a boric acid medium. A well-tested methodology for testing cementitious materials degradation in other solutions (water, sulfate solution…) was applied. This methodology involved an experimental study and computational modeling. For the particular case of boric acid attack, a multi-scale approach was used; concrete as well as its main components (cement paste and aggregates) were studied. The degradation experiments were carried out for three to eight months in 2400ppm boric acid solution. Aggressive solution conditions were maintained by pH regulation and periodical renewal. Characterization concerned the composition of the degradation solution during the experiments, as well as the mineralogical evolution of the degraded cementitious materials at the end of the experiments. Solution analysis was performed by ionic-chromatography and solid characterizations were carried out by the means of XRD and SEM observations. The study of the Portland cement paste degradation shows that the leaching mechanism is driven by diffusion. The degradation kinetics in boric acid is higher than the one in pure water. The process of concrete degradation is more complex; a nonlinear behavior of the calcium leaching over square root of degradation duration can be noticed. Besides, an additive contribution of cement paste and aggregates on the leached elements from concrete is suggested. Nevertheless, the degraded thickness ranges from 2400 µm to 2800 µm, which is significantly lower than the one obtained in cement paste at the same duration (3400 µm). This observation is quite unexpected and could indicate a possible surface dissolution. Finally, reactive transport numerical calculations are carried out with HYTEC platform to be confronted to experimental results. The first results on cement paste degradation are encouraging; the four zones composing the degraded Portland cement paste profile pattern that were identified experimentally are obtained from numerical simulation. This modeling work must be continued to improve the description of the degradation kinetisc on cement paste and to include the modeling of concrete degradation.
I. INTRODUCTION
Spent Fuel Pools (SFP) at pressurized water reactors are reinforced concrete structures lined by with stainless steel plates and containing borated water. The long-term leakage of SPF is a concern as it could induce concrete degradation as well as reinforcement corrosion. The initially acidic borated water (pH ~ 5) could react with concrete and could induce chemical and potentially structural degradation. The aim of this work is to identify the physico-chemical mechanisms involved in boric acid degradation of concrete.
The methodology used was carried out on different aggressive media [1]. It implies experimental and modeling approaches. The degradation experiments are performed on concrete samples as well as its main components (cement paste and aggregates). Solution analyses and solid characterizations are carried out to determine the chemical
evolution of the system. Reactive transport numerical calculations are associated to confirm degradation processes involved. In this study, these calculations are performed on Portland cement paste degradation in boric acid and compared to experimental results.
II. EXPERIMENTAL PARAMETERS Three types of sample were tested: aggregate, cement paste and concrete.
II.A. Aggregate Samples
Dolomitic limestone aggregates were entirely embedded in a bi-composed epoxy resin (Resoltech 3030®). After drying for 48h at ambient pressure and temperature, a slice was cut using a diamond wire saw.
II.B. Cementitious material Samples
Samples were prepared according to the proportions quoted in Table I. The cement used is a Portland cement type I/II certified according to ASTM 150-04 [2].
TABLE I
Composition of the cementitious material mixture prepared for the laboratory experiments
Components (kg.m-3) Cement paste Concrete
Cement 1394 370
Water 533 200
Aggregate - 1070
Sand - 660
w/c ratio 0.4 0.53
The water-to-cement ratio for concrete sample is 0.53. This ratio is recalculated for cement paste samples to be representative of the one of the cement paste in concrete (water adsorption on the surface of aggregates is taken into account).
Cement paste and concrete were poured in cylindrical molds (respectively Ø=70 mm / h=110 mm and Ø=110 mm / h=220 mm). Cylindrical sides of the samples have been entirely covered with bi-composed epoxy resin Resoltech 3030® to ensure unidirectional degradation from the bottom to the top of the cylinder. Samples were cured in a saturated limewater solution for at least one month.
Prior to degradation experiments, 2cm-thickness-slices were prepared.
II.C. Experimental procedure degradation
Each type of samples is degraded in a boric acid solution (H3BO3) at a concentration of 2400 ppm, corresponding to a pH of 5.3. The concentration of the degradation solution was chosen to be representative of SFP solution. Temperature was regulated by external heating, and pH by acid nitric addition, assessed by the titrator Titroline, connected to the reactor by a pH probe. The procedure is detailed in [1].
TABLE II
Degradation parameters (Solution volume-to-sample surface exposed ratios -V/S- and duration) for each material studied.
Studied material V/S (dm) Degradation duration Concrete
(Dolomitic Limestone) 2.6 8 months Portland cement paste 6.3 3 and 8 months
Aggregate 3.8 146 days
Table II presents, for each studied material, the experimental parameters: the solution volume over the reactive surface and the duration.
II.C. Analytical methods
Throughout the experiment, the degradation solution was analyzed by Ionic-Chromatography with a Metrohm 940 Professionnal IC-Vario Ion Chromatograph to determine its ionic composition and ion flux released from cementitious materials.
At the end of each experiment, degraded depths were estimated. For cementitious material, the degraded zone was revealed using the standard phenolphthalein test for carbonation. For the cement paste samples, XRD was been performed to obtain the mineralogical composition of the sound material and that of the degraded cement paste samples. Data were collected using a PAnalytical X’Pert diffractometer using X’Celerator detector (CuKα, λ = 1.5405 Å). Cement paste samples were scanned between 5° and 65° with a step size of 0.017°, for a total duration of 26 minutes.
III. EXPERIMENTAL RESULTS
III.A. Solution analysis
Fig. 1 shows the total cumulative amount of calcium leached compared with the total cumulative amount of nitrate added to regulate the degradation solution pH all along experiment. Solution analysis obtained for three and eight-month degradation experiments are similar, showing a good reproducibility of experiments. Both cumulative amounts of calcium and nitrate increase linearly over square root of time and their leaching rates can be correlated with a well defined coefficient, as reported on Table III. This is typically attributed to a degradation process driven by diffusion.
Fig. 1. Cumulative amount of leached calcium and added nitric acid reported to the surface of Portland cement paste exposed to the degradation solution [mmol.dm-2] over square root of
0 100 200 300 400 500 600 700 1 3 5 7 9 11 13 15 17 C u m u la ti v e a m o u n t o f a d d e d n it ri c a c id le a c h e d c a lc iu m [ m m o l. d m -²]
Degradation duration [days1/2]
8-month experiment - Leached calcium 3-month experiment - Leached calcium Pure water experiment - Leached calcium 8-month experiment - Added acid
Proceedings of Global 2015 September 20-24, 2015 - Paris (France) Paper 5452
degradation duration [days1/2]. Experimental results have been compared to Portland cement degradation in pure water results in dashed line [3]. The relative error of each analysis has been estimated as 1.8%.
Results obtained on calcium and nitrate have been compared with those obtained with Portland cement paste degraded in pure water [3]. Both calcium and nitrate cumulative amount released and their leaching rates are higher in boric acid solution, as reported in Table III and Fig. 1.
The higher nitrate cumulative amount released is coherent with the acid pH of the degradation solution. Also, the higher calcium leaching rate suggests higher kinetics of Portland cement paste degradation process in boric acid than in pure water.
TABLE III
Calcium and nitrate leaching rate of three and eight-month degradation of Portland cement paste in boric acid indicated with
correlation coefficient, and comparison with pure water degradation [3]. Aggressive solution Duration (months) Leaching rate [Ca2+] [mmol.dm-2 .days-1/2] Leaching rate [NO3-] [mmol.dm-2 .days-1/2] Leaching rates ratio of [NO3-] / [Ca2+] Boric acid solution 3 19.6 R² = 0.9981 37.9 R² = 0.9989 1.93 8 R² = 0.9991 19.3 R² = 0.9992 37.7 1.96 Pure water [3] 3 15.1 31.7 2.1
Finally, calcium-over-nitrate leaching rate ratios have been compared between the pure water and the boric acid degradation of Portland cement paste. In pure water as well as in boric acid solution, nitrate-over-calcium leaching rate ratio is nearly 2 which mean that the amount of nitrate added is almost completely involved in compensating the ion charges due to calcium leaching. That suggests that decalcification is the major process involved in degradation process.
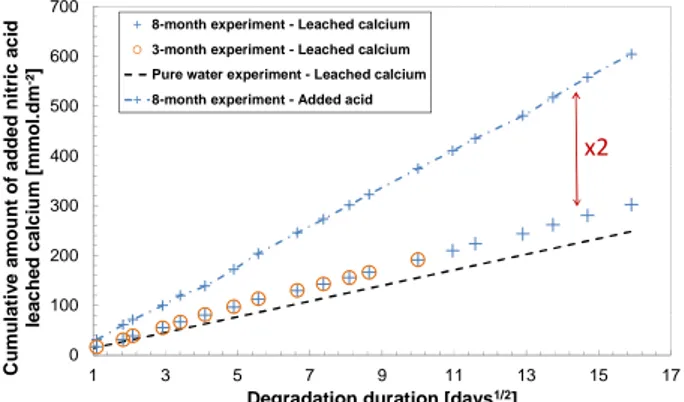
Contrary to the Portland cement paste, the total degradation of aggregates and of concrete (B-DL) does not seem to be a diffusion driven process. Indeed a nonlinear behavior of the calcium leaching over square root of degradation duration can be noticed (Fig. 2). The same observations can be drawn concerning the added nitrate evolution. The results obtained on concrete sample have been compared to the experimental results of their main components (Portland cement paste and dolomitic limestone aggregate) degradation in boric acid normalized in the exposed surface. The leaching rate of calcium is higher than that in the normalized-surface Portland cement paste. The addition of the contribution of Portland cement paste and Dolomitic Limestone leaching rates can successfully describe the concrete leaching rate regarding calcium and added nitrate (dashed lines in Fig. 2).
Fig. 2. Cumulative amount of leached calcium and added nitric acid reported to the surface of concrete sample (B-DL) exposed to the degradation solution [mmol.dm-2] over square root of degradation duration [days1/2]. Experimental results have been compared to the sum of the relative contribution of the leaching of Portland cement paste (CEM I) and the one of dolomitic limestone aggregates (DL).
The same type of observation can be done for the magnesium leaching rate obtained from concrete degradation, except that the aggregate contribution is higher than the one of cement paste degradation. This observation is concistent with the composition of aggregates.
III.B. Solid characterization
Degraded zone depths
At the end of each experiment, the degraded zone depths of tested samples were characterized (Table IV).
Table IV: Resume of degraded zone depths for samples degraded in boric acid solution. Results obtained on cement paste sample are compared to Portland cement paste degradation in pure water
[3]. Material Aggressive solution Duration (months) Degraded depths (mm) Leaching rate (mm.day-1/2) Cement paste Boric acid solution 3 2.3 – 2.5 0.24 ± 0.02 8 3.3 – 3.5 0.21 ± 0.01 Pure water [3] 3 1.82 0.19 Aggregates Boric acid
solution 5 0.5 – 0.6 - Concrete Boric acid
solution 8 2.4 – 2.8 -
First, we notice a notable increase of the degraded zone depths between the three and the eight-month degraded Portland cement paste sample. As cement paste degradation is a diffusion driven process, a leaching rate could be deduced from these measurements. The leaching rates deduced are comparable, but both are higher than the one obtained in pure water experiment. This suggests faster
0 50 100 150 200 250 300 350 400 450 0 5 10 15 C u m u la ti v e a m o u n t o f a d d e d n it ra te a n d le a ch e d c a lc iu m ( m m o l/ d m ²)
Degradation duration (days1/2)
HNO3 : B-DL - Recorded by the Titrator HNO3 : B-DL - Analyzed by IC Ca :- B-DL
HNO3 : 49.1% DL + 31.8% CEM I Ca : 49.1% DL + 31.8% CEM I
kinetics of Portland cement paste degradation in boric acid than in pure water. This observation is consistent with the higher calcium leaching rate obtained from solution degradation analysis.
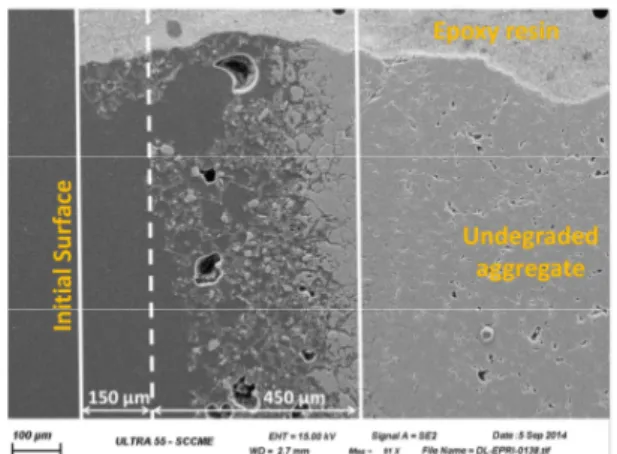
The degraded zone depth determined for concrete (2400 - 2800 µm) is lower than the one obtained for Portland cement paste degradation at the same duration (3400 µm). This observation is in disagreement with the solution analysis. The discrepancy could be associated to surface dissolution of the material. This phenomenon is observed in the case of dolomitic limestone aggregates degradation in boric acid solution. The degraded zone depth is about some hundreds of micrometers in thickness and includes a notable part of total superficial dissolution of the aggregates (Fig. 3).
Fig. 3: SE-SEM observation of dolomitic limestone aggregates degraded in boric acid solution.
Mineralogical evolution in cement paste
The mineralogical evolution was studied by XRD analysis. Fig. 4 reports profile patterns of the three-month degraded Portland cement paste.
Fig. 4: XRD pattern of the different zones, homogenous in composition, identified in Portland cement paste degraded in
boric acid solution.
The XRD diagrams have been recorded at different depths of the degraded material by successive abrading.
Four zones, homogenous in composition, have been identified (Fig. 4):
- the first zone (Zone 1) corresponding to the external edge of the sample contains any crystalline hydrates, except hydrotalcite, and decalcified C-S-H,
- the second zone (Zone 2) is characterized by the appearance of the specific spread peak corresponding to C-S-H,
- the third zone (Zone 3) contains all the phases of the cement except portlandite,
- the fourth zone (Zone 4) is the unaltered zone of the cement paste.
More detailed XRD analysis of the two degradation experiments carried out on cement paste can be found in [4]. A reprecipitation of Ettringite in Zone 3 is suggested by XRD analysis. This phenomenon could be due to decreasing gradients in calcium and hydroxyls between the unalterated zone and the surface [5]. It could also be linked to the presence of Ettringite-like phases including boron, such as Boro-AFt or Boro-AFm [6,7,8,9]. Neither such phases nor other crystalline phases incorporating boron have been clearly identified from XRD.
IV. FIRST MODELING WORKS II.A. Reactive transport modelling
Reactive transport code of HYTEC version 3.7 is used to simulate the 1-D degradation experimentation of Portland cement paste in a boric acid solution. In our study, simulations are performed considering chemical reactions at thermodynamic equilibrium (without kinetics). Diffusion is the only transport mechanism taken into account. The correction of the effective diffusion coefficient induced by porosity changes, due to precipitation or dissolution, can be performed by HYTEC according to a modified version of Archie’s law [10].
The database used is Thermoddem database (version 2011) [11-13]. The crystallized C-S-H type phases are excluded from the calculation. C-S-H is defined by a discrete description. The database has been extended to include boron species in solution [8, 9] and mineral phases [9, 14-17]. An extended Debye-Hückel model, B-Dot, as ionic strength model is used.
II.A. Description of the modelled system
The simulated 1D-system is described in Fig. 5. The cement paste is modelled as a rectangle 1 cm by 1 cm with 100 µm size mesh. The cementitious matrix is in contact with the degradation solution on its left, modelled as one mesh. 5 10 15 20 25 30 35 40 45 50 55 60 65 17.66 8.84 5.90 4.44 3.56 2.98 2.56 2.25 2.01 1.82 1.67 1.54 1.43 Hyd C4AF C4AF C4AF 2θ (deg) d-spacing (Å) Zone 1 Hyd Zone 2 C4AF C4AF P : Portlandite C : Calcite E : Ettringite Q : Quartz C4AF: brownmillerite Hyd : Hydrotalcite CSH Zone 3 E E CSH P P P P P P E E E E Zone 4 Q
Proceedings of Global 2015 September 20-24, 2015 - Paris (France) Paper 5452
Fig. 5: Scheme of the 1-D system dedicated to Portland cement paste simulation.
The initial composition of the cement paste is calculated and reported in Table V.
Table V: Portland cement paste mineralogical composition calculated with the extended Thermoddem database, and B-Dot as ionic strength model.
Mineralogical components (g/100g of cement)
Portlandite (Ca(OH)2) 280.4
CSH (1.6) (1.6CaO.SiO2.2.4H2O) 658.9
Monocarboaluminate (3CaO. Al2O3. CaCO3.11H2O) 199.6
Ettringite (3CaO.Al2O3.3CaSO4.32H2O) 137.8
Hydrotalcite Mg6Al2(CO3)(OH)16·4(H2O)) 80.9
Calcite (CaCO3) 10.8 This composition is obtained considering a partial dissolution of the anhydrous phase containing iron, C4AF. Moreover, Fe3+ has been assimilated to Al3+, as they both have same intercalation properties, to avoid redox reactions issues.
The effective diffusion coefficient considered in the matrix is 5.2 10-12 m²/s [18, 19] and the porosity is 0.203, corresponding to the calculated one.
The external solution is a 2400 ppm boric acid solution with fixed temperature of 25°C. The diffusion coefficient in the solution was established at 2.10-9 m²/s, which corresponds to the diffusion coefficient of ions in solution, and the porosity is 1. To ensure the degradation solution homogeneity, a fixed concentration of 2400 ppm of boric acid is imposed on its left boundary.
IV.A. Preliminary modelling results
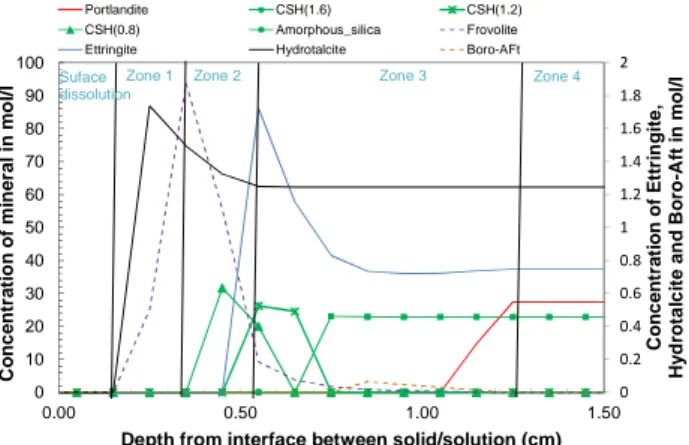
Fig. 6 presents the profile pattern of the degraded Portland cement paste obtained for 250 simulated days.
Due to convergence issue, calculations were performed without considering the feedback of porosity variation on diffusion coefficient. Thus, only the nature of the minerals present, and the different zones can be discussed.
The results indicate that a surface dissolution occurs; the interface moves in the depth of the cement paste. This process has not been observed in cement paste degradation.
Fig. 6: Numerical simulation of a Portland cement paste profile pattern after 250 days of degradation in a 2400 ppm boric acid solution.
Concerning mineral phases that are present in the material, four zones with different mineralogical composition were identified. Those four zones are similar to the ones identified by experimental characterization of the degraded Portland cement paste. The decalcification process involves portlandite dissolution and C-S-H decalcification. We noticed a reprecipitation of ettringite the border of the zone 2 and 3. This reprecipitation has also been experimentally suggested. In the discussion on the experimental profile pattern, was mentioned the hypothesis of the Boro-AFt formation during degradation. In numerical simulation results, the precipitation of Boro-AFt mineral phase is also observed in, and should therefore be considered as a strong hypothesis.
Finally, the precipitation of the calcium borate mineral phase Frovolite CaB3O3(OH)5 can be found in zone 1 and 2 (Fig. 6). This mineral phase has not been observed experimentally and its precipitation is unlikely. Consequently, work on the boron-bearing minerals, to be considered in the calculations, is the next step. Numerical simulation considering porosity variation is also needed.
V. CONCLUSIONS
A study of the concrete degradation in a boric acid solution was carried out to identify the physico-chemical mechanisms of boric acid degradation. Both experimental and modeling approaches were considered. Concrete as well as its main components (cement paste and aggregate) have been considered.
A complete analysis of the degradation solution during 1-D degradation experiments allowed us to establish that decalcification is probably the major process involved in Portland cement paste degradation in boric acid. Contrary to cement paste degradation, concrete degradation does not seem to be a diffusion driven process. The evolution of
Cementitious matrix B o u n d a ry co n d it io n s E x te rn a l so lu ti o n 100 µm, 1 node 1 cm, 100 nodes 0 0.2 0.4 0.6 0.8 1 1.2 1.4 1.6 1.8 2 0 10 20 30 40 50 60 70 80 90 100 0.00 0.50 1.00 1.50 C o n c e n tr a ti o n o f E tt ri n g it e , H y d ro ta lc it e a n d B o ro -A ft i n m o l/ l C o n c e n tr a ti o n o f m in e ra l in m o l/ l
Depth from interface between solid/solution (cm)
Portlandite CSH(1.6) CSH(1.2)
CSH(0.8) Amorphous_silica Frovolite
Ettringite Hydrotalcite Boro-AFt
Zone 1 Zone 2 Zone 3 Zone 4
Suface dissolution
leached elements and added nitric acid seems to be equivalent to the sum of the relative contribution of cement paste and aggregates. The difference of degraded thickness from cement paste and concrete (of about 1000 µm) is quite unexpected and could indicate possible surface dissolution.
The results obtained with the reactive transport code, HYTEC, are encouraging. The four zones composing the degraded Portland cement paste profile pattern that were identified experimentally are also obtained from numerical simulation. The next step involves work on the boron-bearing phase to be considered and on the feedback of porosity evolution (clogging or opening) on diffusive transport properties.
ACKNOWLEDGMENTS
The authors would like to thank EPRI for its financial support.
REFERENCES
1. F. Adenot and M. Buil, “Modeling of the corrosion of the cement paste by deionized water”, Cement and
Concrete Research, 22, 489-496 (1992).
2. ASTM C150-04, ASTM International West Conshohocken, “Standard Specification for Portland
Cement”, Pennsylvania (2004).
3. H. Peycelon, C. Blanc and C. Mazoin, “Long-term behavior of concrete: Influence of temperature and cement binders on the degradation (decalcification /hydrolysis) in saturated conditions”, Revue européenne de génie civil, 10, 1107-1125 (2006).
4. A. Benakli, L. Chomat, P. Le Bescop and J. Wall, “Experimental and modeling study of Portland cement paste degradation in boric acid”, Proc. of Fontevraud 8, Avignon, France (2014).
5. P. Faucon, F. Adenot, “Behaviour of crystallised phases of Portland cement upon water attack”.
Material and structures, 30, 8, 480-485 (1997).
6. R. Wenda, H.J. Kuzel, “B3+ in calcium aluminate hydrates”, Proc. of 8th International Congress on the
Chemistry of Cement, Rio de Janeiro, 3, 37–38 (1983).
7. R. Atabek, P. Bouniol, P. Vitorge, P. Le Bescop and J.M. Hoorelbeke, “Cement use for radioactive waste embedding and disposal purposes”, Cement and
Concrete Research, 22, 419-429 (1992).
8. J.B. Champenois, “Etude de l’hydratation de ciments
sulfoalumineux par des solutions de borate de sodium. De la spéciation du bore au retard à l’hydratation”,
Thèse de Doctorat. Université Montpellier II, France (2012). (In French)
9. J.B. Champenois, A. Mesbah, C. Cau Dit Coumes, G. Renaudin, F. Leroux, C. Mercier, B. Revel, D. Damidot, “Crystal structures of Boro-AFm and
sBoro-AFt phases”, Cement and Concrete Research, 42, 10, 1362-1370 (2012).
10. G.E. Archie, “The Electrical Resistivity Log as an aid in determining some reservoir characteristics”,
Transactions of the American Institute of Mining Engineers, 146, 54-61 (1942).
11. Ph. Blanc, A. Lassin, P. Piantone, M. Azaroual, N. Jacquemet, A. Fabbri, E.C. Gaucher, “Thermoddem : A geochemical database focused on low temperature water/rock interactions and waste materials”, Applied
Geochemistry, 27, 10, 2107-2116 (2012).
12. Ph. Blanc, X. Bourbon, A. Lassin, E.C. Gaucher, “Chemical model for cement-based materials: Temperature dependence of thermodynamic functions for nanocrystalline and crystalline C–S–H phases”,
Cement and Concrete Research, 40, 6, 851-856
(2010).
13. Ph. Blanc, X. Bourbon, A. Lassin, E.C. Gaucher, “Chemical model for cement-based materials: Thermodynamic data assessment for phases other than C–S–H”, Cement and Concrete Research, 40, 9, 1360-1374 (2010).
14. A. Apelblat, E. Manzurola, “Solubilities and vapour pressures of saturated aqueous solutions of sodium tetraborate, sodium carbonate, and magnesium sulfate ans freezing-temperature lowerings of sodium tetraborate and sodium carbonate solutions”, J. of
Chem Therm, 35, 2, 221-238 (2003).
15. J.M. Casabonne Masonnave, “Immobilization of borates and phosphates anions with saturated lime solutions”, Solid State Ionic, 59, 1-2, 133-139 (1992). 16. J.V. Bothe and P.W. Brown, “Phase equilibria in the
system CaO-Al2O3-B2O3-H2O at 23 ± 1°C”, Advances
in Cement Research, 10, 3, 121-127 (1998).
17. L.J. Csetenyi. and F.P Glasser, “Borate retardation of cement set and phase relations in the system Na2 O-CaO-B2O3-H2O”, Advances in Cement Research, 7, 25, 13-17 (1995).
18. A. Dauzeres, “ Etude expérimentale et modélisation
des mécanismes physico-chimiques des interactions béton-argile dans le contexte du stockage géologique des déchets radioactifs”, Thèse de Doctorat,
Université de Poitiers, France (2011). (In French) 19. D. Bartier, I. Techer, A. Dauzeres, P. Boulvais, M.M.
Blanc-Valleron, J. Cabrera, “In situ investigations and reactive transport modelling of cement paste/argilite interactions in a saturated context and outside an excavated disturbed zone”, Applied Geochemistry, 31, 94-106 (2013).
![Fig. 2. Cumulative amount of leached calcium and added nitric acid reported to the surface of concrete sample (B-DL) exposed to the degradation solution [mmol.dm -2 ] over square root of degradation duration [days 1/2 ]](https://thumb-eu.123doks.com/thumbv2/123doknet/12909262.372255/4.892.60.443.505.644/cumulative-leached-reported-concrete-degradation-solution-degradation-duration.webp)