HAL Id: inserm-03223337
https://www.hal.inserm.fr/inserm-03223337v2
Submitted on 14 May 2021HAL is a multi-disciplinary open access archive for the deposit and dissemination of sci-entific research documents, whether they are pub-lished or not. The documents may come from teaching and research institutions in France or abroad, or from public or private research centers.
L’archive ouverte pluridisciplinaire HAL, est destinée au dépôt et à la diffusion de documents scientifiques de niveau recherche, publiés ou non, émanant des établissements d’enseignement et de recherche français ou étrangers, des laboratoires publics ou privés.
Impact of the EMG normalization method on muscle
activation and the antagonist-agonist co-contraction
index during active elbow extension: Practical
implications for post-stroke subjects
Alexandre Chalard, Marie Belle, Emmeline Montané, Philippe Marque, David
Amarantini, D. Gasq
To cite this version:
Alexandre Chalard, Marie Belle, Emmeline Montané, Philippe Marque, David Amarantini, et al.. Im-pact of the EMG normalization method on muscle activation and the antagonist-agonist co-contraction index during active elbow extension: Practical implications for post-stroke subjects. Journal of Electromyography and Kinesiology, Elsevier, 2020, 51, pp.102403. �10.1016/j.jelekin.2020.102403�. �inserm-03223337v2�
Original Article
1 2
Impact of the EMG normalization method on muscle activation and the
antagonist-3
agonist co-contraction index during active elbow extension: practical implications for
4
post-stroke subjects.
5 6
Alexandre Chalard a,b, Marie Belle c, Emmeline Montané c, Philippe Marque a,c, David
7
Amarantini a,‡, David Gasq a,d,‡,*
8 9
a ToNIC, Toulouse NeuroImaging Center, Université de Toulouse, Inserm, UPS, France
10
b Ipsen Innovation, Les Ulis, France
11
c Department of Neurological Rehabilitation, University Hospital of Toulouse, Hôpital de
12
Rangueil, Toulouse, France 13
d Department of Functional Physiological Explorations, University Hospital of Toulouse,
14
Hôpital de Rangueil, Toulouse, France 15
16
‡ co-last authors (both authors contributed equally to this work). 17
18
Correspondence to David Gasq, MD, PhD 19
Toulouse NeuroImaging Center, CHU Purpan, Pavillon Baudot, place du Dr Baylac 31024 20 Toulouse, France 21 Tél. +33 5 62 74 61 64 22 Fax. +33 5 62 74 61 63 23 Email: [email protected] 24
Word count: 2978 words from Introduction to Conclusion. 25
Abstract (200 words)
26
Electromyographic (EMG) raw signals are sensitive to intrinsic and extrinsic factors. 27
Consequently, EMG normalization is required to draw proper interpretations of standardized 28
data. Specific recommendations are needed regarding a relevant EMG normalization method 29
for participants who show atypical EMG patterns, such as post-stroke subjects. This study 30
compared three EMG normalization methods (“isometric MVC”, “isokinetic MVC”, 31
“isokinetic MVC kinematic-related”) on muscle activations and the antagonist-agonist co-32
contraction index. Fifteen post-stroke subjects and fifteen healthy controls performed active 33
elbow extensions, followed by isometric and isokinetic maximum voluntary contractions 34
(MVC). Muscle activations were obtained by normalizing EMG envelopes during active 35
movement using a reference value determined for each EMG normalization method. The results 36
showed no significant difference between the three EMG normalization methods in post-stroke 37
subjects on muscle activation and the antagonist-agonist co-contraction index. We highlighted 38
that the antagonist-agonist co-contraction index could underestimate the antagonist co-39
contraction in the presence of atypical EMG patterns. Based on its practicality and feasibility,
40
we recommend the use of isometric MVC as a relevant procedure for EMG normalization in 41
post-stroke subjects. We suggest combined analysis of the antagonist-agonist co-contraction 42
index and agonist and antagonist activations to properly investigate antagonist co-contraction 43
in the presence of atypical EMG patterns during movement. 44
45
Keywords: upper extremity, hemiplegia; brain injury; antagonist co-contraction; muscle 46 hypertonia 47 48 49 50
Introduction
51 52
Raw electromyographic (EMG) signals are sensitive to both intrinsic (such as anatomical and 53
physiological characteristics) and extrinsic (such as electrode configuration or placement, skin 54
preparation) factors (Burden, 2010). EMG normalization, which refers to the conversion of the 55
EMG signal to a relative scale by a reference value, is thus a key step in enabling i) proper 56
interpretation of standardized data, and ii) comparison between muscles or individuals (Halaki 57
& Ginn, 2012). The method used for EMG normalization influences the shape of EMG patterns, 58
which makes its choice critical to accurately present the muscle activation for a given muscle 59
and to permit correct interpretation of the amplitude and temporal variations of EMG signal 60
intensity. 61
62
The most common method is to normalize the EMG envelope during a task under investigation 63
to the maximum peak value obtained during isometric maximum voluntary contraction (MVC) 64
(Yang & Winter, 1984). Depending on the task of interest, it has been reported that EMG signals 65
normalized using such “isometric MVC normalization” may reach values above 100% (Jobe, 66
Moynes, Tibone, & Perry, 1984). This suggests this method may be not accurate enough to 67
reveal the maximum activity level, and may be inappropriate for dynamic movement (Mirka, 68
1991). To address this issue, the maximum EMG value obtained during isokinetic MVC can be 69
used as the reference EMG value in order to normalize the EMG envelope under dynamic 70
conditions (Fernández-Peña, Lucertini, & Ditroilo, 2009). Using such “isokinetic MVC 71
normalization”, the reference EMG value is calculated for a comparable joint range-of-motion 72
at a similar velocity to the task under investigation. It is, however, not always possible to realize 73
an isokinetic protocol due to experimental limitations (El Mhandi & Bethoux, 2013). An 74
alternative method for EMG normalization is to use the maximum EMG value reached during 75
the task under investigation as the reference value (Yang & Winter, 1984). However, this 76
method tends to reduce the variability between individuals since it makes the reference value 77
relative to the task and not to the maximum capacity of the muscle (Halaki & Ginn, 2012). 78
Although this method may be suitable for comparing EMG patterns over time, it cannot enable 79
consistent and reliable comparison of activity between muscles, tasks and individuals. 80
81
In healthy participants, recent literature reviews have highlighted that “isometric MVC 82
normalization” produces similar results to “isokinetic MVC normalization” (Burden, 2010; 83
Halaki & Ginn, 2012). A recommendation has been made stating that “isometric MVC 84
normalization” is sufficient to provide normalized EMG values with enough confidence to 85
assess muscle activity during active movement for healthy subjects (Burden, 2010). 86
It is well established that clinical populations such as post-stroke subjects present 87
neuromuscular alterations during movement reflected by abnormal EMG muscle activation
88
patterns (Ma et al., 2017). Among them, the spastic co-contraction corresponds to an excessive 89
activity of antagonist muscles during the active movement (Banks, Huang, Little, & Patten, 90
2017; Gracies, 2005; Ma et al., 2017) which seem to be overstated with muscle lengthening 91
due to alteration of force-length and force-velocity relationships after brain injury (Gracies, 92
2005; Sarcher et al., 2017). The choice of a suitable method of EMG normalization appears 93
especially relevant for post-stroke subjects who present such atypical patterns of EMG activity. 94
It has been shown that “isometric MVC normalization” can yield unpredictable results in 95
subjects with altered neuromuscular control (Ettinger, Weiss, Shapiro, & Karduna, 2016). 96
While EMG analysis is increasingly used in both the upper limb assessment and rehabilitation 97
of post-stroke subjects during active movements (Klein, Li, Hu, & Li, 2018; Zarantonello, 98
Stefani, & Comel, 2017), there is still a substantial lack of data supporting any recommendation 99
for an EMG normalization method in participants who exhibit an atypical EMG pattern. Apart 100
from EMG-based assessment of muscle activation, the issue of EMG normalization is also of 101
major relevance in the clinical context to quantify an EMG-based antagonist-agonist co-102
contraction index, which is likely to reflect the level of spastic co-contraction. Previous work 103
highlighted a relationship between the level of spastic co-contraction and the range-of-motion 104
restriction (Chalard et al., 2019; Sarcher et al., 2015), highlighting the importance of 105
quantifying the antagonist-agonist co-contraction index in order to improve the motor function 106
of such patients. 107
To address the relevance given to different EMG normalization methods under dynamic 108
conditions in participants with atypical muscle activations patterns, the present study assessed 109
the impact of three methods for EMG normalization on muscle activation and antagonist-110
agonist co-contraction in post-stroke subjects during active elbow extension. In this study we 111
focused on three EMG normalization methods corresponding to “isometric EMG 112
normalization”, “isokinetic EMG normalization” and “isokinetic kinematic-related EMG 113
normalization”. We hypothesized that “isokinetic MVC normalization” and “isokinetic 114
kinematic-related EMG normalization” would provide more accurate EMG-normalized 115
measurements than “isometric MVC normalization” by considering muscle dynamics during 116
active elbow extension in post-stroke subjects. 117 118 Methods 119 120 Participants 121
Thirty adults (≥ 18 years) allocated into two groups participated in this study: the first group 122
comprised fifteen post-stroke participants (HEMI); the second comprised fifteen healthy 123
controls (CO). The participants demographics are presented in Table 1. For HEMI, spasticity
124
was assessed using Tardieu scale and motor impairment with the Fugl-Meyer Upper Extremity
Assessment. Post-stroke participants were included if they were ≥ 6 months since stroke onset 126
and were free of any anti-spastic treatment for ≥ 4 months. Potential participants with 127
comprehension disorders, neurodegenerative conditions, painful paretic upper limbs during 128
movement or an active elbow extension ability ≤ 20° were excluded. All participants gave 129
informed consent prior to participation. This study was approved by the local Research Ethics 130
Board (No ID-RCB: 2017-A01616-47). 131
132
Experimental design 133
The experimental protocol consisted of two consecutive steps. In the first step, three-134
dimensional kinematics and EMG data were simultaneously collected during repeated active 135
elbow extension movements at spontaneous speed. The second step was to perform isometric 136
and isokinetic maximum voluntary contractions (MVC) during which EMG measurements 137
were taken, together with joint angle, angular velocity, and torque provided by a calibrated 138 dynamometer. 139 140 Materials 141 Kinematics 142
The three-dimensional kinematics of upper limbs were collected at 125 Hz using eight 143
Optitrack infrared cameras (model S250e, software Motive:Tracker 1.8.0; NaturalPoint, 144
Corvallis, Oregon, USA). Twelve reflective markers were placed in the following positions: on 145
the spinous process of C7, on the sternal notch, on both sides of the acromion, on the lateral 146
epicondyle, on both the ulnar and radial styloid, on the head of the second metacarpus. 147
Electromyography
148
Surface EMG was acquired at 1 kHz with a MP150 system (Biopac Systems Inc., Goleta, CA, 149
USA) with the ground electrode placed on mastoid process. After suitable skin preparation, 150
rectangular self-adhesive bipolar pairs of disposable Ag/AgCl surface electrodes with a 10 mm 151
recording diameter were placed with a 10 mm inter-electrode distance (Afsharipour, Soedirdjo, 152
& Merletti, 2019). The long head of the triceps brachii (TB) was taken to represent the elbow 153
extensors; the biceps brachii (BB), the brachioradialis (BR) and the brachialis (BA) were taken 154
to represent the elbow flexors (Staudenmann & Taube, 2015). A verification procedure was 155
performed to limit crosstalk among biceps brachii, brachialis and triceps brachii. 156
As was done in Banks et al. (2017) during gait experiments, the agonist or antagonist role 157
assigned to these muscles was fixed to their biomechanical function during elbow extension. 158
Dynamometry
159
Elbow joint angle, angular velocity, and net torque were recorded at 1 kHz using an isokinetic 160
dynamometer (Con-Trex MJ; CMV AG, Dubendorf, Switzerland). 161
For each experimental step, data synchronization was achieved using a common timing signal 162
controlled by the Biopac system. 163
164
Procedure 165
Active elbow extension movements
166
Participants were seated on an upright chair with shoulders fixed to the chair back by clavicular 167
rings. The height of the table was adjusted to obtain an initial resting position corresponding to 168
shoulder flexion of 80° with internal rotation of 90°, the elbow flexed at 90° and the forearm in 169
a neutral position. Participants were asked to perform two sets of ten active elbow extension 170
movements at spontaneous speed. For each movement, an auditory signal requested the 171
participants to perform a full active elbow extension with the elbow off the table. At the end of 172
elbow extension, participants had a 10-second rest with their forearm on the table. To avoid 173
fatigue, participants were allowed to rest for as long as needed between the two sets. 174
Isometric and isokinetic MVC
176
Participants were seated on the dynamometer chair with their upper body strapped, the 177
glenohumeral joint positioned at 90° flexed and internally rotated, and the forearm positioned 178
in a neutral position. During isometric MVC, participants performed three 5-second maximum 179
contractions in both flexion and extension directions with the elbow flexed at the middle of the 180
angular extension movement range recorded during elbow extension-flexion movements. 181
During isokinetic MVC, participants performed three maximum contractions in both concentric 182
and eccentric modes. During each isokinetic contraction, the elbow angular range-of-motion 183
and velocity matched the average corresponding values observed in each mode during elbow 184
extension movements (see Table 1). Participants had a 1-minute rest between contractions and 185
a 3-minute rest between directions or modes. No participant reported any pain or discomfort 186
that would interfere with the production of force during MVC. 187 188 Data processing 189 Preprocessing 190
Kinematic data were low-pass filtered at 6 Hz (Cahouët, Martin, & Amarantini, 2002). Raw 191
EMG signals were 10-400 Hz band-pass filtered, full wave rectified, and smoothed at 9 Hz to 192
obtain the linear envelopes (Amarantini, & Bru, 2015). Net torque was low-pass filtered at 193
15 Hz (Bassan et al., 2015). All filters were fourth-order, zero-lag Butterworth type. 194
Active elbow extension
195
Kinematic data were obtained from the filtered Cartesian coordinates of the anatomical 196
markers. The onset and offset of each active elbow extension were detected with a threshold of 197
0.01 °/S applied on the elbow angular velocity. 198
Muscle activations
At each time point of active elbow extension, muscle activation was computed by normalizing 200
the EMG signal of each muscle to its EMG reference using the following three normalization 201
methods: 202
isometric MVC [MIsom] EMG normalization: The preprocessed EMG signal was normalized
203
to its EMG reference value obtained during isometric MVC. The MIsom EMG reference value
204
was calculated as the root mean square (RMS) value of the EMG linear envelope on the 2-205
second window where the elbow net torque was highest. 206
isokinetic normalization [MIsok] EMG normalization: The preprocessed EMG signal was
207
normalized to its EMG reference value obtained during isokinetic MVC. The MIsok EMG
208
reference value was calculated as the RMS value of the EMG linear envelope on a centered 209
100 ms window when the participant reached the middle of the active elbow extension range 210
of motion. The MIsok EMG reference value was computed using data collected in concentric
211
mode for elbow extensors (TB) and in eccentric mode for elbow flexors (BB, BR, BA). 212
isokinetic kinematic-related [MIsok-KinRel] EMG normalization: At each percent value of the
213
active elbow range of motion during each extension movement, the preprocessed EMG 214
signal was normalized to its EMG reference value obtained, defined as the RMS value of the 215
EMG linear envelope at a sliding window centered on the same percent value of the active 216
elbow extension range of motion during isokinetic MVC. The MIsok-KinRel EMG reference
217
values were computed using data collected in concentric mode for elbow extensors and in 218
eccentric mode for elbow flexors. 219
220
Antagonist-agonist co-contraction index
221
For each EMG normalization method, the antagonist-agonist co-contraction index (CCI) was 222
computed from muscle activation (i.e., normalized EMG signals) during each of the active 223
elbow extensions (Falconer & Winter, 1985) : 224
CCI = 2 (EMGFlexors / (EMGExtensors + EMGFlexors )) 100 (1)
225
where EMGFlexors is the mean of the three elbow flexor (i.e., BB, BR and BA) activations
226
recorded, and EMGExtensors is the activation of TB.
227 228
Statistical analysis 229
The statistical analysis consisted of two steps: i) the first being a preliminary analysis to 230
investigate the presence of atypical EMG patterns in post-stroke subjects compared to healthy 231
subjects, and ii) the second investigating the effect of the normalization method on muscle 232
activations and the antagonist-agonist co-contraction index in the presence of atypical EMG 233
patterns. For each analysis we used Statistical Parametric Mapping (SPM) which provides a 234
framework to enable statistical comparisons between entire time series data rather than data 235
reduction or selected features (Friston, 2007). In brief, SPM computes a statistic test at each 236
point in the time series, thereby forming a test statistic continuum. To control for multiple 237
comparisons, a critical threshold was computed using random field theory which describes 238
probabilistic behavior of random curves and accounts for the smoothness and temporal 239
increment of the data (Pataky, Robinson, & Vanrenterghem, 2013; Pataky, Vanrenterghem, & 240
Robinson, 2015). In order to control a Type I error rate, a critical threshold α = 0.05 was set 241
(above which only 5% of random curves of the same smoothness would exceed). If the test 242
statistic continuum exceeded the critical threshold, a significant difference is deemed to exist. 243
In order to test the differences in EMG patterns between groups, SPM independent t-tests were 244
performed between HEMI and CO on muscle activations and the antagonist-agonist co-245
contraction index normalized by MIsom. In order to test the effect of the normalization method
246
(i.e., MIsom vs. MIsok vs. MIsok-KinRel) in HEMI, SPM one-way repeated-measures ANOVA were
247
performed on muscle activations and the antagonist-agonist co-contraction index. All the 248
analyses were conducted using the open-source package “SPM1D” written in Python (Pataky, 249
2012); in the present study the significance threshold was set at p < 0.05. All variables showed 250
normal distribution (Shapiro-Wilk test; P > 0.05) and homogeneity of variance (Levene’s test; 251 P > 0.05). 252 253 254 Results 255 256
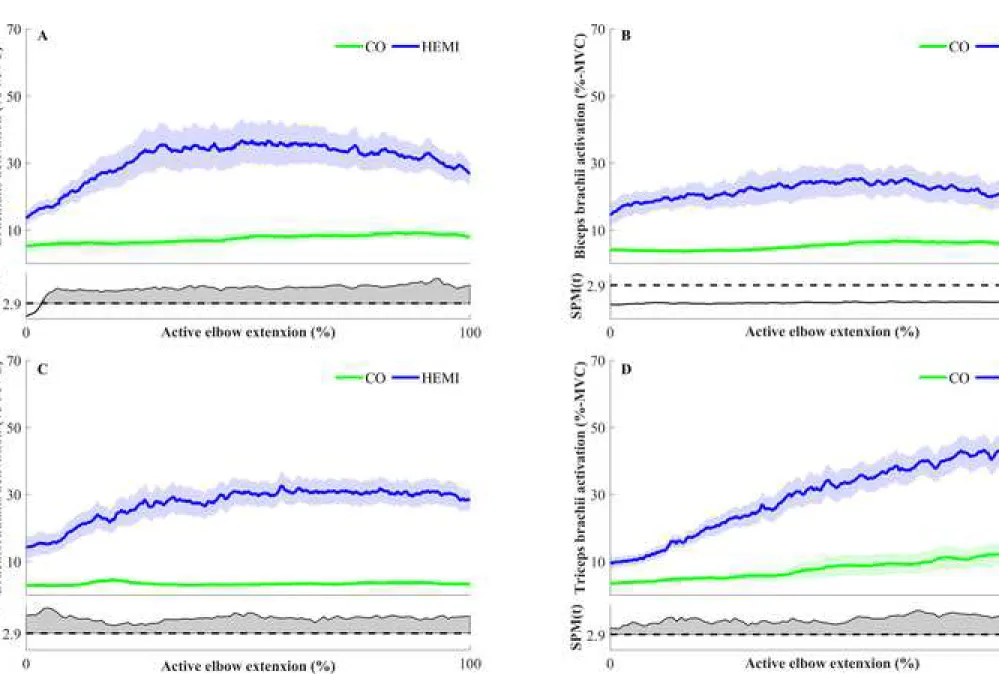
Inter-group comparisons for muscle activations and the antagonist-agonist co-contraction 257
index 258
The analysis revealed significant differences during the whole movement for BA, BR and TB 259
(Fig. 1.A, 1.C and 1.D), with a significant cluster exceeding the critical threshold (SPMt > 2.98;
260
p < 0.05). No significant inter-group difference was found either for BB activation (Fig. 1.B) 261
or for the antagonist-agonist co-contraction index during the active elbow extension (Fig. 3.A). 262
263
Inter-group normalization method comparison for muscle activation and the antagonist-264
agonist co-contraction index 265
The intra-group comparisons revealed no difference between the three methods of 266
normalization either for muscle activations, or for the antagonist-agonist co-contraction index 267
(all, SPMF < 6.98; p > 0.05) (Figs. 2 and 3.B).
268 269 270
Discussion
271
The aim of this study was to investigate the impact of three EMG normalization methods on 272
muscle activation and on the antagonist-agonist co-contraction index (CCI) – i.e., an EMG-273
normalized derived variable used to estimate the antagonist co-contraction level – during active 274
elbow extension in post-stroke subjects. As previously shown (Chalard et al., 2019), our results 275
revealed atypical EMG patterns characterized by increased activity of the elbow flexors and 276
extensors during the active elbow extension in such subjects. 277
278
Isometric MVC normalization is relevant for EMG normalization in post-stroke subjects
279
In order to consider atypical EMG activity patterns in the stretch position occurring in post-280
stroke subjects, we made the initial hypothesis that “isokinetic MVC normalization” may be 281
different than “isometric MVC normalization” due to the consideration of force-length and 282
force-velocity relationships. However, and contrary to our initial hypothesis, our results failed 283
to show any significant difference between the three methods of normalization (MIsom, MIsok
284
and MIsok-KinRel) investigated among post-stroke subjects. The similarity of the results obtained
285
using either “isometric MVC normalization” or “isokinetic MVC normalization” may 286
admittedly be explained by a uniform relationship between EMG muscle activation on the one 287
hand, and by muscle-length and elongation velocity on the other hand. This uniform 288
relationship is likely to reflect the absence of the influence of elbow position or angular velocity 289
on EMG amplitude during maximum voluntary contraction (Burden, Trew, & Baltzopoulos, 290
2003; Burden & Bartlett, 1999). Nevertheless, the absence of any difference between the three 291
methods of EMG normalization provides new practical insights regarding the EMG 292
methodology to be used in post-stroke subjects. Our findings support the evidence that 293
“isometric MVC normalization” is sufficient for accurately assessing muscle activation and the 294
antagonist-agonist co-contraction index during an active movement in post-stroke subjects. The 295
novel practical implications arising from these results are the use and the relevance of the 296
“isometric MVC normalization” method to normalize EMG in a post-stroke population. 297
298
Assessment of antagonist-agonist co-contraction in the presence of atypical EMG patterns
In addition to the aim of this study, our results challenge the relevance of an antagonist-agonist 300
co-contraction index to properly characterize the antagonist co-contraction in the presence of 301
atypical EMG patterns. Based on the sole interpretation of the antagonist-agonist co-contraction 302
index, it is not possible to conclude that post-stroke subjects exhibit significant excessive 303
antagonist co-contractions (Banks et al., 2017). Indeed, our analysis revealed a concomitant 304
increase in both agonist and antagonist muscle activation in post-stroke subjects compared to 305
healthy controls. This general increase in muscle activation reflects pathological EMG patterns 306
related to the loss of motor selectivity between agonist and antagonist muscles during active 307
elbow extension (Schieber, Lang, Reilly, McNulty, & Sirigu, 2009). Such atypical agonist 308
activation patterns can lead to the underestimation of the antagonist-agonist co-contraction 309
index, highlighting the inadequacy of using only a ratio between agonist and antagonist muscles 310
to assess antagonist co-contraction in post-stroke subjects. We thus underline the importance 311
of taking a critical look at the quantification of the antagonist co-contraction using the 312
antagonist-agonist co-contraction index in the presence of atypical EMG patterns. To avoid 313
misleading conclusions on antagonist co-contraction, and to properly detect atypical EMG 314
patterns in post-stroke subjects, we recommend concurrent investigation of individual muscle 315
activation of both agonist and antagonist muscles. 316
317
Limitations 318
Any generalization of these results should be viewed with caution since we only investigated
319
the impact of three EMG normalization procedures during an active elbow extension in
post-320
stroke subjects. Future studies should investigate the reproducibility of the observed differences
321
in order to improve the applicability of the results.
322 323
Conclusion 324
Our findings extend existing advice on EMG normalization in post-stroke subjects exhibiting 325
atypical EMG patterns during voluntary contractions. Based on its practicality and feasibility,
326
we recommend the use of EMG reference values determined during isometric MVC to 327
normalize EMG in post-stroke subjects in a relevant way, either during upper limb isometric 328
contractions or active movements. In addition, our results underline that the assessment of an 329
antagonist-agonist co-contraction index should be systematically combined with the analysis 330
of agonist and antagonist muscle activation to properly highlight the atypical EMG patterns 331
during movement in post-stroke situations. 332
333
Conflict of Interest Statement
334
Alexandre Chalard is an employee of Ipsen Innovation within the framework of a CIFRE PhD 335
fellowship. All other authors in this study declare that there is no conflict of interest. 336
337
Acknowledgement
338
We thank Camille Charissou, Lisa Corbière, Célia Pinto, Jessica Tallet and Joseph Tisseyre for 339
their help during the experimental protocol. 340
341
Funding
342
This research did not receive any specific grant from funding agencies in the public, 343
commercial, or not-for-profit sectors. 344 345 346 347 References 348
Afsharipour, B., Soedirdjo, S., & Merletti, R. (2019). Two-dimensional surface EMG: The 349
effects of electrode size, interelectrode distance and image truncation. Biomedical Signal 350
Processing and Control, 49, 298‑ 307.
351
Banks, C. L., Huang, H. J., Little, V. L., & Patten, C. (2017). Electromyography Exposes 352
Heterogeneity in Muscle Co-Contraction following Stroke. Frontiers in Neurology, 8:699. 353
Bassan, N., et al. (2015). Reliability of isometric and isokinetic peak torque of elbow flexors 354
and elbow extensors muscles in trained swimmers. Revista Brasileira de Cineantropometria & 355
Desempenho Humano, 17(5), 507‑ 516.
356
Burden. (2010). How should we normalize electromyograms obtained from healthy 357
participants? What we have learned from over 25years of research. Journal of 358
Electromyography and Kinesiology, 20(6), 1023‑ 1035.
359
Burden, A., Trew, M., & Baltzopoulos, V. (2003). Normalisation of gait EMGs: a re-360
examination. Journal of Electromyography and Kinesiology, 13(6), 519‑ 532. 361
Burden, & Bartlett. (1999). Normalisation of EMG amplitude: an evaluation and comparison 362
of old and new methods. Medical Engineering & Physics, 21(4), 247‑ 257. 363
Cahouët, V., Martin, L., & Amarantini, D. (2002). Static optimal estimation of joint 364
accelerations for inverse dynamics problem solution. Journal of Biomechanics, 35(11), 365
1507‑ 1513. 366
Chalard, A., Amarantini, D., Tisseyre, J., Marque, P., Tallet, J., & Gasq, D. (2019). Spastic co-367
contraction, rather that spasticity, is associated with impaired active function in adults with 368
acquired brain injury: A pilot study. Journal of Rehabilitation Medicine, 51(4), 307‑ 311. 369
Cram, J., & Rommen, D. (1989). Effects of skin preparation on data collected using an EMG 370
muscle-scanning procedure. Biofeedback and Self-Regulation, 14(1), 75‑ 82. 371
El Mhandi, L., & Bethoux, F. (2013). Isokinetic testing in patients with neuromuscular diseases: 372
a focused review. American Journal of Physical Medicine & Rehabilitation, 92(2), 163‑ 178. 373
Ettinger, L., Weiss, J., Shapiro, M., & Karduna, A. (2016). Normalization to Maximal 374
Voluntary Contraction is Influenced by Subacromial Pain. Journal of Applied Biomechanics, 375
32(5), 433‑ 440.
376
Falconer, K., & Winter, D. A. (1985). Quantitative assessment of co-contraction at the ankle 377
joint in walking. Electromyography and Clinical Neurophysiology, 25(2‑ 3), 135‑ 149. 378
Fernández-Peña, E., Lucertini, F., & Ditroilo, M. (2009). A maximal isokinetic pedalling 379
exercise for EMG normalization in cycling. Journal of Electromyography and Kinesiology, 380
19(3), e162-170.
Friston, K. (2007). Statistical Parametric Mapping. In Statistical Parametric Mapping (Vol. 3, 382
p. 10‑ 31). 383
Gracies, J.-M. (2005). Pathophysiology of spastic paresis. II: Emergence of muscle 384
overactivity. Muscle & Nerve, 31(5), 552‑ 571. 385
Halaki Mark, & Ginn Karen. (2012). Normalization of EMG Signals: To Normalize or Not to 386
Normalize and What to Normalize to? In Computational Intelligence in Electromyography
387
Analysis (p. Ch. 7).
388
Jobe, F., Moynes, D., Tibone, J., & Perry, J. (1984). An EMG analysis of the shoulder in 389
pitching. A second report. The American Journal of Sports Medicine, 12(3), 218‑ 220. 390
Klein, C. S., Li, S., Hu, X., & Li, X. (2018). Editorial: Electromyography (EMG) Techniques 391
for the Assessment and Rehabilitation of Motor Impairment Following Stroke. Frontiers in 392
Neurology, 9,
393
Ma, C., Chen, N., Mao, Y., Huang, D., Song, R., & Li, L. (2017). Alterations of Muscle 394
Activation Pattern in Stroke Survivors during Obstacle Crossing. Frontiers in Neurology, 8, 70. 395
Mirka, G. A. (1991). The quantification of EMG normalization error. Ergonomics, 34(3), 396
343‑ 352. 397
Pataky, T. C. (2012). One-dimensional statistical parametric mapping in Python. Computer 398
Methods in Biomechanics and Biomedical Engineering, 15(3), 295‑ 301.
399
Pataky, T. C., Robinson, M. A., & Vanrenterghem, J. (2013). Vector field statistical analysis of 400
kinematic and force trajectories. Journal of Biomechanics, 46(14), 2394‑ 2401. 401
Pataky, T. C., Vanrenterghem, J., & Robinson, M. A. (2015). Zero- vs. one-dimensional, 402
parametric vs. non-parametric, and confidence interval vs. hypothesis testing procedures in one-403
dimensional biomechanical trajectory analysis. Journal of Biomechanics, 48(7), 1277‑ 1285. 404
Sarcher, A., Raison, M., Ballaz, L., Lemay, M., Leboeuf, F., Trudel, K., & Mathieu, P. A. 405
(2015). Impact of muscle activation on ranges of motion during active elbow movement in 406
children with spastic hemiplegic cerebral palsy. Clinical Biomechanics, 30(1), 86‑ 94. 407
Sarcher, A., Raison, M., Leboeuf, F., Perrouin-Verbe, B., Brochard, S., & Gross, R. (2017). 408
Pathological and physiological muscle co-activation during active elbow extension in children 409
with unilateral cerebral palsy. Clinical Neurophysiology, 128(1), 4‑ 13. 410
Schieber, M. H., Lang, C. E., Reilly, K. T., McNulty, P., & Sirigu, A. (2009). Selective 411
activation of human finger muscles after stroke or amputation. Advances in Experimental 412
Medicine and Biology, 629, 559‑ 575.
413
Staudenmann, D., & Taube, W. (2015). Brachialis muscle activity can be assessed with surface 414
Vinti, M., Bayle, N., Hutin, E., Burke, D., & Gracies, J.-M. (2015). Stretch-sensitive paresis 416
and effort perception in hemiparesis. Journal of Neural Transmission , 122(8), 1089‑ 1097. 417
Yang, J. F., & Winter, D. A. (1984). Electromyographic amplitude normalization methods: 418
improving their sensitivity as diagnostic tools in gait analysis. Archives of Physical Medicine 419
and Rehabilitation, 65(9), 517‑ 521.
420
Zarantonello, M. M., Stefani, M. A., & Comel, J. C. (2017). Electromyographic analysis of 421
constraint-induced movement therapy effects in patients after stroke in chronic course. Journal 422
of Physical Therapy Science, 29(11), 1883‑ 1888.
423 424
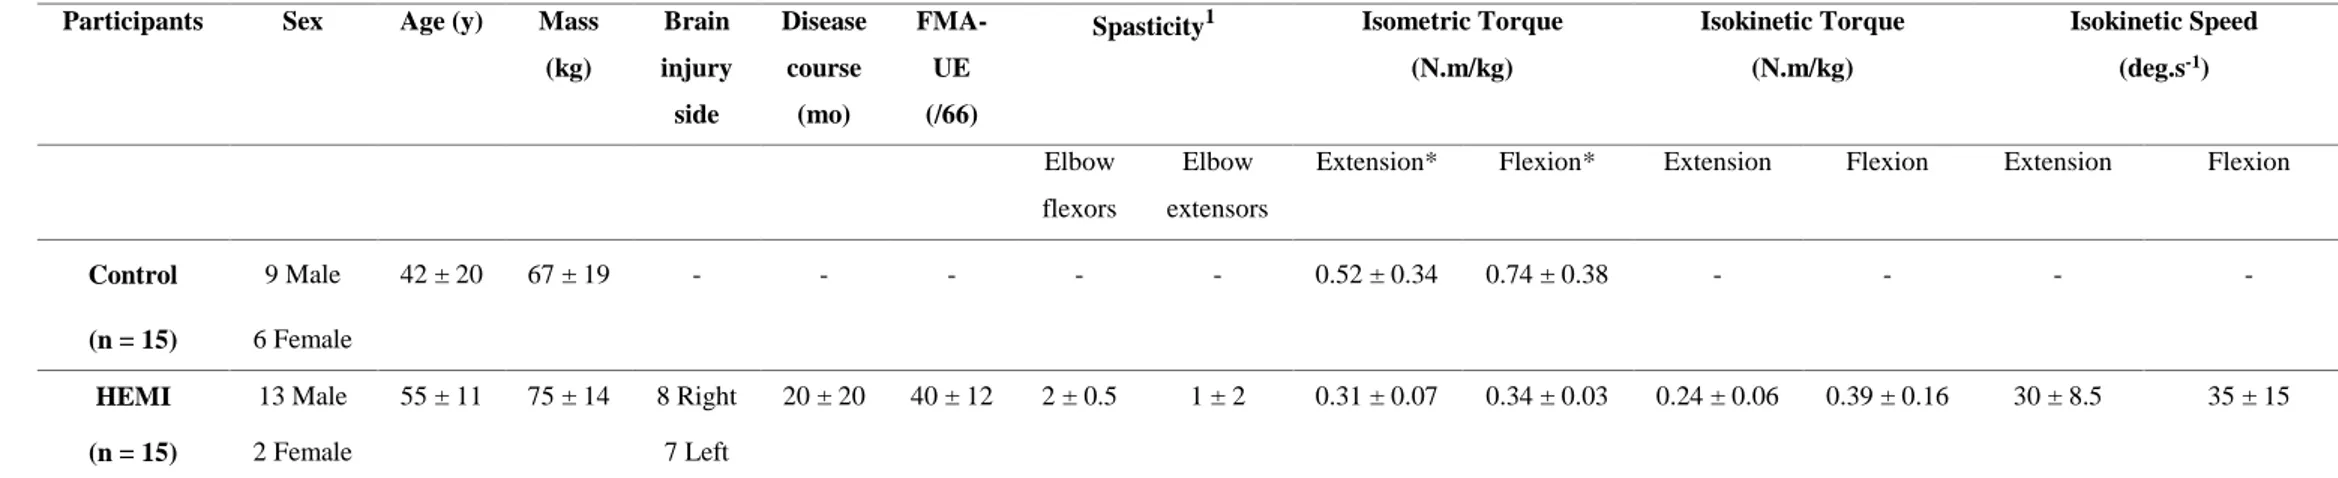
Table 1. Participant demographics (median ± interquartile range).
Participants Sex Age (y) Mass
(kg) Brain injury side Disease course (mo) FMA-UE (/66)
Spasticity1 Isometric Torque
(N.m/kg) Isokinetic Torque (N.m/kg) Isokinetic Speed (deg.s-1) Elbow flexors Elbow extensors
Extension* Flexion* Extension Flexion Extension Flexion
Control (n = 15) 9 Male 6 Female 42 ± 20 67 ± 19 - - - 0.52 ± 0.34 0.74 ± 0.38 - - - - HEMI (n = 15) 13 Male 2 Female 55 ± 11 75 ± 14 8 Right 7 Left 20 ± 20 40 ± 12 2 ± 0.5 1 ± 2 0.31 ± 0.07 0.34 ± 0.03 0.24 ± 0.06 0.39 ± 0.16 30 ± 8.5 35 ± 15
* Indicates a significant difference between HEMI and CO (p < 0.05). 1Spasticity of elbow flexors and extensors was assessed using the Tardieu scale.
Figure captions
Figure 1. Muscle activations normalized by MIsom during active elbow extension for: A.
brachialis (BA), B. biceps brachii (BB), C. brachioradialis (BR), and D. triceps brachii (TB). The upper panel represents the muscle activation and standard error for CO (green) and HEMI (blue). The lower panel represents the SPM(t) test statistic continuum, the dashed line corresponding to the significance level threshold. Whenever the test statistic continuum SPM(t) exceeds the threshold (p < 0.05), significance is reached and the p-values are reported by shaded gray areas.
Figure 2. Muscle activations during active elbow extension for HEMI for: A. brachialis (BA),
B. biceps brachii (BB), C. brachioradialis (BR), and D. triceps brachii (TB). The upper panel represents the muscle activation and standard error normalized by MIsom (green), MIsok (red) and
MIsok-KinRel (blue). The lower panel represents the SPM(F) test statistic continuum, the dashed
line corresponding to the significance level threshold. Whenever the test statistic continuum SPM(F) exceeds the threshold (p < 0.05), significance is reached and the p-values are reported by shaded gray areas.
Figure 3. A. Antagonist-agonist co-contraction index during active elbow extension. The upper
panel represents the antagonist-agonist co-contraction index and standard error normalized by MIsom for CO (green) and HEMI (blue). B. Antagonist-agonist co-contraction index during
active elbow extension for HEMI. The upper panel represents the antagonist-agonist co-contraction index and standard error normalized by MIsom (green), MIsok (red) and MIsok-KinRel
The lower panel represents the SPM test statistic continuum, the dashed line corresponding to the significance level threshold (p < 0.05). Whenever the test statistic continuum SPM exceeds the threshold, significance is reached and the p-values are reported by shaded gray areas.
Alexandre Chalard is a Physiotherapist and obtained his Master’s degree in Movement
Science from the University of Toulouse (Toulouse, France) in 2016. He is currently a Ph.D student in the Toulouse Neuroimaging Center (ToNIC, UMR 1214 Inserm/UPS) at Paul Sabatier University (Toulouse, France). His research work focuses on the mechanisms underlying the neuromuscular plasticity in post-stroke subjetcs.
David Amarantini obtained his PhD in biomechanics in 2003 at Joseph Fourier University
(Grenoble, France) and his HDR in biomechanics and neuroscience in 2019 at Toulouse University. He is currently employed as an Assistant Professor in neuro-biomechanics at Paul Sabatier University (Toulouse, France). He is member of the Faculty of Sport and Movement Sciences and makes his research at the Toulouse Neuroimaging Center (ToNIC, UMR 1214 Inserm/UPS). His main research interests include musculoskeletal modeling, neural mechanisms of human motor control and electrophysiological signals processing.
David Gasq is a Medical Doctor, specialist in Physical Medicine and Rehabilitation since 2009
in the field of motor disability. He heads a hospital department dedicated to assessment of Author Biography
Conflict of Interest Statement
Alexandre Chalard is employee of Ipsen Innovation within the framework of a CIFRE PhD fellowship. Others authors in this study declare that there is no conflict of interest.
All authors have made substantial work according the ICJME guidelines and have read and approved the submitted manuscript. The manuscript has not been submitted elsewhere nor published elsewhere.