HAL Id: tel-01939305
https://tel.archives-ouvertes.fr/tel-01939305
Submitted on 29 Nov 2018
HAL is a multi-disciplinary open access archive for the deposit and dissemination of sci-entific research documents, whether they are pub-lished or not. The documents may come from teaching and research institutions in France or abroad, or from public or private research centers.
L’archive ouverte pluridisciplinaire HAL, est destinée au dépôt et à la diffusion de documents scientifiques de niveau recherche, publiés ou non, émanant des établissements d’enseignement et de recherche français ou étrangers, des laboratoires publics ou privés.
The evolution of economic and political institutions in
developing countries
Jessica Clement
To cite this version:
Jessica Clement. The evolution of economic and political institutions in developing countries. Eco-nomics and Finance. Université Panthéon-Sorbonne - Paris I, 2018. English. �NNT : 2018PA01E005�. �tel-01939305�
Universit´e de Paris 1 Panth´eon-Sorbonne
Laboratoire de rattachement : CES (Centre d’ ´Economie de la Sorbonne)
TH `ESE
Pour l’obtention du titre de Docteur en Sciences ´Economiques Pr´esent´ee et soutenue publiquement le
janvier, 2018 par
Jessica Clement
The Evolution of Economic and Political Institutions in Developing
Countries
Sous la direction de M. Bruno Amable Professeur
Membres du jury
Ivan Ledezma, Professeur, Universit´e de Bourgogne (rapporteur) Jonas Pontusson, Professeur, Universit´e de Gen`eve (rapporteur) R´emi Bazillier, Professeur, Universit´e de Paris 1 Panth´eon-Sorbonne
Karine Van der Straeten, Directrice de recherche CNRS, Toulouse School of Economics
Acknowledgements
I would like to first thank Professor Bruno Amable for being my PhD thesis supervisor. I appreciate greatly everything that you have helped me with during this time. It has truly been an honour to have you direct my PhD degree.
After, I would like to thank Elvire Guillaud. I am not sure I would have finished my PhD (at least sanely) without your guidance and support. You have been a constant source of encouragement. I am very grateful for everything that you have done - and continue to do - for me.
I would not have come to Paris without the PSME program, and I would not have stayed in Paris without the help of Professor Jean-Claude Berth´elemy and Morgan Hull-Brousmiche. I would like to thank both of you for your efforts in creating such a lovely environment with the PSME program. Your work has encouraged so many students to pursue academic careers. Your support was instrumental for my PhD, and I am very fortunate to have had the backing of the PSME program throughout all these years.
I also would like to thank Professor Marie-Anne Valfort for accepting to discuss my work for the 12/18 presentation. Your comments were extremely helpful for the advancement of my thesis. Thank you Professor David Hitchcock for your insights into LPA. Your advice solved so many problems for the fourth chapter of this thesis. Also, I would like to thank all of those who reviewed my work, both anonymously and knowingly.
To Professor Jonas Pontusson and Professor Juan Flores, thank you for your help during my stay at the University of Geneva. I am very grateful for all the letters you wrote for me, and all the guidance that you provided me during this time. I had only a brief stay with UNIGE, but I always felt very welcomed. Professor Pontusson, as well as Professors Bazillier, Ledezma, and Van der Straeten, thank you for agreeing to partake as members in my jury for my thesis defence. I appreciate the time and effort that you took for this task.
To Maria Chiara, to think we started it all together ! I am very glad that we ended up in the same place at the same time. You have made life at MSE and the PhD much more fun. It has been so nice having someone next to me going through the same things, and understanding exactly how I’m feeling. Thank you so much. To Thibault, a grand merci for all of your help. You have always been the knowledgeable elder of the office. I have greatly appreciated your advice and suggestions. To Alexia, Baptiste, Marco, and Michael : you guys have been excellent office mates. Each day at MSE was made a bit brighter by your presence. I would also like to thank all of the staff at the MSE for the work you do and for all the help you provided me and the other students with. Finally, I would like to thank my family and friends for putting up with me during these past four years. Your support has made all the difference. I would especially like to thank my parents who have ensured that I never starved, Laura, who had to live with me during for the majority of this time, and Adrijana, Alexandra, and Floriana who had to listen to all of my ranting. Thank you Thibault (ahem, Dr. Sohier). You are truly the most patient person I have ever met. Your never-ending support and rationalizations of my crazy ideas have calmed me down countless times. It also helps that you are a French/LaTeX/Python genius and drive to all of the wine trips (sant´e !). All of you are great, thank you.
List of Abbreviations
CC . . . .Comparative Capitalism CCSI . . . .Core Civil Society Index CME . . . .Coordinated Market Economy
CNAMGS. . . .Caisse Nationale d’Assurance Maladie et de Garantie Sociale DALE . . . .Disability-Adjusted Life Expectancy
FE . . . .Fixed Effects
GDP . . . .Gross Domestic Product HDI . . . .Human Development Index IC . . . .Institutional Complementaries ILO . . . .International Labour Organization IPD . . . .Institutional Profile Database IR . . . .Insecurity Regime
ISR . . . .Informal Security Regime
LEAP . . . .Livelihood Empowerment Against Poverty LME . . . .Liberal Market Economy
LPA . . . .Latent Profile Analysis MAM . . . .Middle Africa Model MME . . . .Mixed Market Economy
NHIS . . . .National Health Insurance System NHP . . . .National Health Policy
PR . . . .Proportional Representation PRT . . . .Power Resource Theory RE . . . .Random Effects
ROAM . . . .Redevance Obligatoire L’Assurance Maladie SAM . . . .Southern African Model
SME . . . .Social Market Economy SSA . . . .Sub-Saharan Africa
UNDP . . . .United Nations Development Program VoC . . . .Varieties of Capitalism
Table of Contents
. . . ii
List of Abbreviations . . . iii
Table of Contents . . . iv
List of Tables . . . vi
List of Figures . . . vii
1 Introduction . . . 1
2 Electoral Rule Choice in Transitional Economies . . . 4
2.1 Introduction . . . 4
2.2 Literature Review . . . 6
2.3 Theory . . . 9
2.4 Data and Empirical Approach . . . 10
2.4.1 Sample Selection . . . 10
2.4.2 The Effective Number of Parties . . . 10
2.4.3 Independent Variables . . . 12
2.4.4 Descriptive Statistics . . . 20
2.4.5 Empirical Strategy . . . 26
2.5 Results . . . 26
2.6 Conclusion . . . 33
3 The Co-Evolution of Economic and Political Institutions in Developing Countries . 35 3.1 Introduction . . . 35
3.2 Literature Review . . . 38
3.3 Hypotheses and Theory . . . 40
3.4 Data and Empirical Approach . . . 46
3.4.1 Dependent Variables . . . 46
3.4.2 Independent Variables . . . 48
3.4.3 Descriptive Statistics . . . 54
3.4.4 Empirical Strategy . . . 61
3.5 Results . . . 62
3.5.1 Principal Component Analysis for Coordination . . . 62
3.5.2 An Empirical Test of the Hypotheses . . . 70
3.6 Conclusion . . . 81
4 Social Protection Clusters in Sub-Saharan Africa . . . 85
4.1 Introduction . . . 85
4.2 Literature Review . . . 88
4.2.1 The Welfare State In Developing Countries . . . 88
4.2.2 Social Protection in Sub-Saharan Africa . . . 93
4.2.3 Streamlining the Social Protection Literature on Sub-Saharan Africa . . . . 94
4.3 Descriptive Statistics . . . 95
4.4 Analysis . . . 101
4.4.1 Updating the Picture on Social Protection in Sub-Saharan Africa . . . 101
4.4.2 Latent Profile Analysis . . . 102
4.5.1 Social Protection Clusters in Sub-Saharan Africa . . . 104
4.5.2 Inactive Variables . . . 110
4.6 Exploring the Success of Cluster one . . . 112
4.7 Social Protection in Sub-Saharan Africa and the Co-Evolution of Economic and Political Institutions . . . 118
4.7.1 The Welfare Clusters and Economic Coordination . . . 118
4.7.2 Reasons For Social Protection Systems in Sub-Saharan Africa . . . 124
4.8 Conclusion . . . 129 5 Conclusion . . . 132 Appendices . . . 137 A . . . 137 B . . . 141 C . . . 143 Bibliography . . . 160 Summary . . . 160
List of Tables
2.1 Summary Statistics of Data . . . 25
2.2 The determinants of the effective number of parties (FE model) . . . 27
2.3 The determinants of the effective number of parties (PCSE model, full sample) 30 2.4 The determinants of the effective number of parties (PCSE model, democratic sample) . . . 31
3.1 Summary Statistics for the Dependent Variables . . . 46
3.2 Summary Statistics for the Independent Variables . . . 48
3.3 Correlation matrix of independent variables . . . 53
3.4 The determinants of hypotheses one through three . . . 72
3.5 The determinants of hypotheses one through three with control variable De-mocracy . . . 73
3.6 The determinants of hypotheses one through three with the control for econo-mic development, logGDP . . . 75
3.7 The determinants of hypotheses one through three with fractionalization. . . . 76
3.8 The determinants of hypotheses one through three with control variables de-mocracy, logGDP, and fractionalization . . . 79
4.1 Modified means for clusters 1 through 4 . . . 105
A.1 The determinants of the effective number of parties (PCSE model, democratic sample with threshold of democracy as the average Polity IV score from 1995 to 2012) . . . 138
A.2 The determinants of the effective number of parties (FGLS model, democratic sample) . . . 139
A.3 Countries, Polity IV Scores, and Electoral Rule System Family . . . 140
B.1 Independent variables, their full definitions, and their measurements . . . 141
B.2 Results from the Principal Component Analysis . . . 142
C.1 List of Data and Cluster Membership . . . 144
C.2 Results from the principal component analysis . . . 147
C.3 The determinants of the effective number of parties (PCSE model, full sample) 168 C.4 The determinants of the effective number of parties (PCSE model, democratic sample) . . . 169
C.5 The determinants of hypotheses one through three with control variables de-mocracy, logGDP, and fractionalization . . . 176
List of Figures and Illustrations
2.1 Correlation Between the Number of Effective Parties and Coordination . . . . 13
2.2 Correlation Between the Effective Number of Parties and Coordination for the Democratic Sub Sample . . . 14
2.3 The Averages of the Effective Number of Parties Across Countries from 1995 to 2012 . . . 21
2.4 The Averages of the of Exports (as a per cent of GDP) Across Countries from 1995 to 2012 . . . 22
2.5 The Averages of Manufacturing (as a per cent of GDP) Across Countries from 1995 to 2012 . . . 22
2.6 The Averages of the Primary Education Completion Rate Across Countries from 1995 to 2012 . . . 23
2.7 The Averages of the Unemployment Rate Across Countries from 1995 to 2012 24 2.8 The Averages of Market Capitalization Across Countries from 1995 to 2012 . . 24
3.1 The Welfare State Indicator Across Countries . . . 54
3.2 Government Spending of Health Across Countries . . . 55
3.3 The Gini Coefficient Across Countries . . . 56
3.4 The D9D1 Ratio Across Countries . . . 56
3.5 The Poverty Gap Across Countries . . . 57
3.6 The Vocational Training Indicator Across Countries . . . 58
3.7 The Employee Contract Protection Indicator Across Countries . . . 59
3.8 The Social Dialogue Indicator Across Countries . . . 59
3.9 The Union Indicator Across Countries . . . 60
3.10 The Strike Indicator Across Countries . . . 61
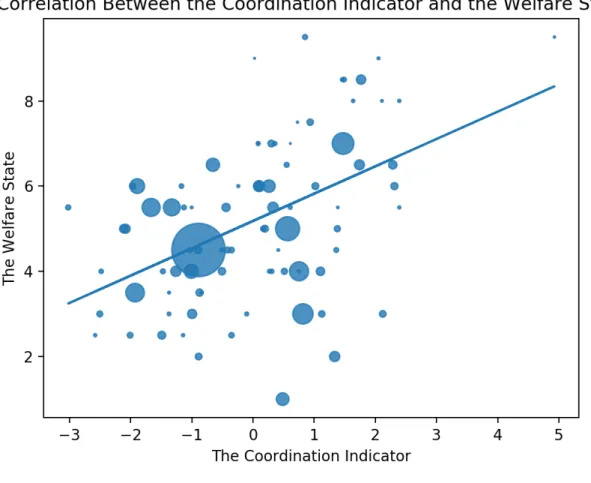
3.11 Correlation of the coordination indicator and the welfare state for the full sample of countries . . . 62
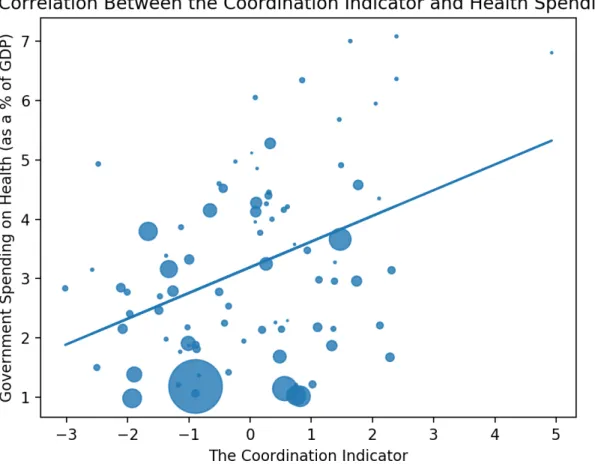
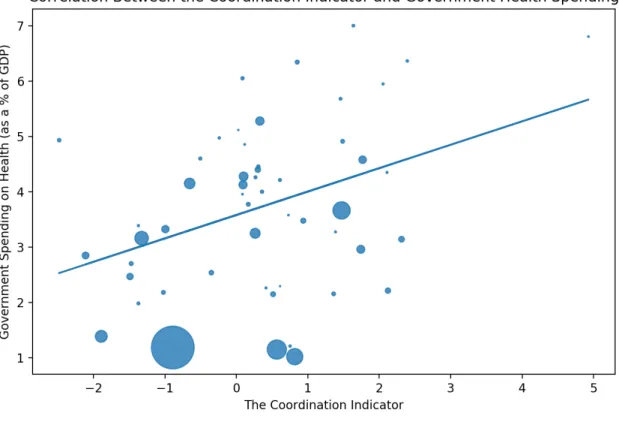
3.12 Correlation of the coordination indicator and government spending on health for the full sample of countries . . . 63
3.13 Correlation of the coordination indicator and the Gini coefficient for the full sample of countries . . . 64
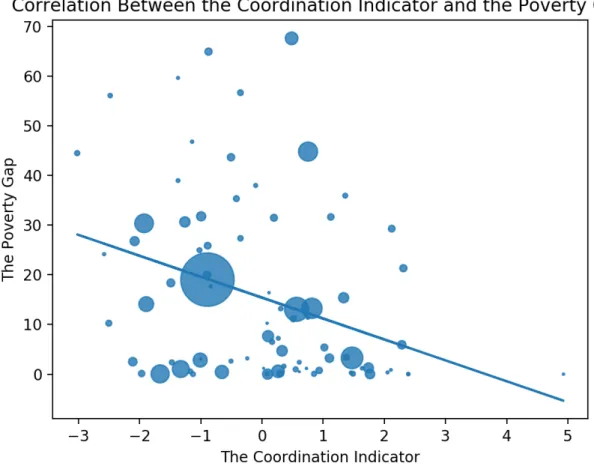
3.14 Correlation of the coordination indicator and the poverty gap for the full sample of countries . . . 65
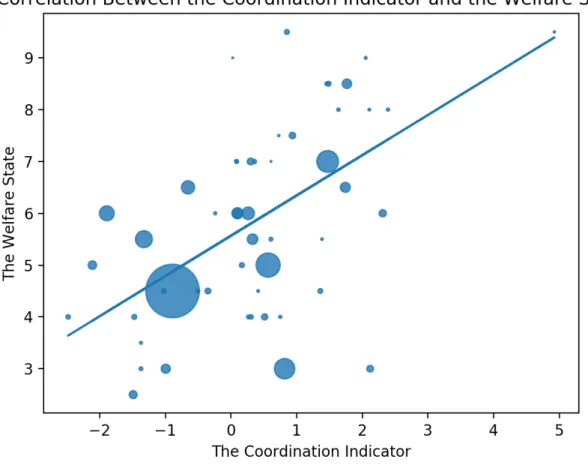
3.15 Correlation of the coordination indicator and the welfare state for the demo-cratic sample of countries . . . 66
3.16 Correlation of the coordination indicator and government spending on health for the democratic sample of countries . . . 67
3.17 Correlation of the coordination indicator and the Gini coefficient for the de-mocratic sample of countries . . . 68
3.18 Correlation of the coordination indicator and the poverty gap for the demo-cratic sample of countries . . . 69
4.1 Literacy rates across Sub-Saharan Africa . . . 96
4.3 The life expectancy across Sub-Saharan Africa . . . 98
4.4 Coverage (per cent) All social and labour protection in Sub-Saharan Africa . 99 4.5 Adequacy of social protection and labour programs (Per cent of total welfare of beneficiary households) in Sub-Saharan Africa . . . 100
4.6 Country clusters one through four . . . 105
4.7 Correlation Between Welfare Mix Principal Component and Vocational Trai-ning . . . 120
4.8 Correlation Between Government Spending on Public Health and Vocational Training . . . 121
4.9 Correlation Between Health Care Expenditures not Financed by Household Out of Pocket Payments and Vocational Training . . . 121
4.10 Correlation Between Government Spending on Education and Vocational Trai-ning . . . 122
4.11 Correlation Between Welfare Mix Principal Component and Union Density . . 122
4.12 Correlation Between Welfare Mix Principal Component and Public Sector Wages (as a Per Cent of GDP) . . . 125
4.13 Correlation Between Pensions and Public Sector Wages (as a Per Cent of GDP) 125 4.14 State Ownership of the Economy in Cluster One . . . 126
4.15 State Ownership of the Economy in Cluster Two . . . 127
4.16 State Ownership of the Economy in Cluster Three . . . 128
4.17 State Ownership of the Economy in Cluster Four . . . 129
C.1 BIC Values for 1 to 9 Clusters . . . 145
C.2 BIC Values for 1 to 9 Clusters, obtained with PriorControl() . . . 146
C.3 Relation entre la coordination ´economique et le nombre effectif de partis pour l’´echantillon complet . . . 166
C.4 Relation entre la coordination ´economique et le nombre effectif de partis pour l’´echantillon d´emocratique . . . 167
C.5 La Corr´elation Entre la Coordination Economique et L’´etat Social . . . 171
C.6 La Corr´elation Entre la Coordination Economique et les D´epenses Gouverne-mentales sur la Sant´e . . . 172
C.7 La Corr´elation Entre la Coordination Economique et le coefficient de Gini . . 173
C.8 La Corr´elation Entre la Coordination Economique et l’Ecart de Pauvret´e . . . 174
C.9 Le taux d’alphab´etisme pour l’Afrique Subsaharienne . . . 178
C.10 L’´ecart de pauvret´e pour l’Afrique Subsaharienne . . . 179
C.11 L’esp´erance de vie pour l’Afrique Subsaharienne . . . 179
C.12 Les Grappes 1 `a 4 . . . 180
C.13 La Corr´elation Entre L’indice de l’Etat Sociale et La Formation Professionnelle182 C.14 La Corr´elation Entre les D´epenses Publiques sur la Sant´e et la Formation Professionnelle . . . 183
C.15 La Corr´elation Entre les D´epenses Publiques sur l’Education et la Formation Professionnelle . . . 183
Chapter 1
Introduction
As nations around the world become closer and increasingly interdependent, the changing global context requires a parallel advancement of academic research. Theories developed for advanced democracies in the twentieth century now require complimentary additions, or perhaps diverging counterparts, to help explain the developmental processes of developing countries.
To address these changes, scholars have created new theories or extended old ones to consider developing countries. However, despite the positive and thorough advancements thus far, the dy-namic nature of countries undergoing development and transition, both economic and political, means that the work is far from finished.
The literature on institutional development in the political economy for advanced democracies is, while still evolving, well established. The theories supporting the research within this thesis rely on comparative capitalism (CC) studies focused on advanced democracies. CC as a disci-pline considers how institutions across various economic spheres interact with one another to form unique national arrangements. Within these national configurations, institutions work in an in-terdependent manner to generate economic systems. Institutional complementarities within these systems produce distinct comparative advantages that, with inputs, shape how economic actors and the government coordinates (Jackson and Deeg, 2008).
As on offshoot of CC, the varieties of capitalism (VoC) approach, first delineated by Hall and Soskice (2001), was created to consider the institutional similarities and differences of advanced democracies with developed capitalist economies. VoC theory adopts a firm centric approach to show how firms develop and exploit core competencies. The way that firms manoeuvre different spheres in the political economy to solve coordination problems internally and externally of the
firm creates specific economic patterns at the national level. A country relying heavily on market forces to solve coordination issues is called a liberal market economy (LME). Contrary to LMEs, coordinated market economies (CMEs) rely on non-market, strategic relationships to coordinate with other economic actors and ultimately exploit their core competencies.
The VoC theory, and its extensions, shows how the LME and CME ideal types lead to different political intuitions, different types of welfare states, and different welfare state outcomes. This rich literature of VoC theory, while it does not go unchallenged, has provided a useful framework for considering the paths developed nations follow in the political economy.
The purpose of this thesis is, using the key tenants of CC and VoC theory, to expand this literature to developing countries. The philosophy found in this thesis is that, like advanced democracies, there should be underlying structural forces in the political economy that direct nations on certain pathways throughout development.
Chapter two, using VoC theory, tests if economic ideal types in the developing world impact poli-tical institutions. The results of this chapter indicate that coordinated economies, characterized by skilled production, a stronger manufacturing sector, widespread primary education, lower levels of unemployment, and lower levels of market capitalization tend to produce a higher effective number of parties, translating into a more proportional electoral rule system. These results are stronger for democracies than they are for the full sample of 65 developing countries.
In chapter three, this thesis considers how the economic institutions found in the ideal types co-evolve with the political institutions formed along their pathway to development. This shows how economic and political institutions co-evolve, and how this co-evolution creates a certain trajec-tory that affects the welfare state and ultimately welfare state outcomes. Chapter three shows how labour market indicators are coordinating features for the labour market. In turn, as coordinated economies tend to have coordinated labour markets, these variables serve as a representation of the coordinated economy. This chapter shows how features of the coordinated labour market
im-pact the welfare state, and welfare state outcomes, such as inequalities and poverty. Moreover, this chapter highlights which of these indicators are the most powerful in influencing the welfare state system. This chapter concludes that, as it has been previously shown in the literature with advan-ced democracies, the co-evolution of economic and political institutions tend to produce different types of welfare states with welfare state outcomes.
Finally, as much of this thesis is based off previous literature and empirical studies, chapter four in this thesis focuses on a specific region, Sub-Saharan Africa (SSA), to further advance the know-ledge on the welfare state and social protection in developing countries. To accomplish this, chapter four uses a latent profile analysis (LPA), which is an empirical method used to uncover concealed groups in data. The goal of the LPA in chapter four is to find clusters within SSA using social protection variables, a civil society measure, welfare outcome variables, and a measure of demo-cracy. In effect, chapter four uses the concept of the welfare mix and welfare outcomes to divide the Sub-Saharan African countries into various latent clusters. The social protection variables, which constitute the welfare mix, used in this analysis are government spending on education, go-vernment spending on health, domestic private spending on health, remittances from abroad, and foreign aid. A civil society index is also included to measure community support. The welfare outcome variables used are the Human Development Index, the adult literacy rate, poverty, and the life expectancy. Chapter four further uses a democracy index to discover if the fact of being a democracy affects social protection clusters in SSA.
Thus, this thesis provides an overall view of how economic structure, comprised of various eco-nomic institutions, impacts political institutions, and then how these ecoeco-nomic and political insti-tutions co-evolve to form certain path dependent trajectories. Ultimately, this thesis considers how these particular pathways influence the welfare state of a nation, and the welfare state outcomes derived from the types and level of social protection that the welfare state produces in developing countries.
Chapter 2
Electoral Rule Choice in Transitional Economies
2.1
Introduction
In 2010, a wave of protests, popularly coined as the Arab Spring, started in Tunisia. Two years later, at the end of the civil uprisings, 17 Middle Eastern and North African regimes felt at least some pressure from the people in their country, and five countries actually experienced a regime change1. In Syria, a multi-sectarian civil war persists since 2011, with the original leader still in power. Presently, only Tunisia has emerged from internal conflict as a democracy. These uprisings resurfaced the question of emerging democracies, and the paths that a nation can choose from their transition into their following consolidation.
The Arab Spring and subsequent global unrest sparked a debate about whether a fourth wave of democracy emerged in the global political arena starting in 20102. A different source started each wave, but the end result stays the same : a government transitioning from a non-democratic regime to a democratic one. A key issue arises from these emerging democracies, or ‘countries in transition’, about what types of government institutions will be adopted by the new democracies. The emphasis in this chapter is placed on what determines electoral rule choice in transitional nations.
This chapter considers how economic structure impacts the proportionality of the electoral system, via the electoral rules adopted by a country. A varieties of capitalism approach is used to determine
1. These countries are Egypt, Libya, Morocco, Tunisia, and Yemen.
2. From the article : “Starting in Egypt : The Fourth Wave of Democratization ?” by Stephan R. Grand (Feb., 2011). Grand suggests that with the collapse of the Ben Ali regime in Tunisia and the Mubarak regime struggling (at the time) in Egypt there may be a fourth wave of democracy. The previous three waves of democracy come from the book by Huntington (1991).
if the coordinated market economies and liberal market economies divide exists in transitioning countries by using simple, disaggregated macroeconomic indicators. Coordinated economies rely on strategic or non-market coordination, meaning that economic actors work together to achieve results outside of market forces. A liberal economy functions by mainly using market forces to solve coordination problems.
Previous work by Cusack, Iversen, and Soskice (2007, 2010) found that in Western Europe the economic structure shaped the outcomes of electoral rule choice at the turn of the 20th century. This chapter intends to extend the existing theoretical framework to transition countries, including two Arab Spring participants, Morocco and Tunisia, to evaluate electoral rule choice when building new government institutions. The remaining countries studied in this chapter include nations from Latin and South America, nations from Sub-Saharan Africa, nations affected by the dissolution of the USSR, and emerging economies in Asia. Specifically, this chapter tests if the evolution of the organization and structure of the economy as a country undergoes a political transition impacts its electoral rule system. It is predicted that more coordinated economies, as defined by their macroeconomic characteristics, will lead to more proportional electoral rule systems.
To test this hypothesis, the effective number of parties resulting from legislative elections, which is used as a proxy for the electoral rule system, is regressed on macroeconomic indicators, which are used as proxies for coordination. Next, additional regressions use a democratic sample to witness the differences between non-democratic and democratic regimes undergoing the transition process. This addition is needed since many transitional nations cannot be considered as democratic, and the theoretical framework is set for democratic countries. Although using the democratic sample touches the previous literature more closely, it is an interesting exercise to see how this theory works for countries in general in the developing world, democracies or not.
The findings show that strategic coordination, as measured by basic attainment of education levels, a strong industrial sector, a focus away from exports, which are likely commodity goods, and a weaker reliance on equity markets to access finance, tend to encourage the adoption of proportional
representation (PR) electoral rules. The findings are stronger in democracies.
The structure of the chapter is as follows. First, the theoretical background on CMEs versus LMEs, the majoritarian and PR electoral rule divide, and the effect of economic organization on electoral rule choices is presented. Second, a brief note about the structure of transitioning economies pro-vides insight into the countries studied in this chapter. Then, the data are explained, along with the empirical approach used in this chapter. After, the results from the empirical work are given and interpreted. Finally, the conclusion summarizes the findings from this study.
2.2
Literature Review
This chapter considers a range of literature due to the multidisciplinary approach used in this study. When considering CMEs versus LMEs, Hall and Soskice (2001) place the firm at the center of the analysis. They state that firms are actors seeking to exploit core competencies, or methods to develop, produce, and distribute goods profitably. Capabilities of the firm are relational, so the firm must coordinate with the economic actors connected to the success of the firm. There are five spheres firms need to develop in order to eliminate the coordination problems that arise with the relational nature of the firm : the industrial relation sphere, the vocational training sphere, the corporate governance sphere, the inter-firm relations sphere, and the sphere of employee relations. Non-market relationships define the way CMEs build and exploit their core competencies. Vocatio-nal training systems, technology transfers, labour market regulation, and employee representation characterize coordinated capitalist countries. In CMEs, employers are more prone to cooperating with unions to ensure that the workers are trained with specific skills.
In LMEs, firms coordinate mainly through the competitive market. There is an emphasis on flexible labour markets, which favour general education and skills, and the dismantling of unions. Firms have little incentive to protect their employees, as their employees have no specific skills unique to their firm or industry (Soskice and Iversen, 2011).
CMEs and LMEs each have institutional complementarities (ICs) operating across their respective political economic spheres. ICs occur when the presence of one set of institutions raises the returns available from another institution. Amable (2016) states that when jointly present, ICs reinforce one another and improve the function and stability of specific institutional configurations. This becomes quite relevant as ICs imply there is no “right way” of configuring an institutional set up, only that one institutional presence in an economy impacts another.
Development on the VoC literature came after the realization that many countries did not fit into either the CME or LME category. After recognizing that a type of ‘mixed market economy’ (MME) exists, scholars such as Amable (2003) extended the VoC theory to include more classifications, such as the Market-based Model, the Social-Democratic model, the Continental European Model, Mediterranean Model, and the Asian Model.
However, the inclusion of MMEs and additional categories still largely focus on developed coun-tries. Others have created theories to explain the type of capitalism in Latin America (Bizberg, 2014) and East Central Europe (N¨olke and Vliegenthart, 2009). Although the inclusion of develo-ping countries using new categories provides insight into workings of the respective countries or regions, the new VoCs are, in most cases, extremely specific and are limited regionally. Thus, a gap in the VoC literature exists, for it is still unknown whether the theory built around advanced democracies can be applied to developing or transitioning countries.
The VoCs are linked to political institutions. Before considering political institutions, however, one should first understand how democracies are shaped. Lijphart (1999) divides democracies into two separate camps : majoritarian democracies and consensus democracies. The camps are defined by the underlying belief of to whom governments are responsible. Majoritarian countries believe the government should be accountable to the majority of the people, while consensus governments should be accountable to as many people as possible. Lijphart (1999) finds that consensus go-vernments tend to multi party systems with PR, while majoritarian gogo-vernments tend to two party systems with higher levels of disproportionality.
Cusack, et al. (2007) extend this idea by explaining how the economic structure of a country influences the choice of electoral rules. They find that when looking at advanced democracies, countries with coordinated economies at the end of the 19th century tended to develop PR electoral rules at the turn of the 20th century. On the other hand, the nations with LMEs tended to develop majoritarian electoral rules.
Cusack, et al. (2007) conclude that the origin of PR came from the movement of economic net-works from a local to national level. With coordinated local economies, a common interest existed in a regulatory system and some form of insurance against specific assets with respect to skill acquisition. The incentives and opportunities for class collaboration inspired the PR system. Cusack, et al. (2010) show this logic also works in the short run. Countries with organized eco-nomic interests leads to specific groups wanting their interests represented in the legislature. The short run argument aligns up with the long run analysis because a political economy that starts with heavy investment in co-specific assets will be comprised of representative parties. PR is the preferred electoral system when parties are representatives of specific interests.
Conversely, majoritarian systems keep their electoral system in place because their political eco-nomy is starting off with investments in general assets, and therefore want an electoral rule system that benefits broad campaigns that target the support of a “middle” group. In the short run, econo-mies comprised of weakly organized interests will opt to maintain the majoritarian electoral rule system in order to best protect the middle class interest.
Including the short run analysis in the argument is crucial because it extends the investigation to a set of newly democratizing countries and their choice of electoral systems.
2.3
Theory
This chapter tests the work of Hall and Soskice (2001) and Cusack, et al. (2007, 2010) on a sample of transitioning countries. Here, transitioning countries are defined as countries in the process, at any stage, of undergoing a regime change from an authoritarian regime to a democracy. These nations largely overlap with what are considered developing countries in economic literature. The literature on the types of capitalism, and the following adoption of electoral rules for advanced democracies is well known, but little exists about how economies in transition adapt and then evolve their political institutions, notably their electoral rules.
In general, the concepts derived from the work by Cusack, et al. (2007, 2010) are applied to this study. There are, however, a few notable exceptions. The first exception comes from the nature of national continuity. Where advanced democracies have experienced decades of stability, develo-ping nations may have been disrupted by colonization or civil wars.
A second issue arises from variable choice. For example, Cusack, et al. (2007) considered the presence of traditional guilds to increase the level of coordination in the economy. However, tran-sitional countries have experienced ruptures in their economies that have hindered the development of traditional guilds. An example of this is the economic reorganization of colonized countries to serve their parent country, such as how the Belgian government set up extractive institutions in the Congo (Acemoglu, Johnson, and Robinson, 2001). For this reason, variable selection may differ in this analysis.
Other variables to consider arise from development economics. Development economics often focuses on how certain macroeconomic indicators impact democracy and the democratic transition. Advocates of modernization theory state that as a country develops, by increases in the levels of education and income, it will become more democratic.
If indicators such as education or other macroeconomic variables can impact the evolution of de-mocracy, then they might also help in understanding how the structure of the economy, as it is
formed by macroeconomic variables, can impact the path of democracy of a transitioning country.
2.4
Data and Empirical Approach
2.4.1 Sample Selection
The database constructed for this study includes 65 countries selected from the Bertelsmann Trans-formation Index (BTI) from Bertelsmann Stiftung. Every country in the BTI was used in this da-tabase if there was also available election data and economic data for the respective country. The countries used are shown in appendix A. Overall the BTI includes 129 countries. The election data come from the Parline database supported by the Inter-Parliamentary Union, an organization that works closely with the United Nations.
The time period for this study ranges from 1995 to 2012. This period was chosen due to the ability of data and due to the characteristics of the countries included in this study, notably that many countries formed only in the 1990s.
2.4.2 The Effective Number of Parties
Effective number of parties (effnops). The dependent variable is the effective number of parties resulting from legislative elections. In the case of bicameral legislatures, all election data came from the lower house. A unicameral legislature is a legislative system with only one body of par-liamentary members, for example the Danish parliament, the Folketing. A bicameral parliament is a legislative system that has two houses, the lower house, which typically is bestowed with more power, and the upper house. An example of a bicameral legislative system is the United States with the House of Representatives (lower house) and the Senate (upper house). This variable is intended to proxy the electoral rule systems studied in the literature : proportional representation and majoritarian.
There are differences between the proxy used in this chapter and the actual electoral rules of a system. An electoral rule is an ex ante tool to allocate seats in a legislature. The effective number of parties is an ex post number indicating the fragmentation of a legislature. A more fragmented legislature represents a more proportional legislature because each different fragment represents a separate entity. This proxy works by indicating that a high number means the system tends toward PR, while a lower number indicates a majoritarian system with a smaller number of effective parties3.
The effective number of parties can be found by measuring either votes or seats gained by each party that arise from an election. This chapter uses the number of seats. The variable is calculated by
e f f nops = 1
Âs2i (2.1)
where s represents party i’s proportion of the seats gained. This measure provides a more realistic representation of seats in a parliament because it places a higher weight on parties with many more seats than on parties with few seats (Benoit, 2001). The number 4.14 implies that the party system is “in effect” as fragmented (proportional) as if there were 4.14 identically sized parties.
This variable was chosen due to the availability of data and because of the abundant use of the effective number of parties as a measure of proportionality in the literature. It should be noted that criticism of the index has come up4, and another measure of proportionality, the effective electoral threshold, is often said to be a stronger measurement tool. However, as Gallagher (1991) points out, no single method is uniquely accepted as a means to measure proportionality. Additionally, calculating the threshold from the average district magnitude typically gives an overestimation due to the presence of large districts (Kalandrakis, 2002).
Lastly, using OECD data, the two variables tend to correlate to one another, such that a more
3. Markku Laakso and Rein Taagepera developed the effective number of parties indicator in the late 1970s to measure party system fragmentation. The basis for the variable comes from a fractionalization indicator constructed by Douglas Rae (1968). This variable gives the in effect number of parties in a legislature resulting from an election.
4. Golosov (2010) states that the mathematical devised by Laakso and Taagepera is associated with the serious problem that the index does not differentiate well between cases of one-party dominance and two-party constellations.
proportional system will have a lower effective electoral threshold and a higher number of effective parties. The correlation coefficient is -0.67 and a regression run using the OECD data shows that the p-value is significant at one per cent and the R-squared value is 0.4426. Thus, the effective number of parties is regarded as the best available variable for this study.
The effective number of parties changes with each election year, and then stays the same throu-ghout the database until the next election year for a specific country.
2.4.3 Independent Variables
The goal of this chapter is to witness how the level of economic coordination, whether it reflects either a CME or LME, impacts the choice of electoral rules. The independent variables represent economic coordination within a country. Economic coordination can be tricky to define in the em-pirical and in the literal sense. Indeed, Hall and Gingerich (2009) state that coordination is not perfectly measured in the political economic literature. The use of five macroeconomic variables avoids the problems of using coordination indices, outlined in detail below, by evaluating the per-formance of the economy as suggested by the actual level of the coordination in the economy, not the way in which an index suggests the level of coordination should be.
The first attempt to analyze the connection between proportionality and coordination was made by using a compilation of economic coordination indicators found in the Institutional Profile Database (IPD)5.
The compilation of the economic coordination index uses four key economic coordination va-riables that are found in the IPD (2012), which included 143 countries in the 2012 round. These variables include the independence and pluralism of trade unions, redeployment and retraining me-chanisms for employees and continuous vocational training, employment contract protection, and the effectiveness of social dialogue at a company level, a national level, and a branch level. Each
5. The IPD has four rounds from years 2001, 2006, 2009, 2012. It is a valuable resource for cross-section assess-ment, but is not yet appropriate for time series analysis due to the inconsistency across rounds.
of the separate components of coordination also has a positive relation with the proportionality of the electoral rule system, but in order to give a more encompassing view, the four indicators were combined6. A score of 0 represents very weak or absent non-market coordination, whereas a score of 4 represents a high level of non-market coordination. The effective number of parties measures the proportionality of the electoral system.
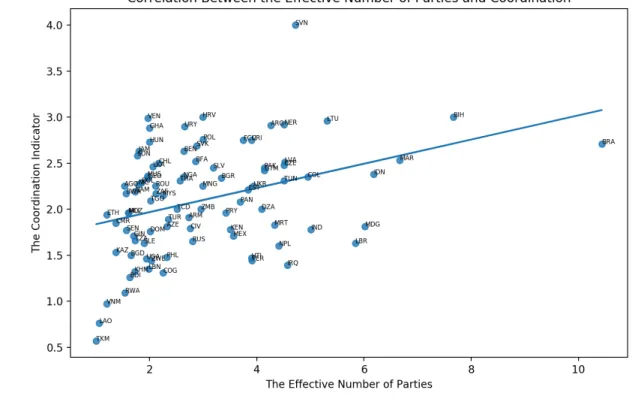
The graph shown in figure C.3 includes 89 countries7. In the North-East quadrant of the graph, the section of the graph with a higher number of effective parties and a higher ranking of coordination, all countries have adopted PR systems. The most South-West quadrant of the graph, the part inclu-ding Turkmenistan, Laos, and Vietnam, includes countries that have adopted majoritarian electoral rules, as stated by the Database for Political Institutions.
Figure 2.1: Correlation Between the Number of Effective Parties and Coordination
6. These variables were compiled using a simple average.
7. Due to additional data available, more countries are evaluated in this descriptive statistic than in the final regres-sions. All countries included in the regression are included in this graphic.
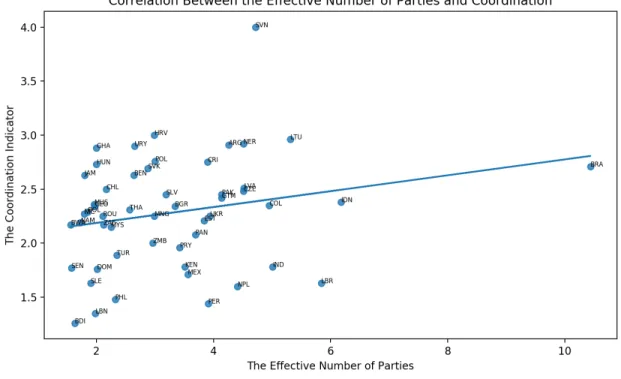
However, many of these countries in the South-West quadrant of figure C.3, notably the specific ones mentioned above, are not authentic democracies. For this reason, the graph shown in figure C.4 includes 52 countries, which represent the democratic sub-sample from the database. The South-West quadrant shows a mixture of electoral rules, but in the section of the graph correspon-ding to the countries with the highest level of coordination and the highest number of effective parties, only PR electoral systems remain. The data suggest that there is a tendency for high co-ordination in an economy and a large number of effective parties to correspond with proportional electoral rules.
Figure 2.2: Correlation Between the Effective Number of Parties and Coordination for the Democratic Sub Sample
To improve the understanding about the relationship between the effective number of parties and the economic coordination of a country, a regression analysis is used in this chapter.
Coordination indices are often advised when studying economic coordination. For example, Bo-tero, et al. (2004) builds coordination indices for 85 countries based off of employment, collective
relations, and social security laws. These indicators are beneficial for studying more developed countries, but may overestimate the strength of coordination in an economy for the cases of deve-loping or transitioning countries for a few reasons.
First, instead of one index, a panel database shows how the economic structure impacts the propor-tionality of the electoral rule system over time. Also, these coordination indices are usually built after the beginning of the democratic transition.
The next drawback of indices is that written laws may be carried out differently in practice than what is stated in written form. For example, in Mozambique, a law formed in 1990 strongly protec-ted the rights of workers, but this law was limiprotec-ted because the way the companies behaved (mis-representation of company performance, mismanagement) hindered the performance of unions. Often, the laws in the rulebooks of developing nations are not enforced or formally respected (Dibben and Williams 2012).
A third drawback when using a coordination index for this study unfortunately applies to the work done in this chapter as well. Transitional countries often have a large proportion of informal labour. An International Labour Organization (ILO) report using 40 countries, 37 of which are in this study, evaluates the severity of informal labour. Out of the 37 countries which overlap between the two studies, 19 countries have over a 50 per cent share of informal jobs in total employment, over a 50 per cent share of people employed in the informal sector, or over a 50 per cent share in both of these categories. When lowering the threshold to 30 per cent, 29 countries fall into one of these three categories8.
Additionally, Webster, Wood, and Brookes (2006) state that in Sub-Saharan Africa, a region featu-red in this chapter, there is a reliance on personal networks in the labour market that favour local practices over lawful ones, such that even when labour unions are present, their impact on practices in the workplace is likely to be limited in scope. For example, the 1998 Labour Law in
Mozam-8. ILO Database from “Women and men in the informal economy – Statistical picture.” Found in ILO LABORSTA Internet by ILO and WIEGO.
bique provides workers a sufficient level of job security and collective bargaining rights, but this law excludes casual workers. To avoid being subject to the 1998 Labour Law, firms increasingly began to classify their employees as casual workers.
This means that despite having laws that provide (or discourage) coordination between the firm and its employees or unions, a significant amount of the work force is not ruled by the legal framework, making the coordination indices less useful.
Due to the problems outlined above and insufficient coordination data on transitioning countries, the strategy used in this chapter is to evaluate how coordinated economies impact certain macroe-conomic indicators, and then use these indicators as proxies for coordination.
The macroeconomic variables serving as the independent variables in this study come from the World Development Indicators database by the World Bank.
Exports9. Cusack, et al. (2007, 2010) state that skill-based exports of goods and services, as a percentage of GDP, should have a positive relation to electoral proportionality. Exports within the industrial sector levy a premium on the ability of firms to differentiate their products, thus encouraging firms to take advantage of specific skills. Cusack, et al. (2007) state that a strong export sector works as an indicator of the necessity for compromises over wages and training, which is a known feature of coordinated economies.
However, in this chapter a significant portion of the transitional countries are commodity exporters. If a country has a significant export sector, but is largely exporting commodity goods, this could reflect a lack of coordination in the economy, as workers are not required to have high levels of skills to work for firms focused on commodities. Exports are an important indicator in categori-zing CMEs, but the composition of the export sector is the crucial factor. Exports, due to the two potential effects, have an ambiguous relation to the effective number of parties.
Primary. Primary education, as measured by the total primary completion rate10, is expected to have a positive relation to the effective number of parties in this study.
Turner (2006) states that CMEs have institutions that limit the amount of educational inequality. Moreover, the mean percentage of GDP spent on social expenditures, a category that includes public education, is higher in CMEs than in LMEs.
Iversen and Soskice (2009, 2011) add to this concept by finding that there is more education equa-lity in CMEs, and that educational performance is better in CMEs at the lower end of the scale. In CMEs, those with little formal education earn higher education scores as compared to their counterparts in LMEs. The link between basic educational attainment is related to the prevalence of vocational training in CMEs. Further, they conclude that businesses in CMEs require relatively high levels of literacy and numeracy, even for those from weaker educational backgrounds, in order to invest in further training in their workers. In LMEs, there is an increasing need for higher educa-tion, which by extension means that those who achieve a higher education also passed the primary level, but this achievement comes at the cost of increasing inequality in educational outcomes in these countries. Since the amount of educational inequality is minimized in CMEs, there should be an overall higher number of people who achieved a primary education.
Moreover, Hall and Gingerich (2009) state that training systems in CMEs build off what the wor-kers employed by a firm achieve in formal schooling before employment. Since having a primary education is a base on which to build these skills, a high level of primary education will be encou-raged in CMEs and positively impact electoral system proportionality.
Manufacture. As a proxy for the level of industrialization, the amount of manufacturing as a per-centage of value added to GDP is predicted to have a positive relation to the effective number of parties. Countries with high levels of industrialization face the greatest need to organize and
coor-10. Primary completion rate is measured as the gross intake ratio to the last grade of primary education. It is calcu-lated by taking the total number of students in the last grade of primary school, minus the number of repeaters in that grade, divided by the total number of children of official graduation age (World Bank).
dinate their economic activities. Jo Martin and Swank (2012), who focus on the role of business associations and labour market coordination, state that the leaders of industrialization incur the greatest need to organize to obtain economic order, and therefore higher manufacturing shares of total economic output should tend to encourage higher levels of business organization. In addition, firms in manufacturing require a more skilled labour force to produce their product. Manufacturing firms provide specific training to their workers, and workers will demand insurance for the skills in which they have developed. For this reason, manufacture should positively impact proportionality. Unemployment11. Kenworthy (2002) analyzes the relationship between corporatist countries and unemployment. Corporatist countries, due to the emphasis on bargaining and negotiation, align with the coordinated market economies. Kenworthy states due to wage restraint, many studies have shown a connection between low unemployment and corporatist countries. He finds a rela-tion between countries with coordinated wage-setting agreements and low unemployment in the 1980s for OECD countries. This relation continues into the 1990s, but the reasoning behind the relationship changes. In the 1990s, the link between corporatist countries and low unemployment is because of union participation in policy making instead of wage coordination.
Turner (2006), with a similar study, finds that in the OECD during the 1980s in CMEs, unions traded wage restraint for employment, which limited the amount of unemployment in the economy. In a more time-consistent manner, Pontusson (2005) provides a convincing argument for the rela-tionship between coordinated economies, or as he names them, social market economies (SMEs), of advanced democracies and unemployment. Pontusson divides the category of advanced demo-cracies in to Nordic SMEs, Continental SMEs, and LMEs. He uses this division to visually dis-play unemployment performance across five different time periods, 1980-84, 1985-89, 1990-94, 1995-1999, and 2000-2003. In three time periods out of five, from 1980-1994, the average unem-ployment in both Nordic and Continental SMEs was lower than in LMEs. After taking the average
11. Unemployment is defined as the share of the labour force that is without work but available for and seeking employment (World Bank).
of the unemployment levels for Nordic and Continental SMEs, the unemployment level becomes lower for SMEs as a group than the LME category across all five periods. Pontusson does state that LMEs have succeeded in lowering unemployment in this time period, but his analysis clearly shows that, overtime, coordinated economies succeeded in maintaining lower levels of unemploy-ment compared to liberal economies. This finding aligns with the theory of coordinated capitalism, as the economy-wide collective bargaining practice found in CMEs encourages wage restraint, which may help improve the trade off between unemployment and inflation. Also, unemployment benefits, a notable feature of CMEs, are linked to lower levels of unemployment in coordinated economies.
For this reason, unemployment is predicted to have a negative relation to the effective number of parties.
Capital. The variable capital stands for the market capitalization12 of listed domestic companies, as a percentage of GDP, and can be thought of as a proxy for the stock market. Hall and Soskice (2001) consider that firms must be able to raise finance as a key component of VoCs. Firms ope-rating within a liberal economy typically use bond and equity markets for external finance more often and more intensely than in coordinated economies. Jackson and Deeg (2006) extend this idea by stating LMEs are more market-based than CMEs, and work in more securities-market oriented systems. Conversely, CMEs tend to be bank based, as bank based systems are likely to support investment in non-tangible assets, like employee training. Hall and Gingerich (2004) state CMEs ability to access finance is linked to their reputation rather than their share value, whereas LMEs tend to rely on large equity markets.
Hall and Gingerich (2004) note that recently CMEs have placed more emphasis on the stock market when attempting to access finance, but this pattern holds true for LMEs also. In liberal countries there is a greater reliance on market capitalization compared to bank-based means of accessing
12. Market Capitalization represents the share price multiplied by the number of shares outstanding for listed do-mestic companies (World Bank).
finance, even if CMEs are starting to rely more on equity markets. For this reason, capital should be positively associated with more liberal economies, and therefore should inversely related to coordinated economies. Capital should have a negative relation to the effective number of parties. Included in extended versions of the model are two dummy variables that account for change in the electoral system. First, electionyear is a dummy variable that accounts for if the year in question was an election year. Electionyear takes the value of 1 if the country considered held an election that year, and the value of 0 otherwise. The presence of an election year is not expected to influence the proportionality of the electoral system.
Secondly, the variable overthrow is a binominal variable, taking the value of 1 if there was a non-democratic change in leadership during the year considered. The data for overthrow comes from the Center for Systemic Peace database on coup d’´etat events (Marshall and Marshall, 2014). Overthrow is expected to be negatively related to the effective number of parties in a country, because a non-democratic means of leadership change reflects a power-grab within the country. In any situation where the government cannot control power changes within its borders, the strength of cooperation and ability to proportionally represent the people of the country is greatly weakened. A third dummy variable indicating whether a country actually has adopted a proportional represen-tation electoral system, PR, is included in the last model in this chapter. The PR variable takes the value 1 if the electoral rule system is a PR system, and takes the value 0 if otherwise. The inclusion of this variable is a simple robustness check to see that, indeed, the PR system is associated with a higher number of effective parties.
2.4.4 Descriptive Statistics
Before performing a panel regression analysis, the dependent variable and the independent va-riables are considered in greater detail.
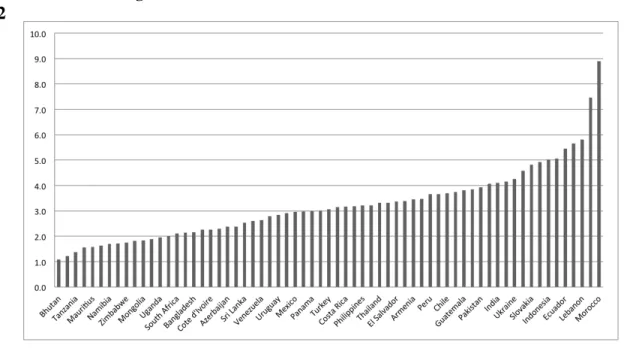
parties there are in the legislature. In this sample of 65 countries, the average effective number of parties by country from 1995 to 2012 ranges from a low of 1.1 in Bhutan to a high of 8.9 in Morocco. The average across the sample for this variable is 3.22. The largest change in the effective number of parties can be seen in Lebanon, where the effective number of parties decreases from 10.63 in 1995 to 1.98 in 2012.
Figure 2.3: The Averages of the Effective Number of Parties Across Countries from 1995 to 2012
The independent variables comprise macroeconomic variables that reflect how coordination affects economic indicators. First, the export variable is considered, and its averages are shown in figure 2.4. Once again, the averages are taken for each country from 1995 to 2012.
Bangladesh has the lowest average of exports, with 14.1 per cent of GDP comprising exports. On the other end of the scale, Malaysia has the highest average, with 102.8 per cent of GDP comprising exports. The total average for the sample is 37.9 per cent.13
Next, the manufacturing variable is reviewed. Manufacturing as a per cent of GDP, which is shown in figure 2.5, is lowest in Nigeria, with 3.4 per cent, and highest in Thailand, with 33.4 per cent. The average across countries for this sample is 16.4 per cent of GDP.
13. Exports can be above 100 per cent, as seen with the case of Malaysia. This occurs when countries are exporting more than they are importing, and typically happens in small countries with high levels of productivity.
Figure 2.4: The Averages of the of Exports (as a per cent of GDP) Across Countries from 1995 to 2012
Figure 2.5: The Averages of Manufacturing (as a per cent of GDP) Across Countries from 1995 to 2012
Following the level of manufacturing, the educational measure of the primary completion rate is the next independent variable analyzed. The averages are shown in figure 2.6. The country with the lowest level of completion is Cˆote d‘Ivoire, with 47.9. Kazakhstan, on the other hand, has the highest rate of completion with 101.9 per cent14. The average across all countries is 88.6 per cent. Figure 2.6: The Averages of the Primary Education Completion Rate Across Countries from 1995 to 2012
The fourth independent variable is the unemployment rate, which is shown in figure 2.7. The coun-try with the lowest average unemployment rate during the 1995 to 2012 time frame is Thailand, with an average unemployment rate of 1.6 per cent. Macedonia has the highest unemployment rate during this period, with a rate of 33.7 per cent. The average rate across the sample is 9.2 per cent. Finally, the last independent variable used in this analysis is the market capitalization rate, shown in figure 2.8. The average of this indicator ranges from 0.1 in Azerbaijan to 178.2 in South Africa15. The average for the sample is 27.4 per cent.
14. The primary education completion rate can be higher than 100 per cent if there are late entrants, children who have repeated one or more grades, or children who have entered school early.
15. The market capitalization can be greater than 100, or greater than the GDP of a country, if the combined size and liquidity of the market value is larger than that of the GDP. An example of the liquidity of the stock market is the value of shares traded as a per cent of GDP.
Figure 2.7: The Averages of the Unemployment Rate Across Countries from 1995 to 2012
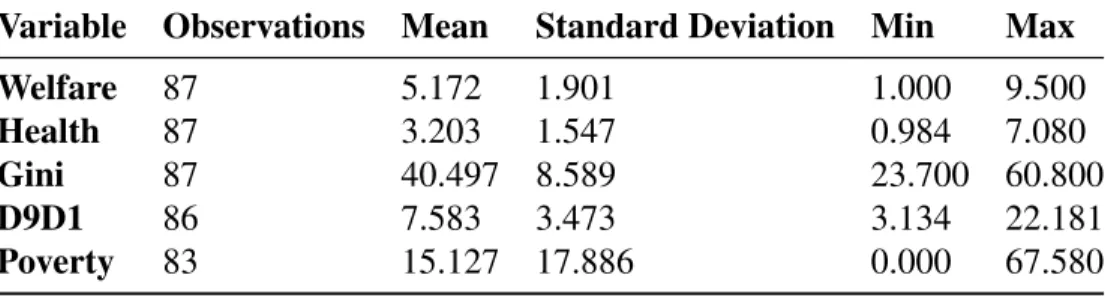
The number of observations, mean, standard deviation, minimum, and maximum of these variables are shown in table 2.1.
Table 2.1: Summary Statistics of Data
Variable Observations Mean Standard Deviation Minimum Maximim
Effnops 1,210 3.11 1.72 1.00 10.32 Export 1,274 35.61 18.68 0.34 115.11 Primary 527 82.80 21.89 17.57 111.73 Manufacture 1,183 14.63 6.43 0.69 35.06 Unemployment 1,300 9.51 7.00 0.34 36.42 Capital 700 31.13 36.32 0.19 234.09
2.4.5 Empirical Strategy
In this chapter, both a fixed effect (FE) regression and a random effect (RE) regression were run for the primary model. Only comments about the fixed effects model are made due to the empirical goals in this chapter. A FE model is used when interested in analyzing the effects of variables that vary over time because it takes out the country specific characteristics that do not vary over time in order to make an assessment of the net effect of each independent variable on the dependent va-riable. However, the results from the FE estimation and the RE estimation are largely comparable. In order to correct for a potential endogeneity problem, the primary model is improved by using a lagged five-year moving average for the independent variables. In additional to the potential endo-geneity, panel heteroskedasticity and autocorrelation are accounted for by using a panel-corrected standard error model. Finally, the model is run using the full sample and a democratic sample. Testing the model using a democratic sample is more credible, as it aligns more closely with the original literature corresponding to the advanced democracies. The specifics of the empirical stra-tegy are outlined further in the results section.
2.5
Results
The primary model for this chapter is a FE model that regresses the effective number of parties on the five macroeconomic indicators selected for this study : exports, primary education completion rate, manufacturing, the unemployment rate, and the market capitalization. The fixed effect results for the primary model are shown in table 2.2, with column one showing the results using the full sample, and column two showing the results using the democratic sample. A country is considered democratic if it scores a six or higher on the Polity IV index. In 2012, 46 out of the 65 countries considered in this chapter scored a six or higher on the Polity IV index. When considering the time period 1995 to 2012, 52 countries scored a six or higher on the Polity IV index for at least one year. In order to take into consideration that the Polity IV score may change for a country in this sample,
and drastically at that, an average of the Polity IV index is taken for each country and a separate model is run using this score as the democracy benchmark. The results are shown in appendix A. As there are significant data constraints for this set of countries, these results should be seen as a first attempt to uncover if and how the economic structure of a transitioning country impacts their electoral rule system.
Table 2.2: The determinants of the effective number of parties (FE model) Effnops(1) Effnops(2) Exports -0.032** -0.041*** (0.014) (0.015) Primary 0.041** 0.047* (0.020) (0.026) Manufacture 0.085* 0.061 (0.042) (0.042) Unemployment 0.039 0.003 (0.032) (0.028) Capital 0.002 -0.003 (0.005) (0.007) Constant -0.903 -0.322 (2.031) (2.597) Observations 686 515 R-Squared 0.138 0.199
Table 2.2 shows the regression results for the fixed effects model. The effnops is the dependent variable, standing for the effective number of parties. The first column is from only the five macroeconomic independent variables, the second column adds pr, the third column adds electionyear, and the fourth column adds overthrow The standard
errors are in parenthesis.⇤p <0.10 ;⇤⇤p <0.05 ;⇤⇤⇤p <0.01
Exportsis negative with five per cent level of significance in column one and a one per cent level of significance in column two.
The primary completion rate, primary, has a positive sign and is significant at a five per cent level in the first column and a ten per cent level in the second column. In coordinated economies, educational inequality should be minimized, and the amount of people with a primary education should be maximized. This finding aligns with the hypotheses made above.
Manufacture and unemployment are positive. Manufacture is significant at a ten per cent level when using the full sample, but not with the democratic sample. Due to the organizing quality of
coordinated economies, industrialization, for which manufacturing is a proxy, is facilitated. Indus-try requires a high level of organization and cooperation, and is thus will be stronger in economies with high levels of coordination. Unemployment is not significant in either model. Capital is posi-tive in column one and negaposi-tive in column two, but not significant.
It is argued that the economic structure influences the number of effective number of parties in a country, but one could instead consider that it is the type of electoral system that impacts the economy. To account for the potential endogeneity issue, five-year lags for the macroeconomic indicators are used to evaluate the effect of the economic structure on the proportionality of the electoral system.
A five-year lag allows enough time to see the impact of the economy on the proportionality of the electoral system, but is still short enough that it does not damage the integrity of the 18 year time frame of the study.
After accounting for a potential endogeneity problem, another issue arises. The independent va-riables change from year to year, for example, unemployment can increase or decrease by a signifi-cant percentage one year to the next. However, the effective number of parties stays stationary until the next election for each country. This means that a stationary dependent variable is often being regressed on the independent variables changing annually. To account for this, moving averages, created for each independent variable, are used. To be consistent with the previous analysis, a five-year lagged moving average is used. For example, if one considers the variable unemployment at time t, the moving average associated with it is composed of the average of unemployment of the previous five years, t-1, t-2, t-3, t-4, and t-5.
With panel data, it is often advised to work under ‘panel error assumptions’, notably that panel data is subject to panel heteroskedasticity and autocorrelation. Following the suggestion of Beck and Katz (1995), a model using panel-corrected standard errors (PCSE) corrects for these issues. The PCSE model is shown in table C.3 for the full sample, and table C.4 for the democratic sample.
The PCSE model is more appropriate for this study, as it corrects for any potential autocorrelation and heteroskedasticity.
In table C.3, column one contains the five macroeconomic independent variables, column two adds the dummy variable PR, which indicates if a country has a proportional representation system, column three adds the dummy variable electionyear, which indicates if the year in question in the times series was an election year, and finally column four adds the dummy variable overthrow, which indicates if the year in question in the time series experienced a non-democratic change of leadership. This manner of structuring the regression is used for the remainder of this chapter. In the PCSE model using the full sample, exports is negative and significant at a one per cent level for columns one and four, and five per cent level for columns two and three. The primary completion rate is, contrary to expectations, negative in second to fourth columns. Notably, it is not significant. Manufacture is positive and significant at a one per cent level across the columns. Unemploymentis positive in the first three columns and negative in the last column, but not signifi-cant. Capital is positive across the columns, but it is not significant in model two. The proportional representation dummy variable is positive, but not significant. The variable electionyear is nega-tive, but not significant. Overthrow is posinega-tive, which goes against the original prediction made in this chapter, and significant at a one per cent level.
The democratic sample, shown in table C.4, tells a slightly different picture from the full sample. The variable exports is negative and significant at a five per cent level across the columns. Primary is now positive, as predicted, and significant at a one per cent level for the first specification run, and a five per cent level for the following ones. Manufacture is also positive and significant at a one per cent level for all columns. Unemployment is negative, but only significant in column four. Capitalis negative, as predicted, and significant at a ten per cent level across all regressions run under this model with the democratic sample except for in column four.
Table 2.3: The determinants of the effective number of parties (PCSE model, full sample) Effnops (1) Effnops (2) Effnops (3) Effnops(4)
Exports -0.024*** -0.021** -0.021** -0.021*** (0.009) (0.009) (0.009) (0.008) Primary 0.004 -0.001 -0.002 -0.008 (0.014) (0.016) (0.016) (0.015) Manufacture 0.111*** 0.103*** 0.103*** 0.099*** (0.026) (0.027) (0.027) (0.025) Unemployment 0.004 0.005 0.007 -0.011 (0.020) (0.019) (0.020) (0.019) Capital 0.001 0.000 0.000 0.003 (0.009) (0.009) (0.009) (0.009) PR 0.449 0.456 0.568 (0.362) (0.359) (0.348) Electionyear -0.018 -0.111 (0.054) (0.074) Overthrow 0.023*** (0.009) Constant 2.165* 2.348** 2.383** 2.997*** (1.150) (1.133) (1.128) (1.138) Observations 293 288 288 287 R-Squared 0.3612 0.3804 0.3806 0.3852
Table C.3 shows the regression results for PCSE model using the full sample. The effnops is the dependent variable, standing for the effective number of parties. The first column is from only the five macroeconomic independent variables, the second column adds pr, the third column adds electionyear, and the fourth column adds overthrow The
standard errors are in parenthesis.⇤p <0.10 ;⇤⇤p <0.05 ;⇤⇤⇤p <0.01
this variable is the opposite of what was predicted. It could be that the non-democratic change in leadership is coming from a popular democracy movement in order to change an authoritarian ruler. This motivates strong support from a variety of different parties and classes in the country. Thus, if the year in question is a year of a successful popular revolution, it could end up being more proportional. The variable electionyear is negative and significant in column four at a ten per cent level. It was predicted that if a year happened to be an election year, there should be no effect on the proportionality of the electoral system.
It is notable that PR is not significant in this regression, as a proportional representation electoral rule system should indeed be more proportional. Using a feasible generalized least squares (FGLS) regression, shown as a robust check for the democratic sample in appendix A, the PR variable