HAL Id: hal-01625036
https://hal.archives-ouvertes.fr/hal-01625036
Submitted on 7 Nov 2018
HAL is a multi-disciplinary open access
archive for the deposit and dissemination of
sci-entific research documents, whether they are
pub-lished or not. The documents may come from
teaching and research institutions in France or
abroad, or from public or private research centers.
L’archive ouverte pluridisciplinaire HAL, est
destinée au dépôt et à la diffusion de documents
scientifiques de niveau recherche, publiés ou non,
émanant des établissements d’enseignement et de
recherche français ou étrangers, des laboratoires
publics ou privés.
Effect of hydration and thermal treatment on ceria
surface using non-intrusive techniques
Jérémy Gaillard, Laurent Venault, Rachel Calvet, Sylvie del Confetto, Nicolas
Clavier, Renaud Podor, Michaël Odorico, Jean-Luc Pellequer, Nicolas Vigier,
Philippe Moisy
To cite this version:
Jérémy Gaillard, Laurent Venault, Rachel Calvet, Sylvie del Confetto, Nicolas Clavier, et al.. Effect of
hydration and thermal treatment on ceria surface using non-intrusive techniques. Journal of Nuclear
Materials, Elsevier, 2014, 444 (1-3), p.359-367. �10.1016/j.jnucmat.2013.10.018�. �hal-01625036�
Effect of hydration and thermal treatment on ceria surface
using non-intrusive techniques
Jérémy Gaillard
a, Laurent Venault
a, Rachel Calvet
b, Sylvie Del Confetto
b, Nicolas Clavier
c,
Renaud Podor
c, Michael Odorico
d, Jean-Luc Pellequer
d, Nicolas Vigier
e, Philippe Moisy
a,⇑ aCEA, Nuclear Energy Division, Radiochemistry & Processes Department, BP17171, 30207 Bagnols sur Cèze, FrancebUniversité de Toulouse, Mines Albi, CNRS, Centre RAPSODEE, Campus Jarlard, F-81013 Albi Cedex 09, France cICSM-UMR5257 CEA/CNRS/UM2/ENSCM, Site de Marcoule Bat 426, BP17171, 30207 Bagnols sur Cèze, France dCEA, iBEB, Department of Biochemistry and Nuclear Toxicity, F-30207 Bagnols sur Cèze, France
eAREVA NC, Boîte à lettre 3448C-1, 1 Place Jean Millier, 92084 Paris La Défense, France
a b s t r a c t
The evolution of plutonium dioxide surface due to water adsorption seems to influence H2generation
through the radiolysis of adsorbed water. Surface evolution of ceria, a non-radioactive surrogate for plu-tonium dioxide, was investigated using Inverse Gas Chromatography (IGC), Raman spectroscopy, Envi-ronmental Scanning Electronic Microscopy (ESEM) and Atomic Force Microscopy (AFM). IGC highlights the complexity of ceria surface revealing three different adsorption sites on surface and indicate a surface evolution upon hydration. Thermal treatment appears to regenerate at least partially the initial surface state before hydration. IGC points out the influence of calcination temperature of ceria precursor on sur-face reactivity. The nature of sursur-face modification was investigated by Raman spectroscopy which sug-gests formation of superficial hydroxide layer. ESEM and AFM were used to study potential surface topology modification upon superficial layer formation. Cerium hydroxide forms as a superficial layer with a nanostructure differing from the one of the oxide.
1. Introduction
Plutonium dioxide is one of the end products of the PUREX process dedicated to nuclear fuel recycling. For short term storage, plutonium dioxide, the thermodynamically most stable plutonium phase, is kept in hermetically sealed steel container under atmo-spheric ambiance [1,2]. The assessment of the radiolytically induced gas generation during plutonium dioxide handling and storage is necessary for transportation and storage risk management
[2]. Plutonium dioxide is a hygroscopic material and water can ad-sorb on the surface to an extent of 2–3 wt.%[3,4]. The
a
radiolysis of the adsorbed water leads to H2generation[5–9]. The kineticsand extent of H2generation may depend on the long term surface
alteration by water and its radiolysis products. Surface alteration of plutonium dioxide has been investigated using intrusive tech-niques (microbalance, X-ray photoelectron spectroscopy, UV photo-electron spectroscopy, X-ray diffraction, X-ray absorption fine structure)[3,10–16]. The effect of water adsorption on the surface state is supposed to be minor; it requires to find techniques that modify the least possible reaction equilibria. Inverse Gas Chroma-tography (IGC), Raman spectroscopy, Environmental Scanning
Elec-tron Microscopy (ESEM) and Atomic Force Microscopy (AFM) were chosen for their non-intrusive features. Ceria was used as a model compound to investigate the ability of these techniques for the study of surface alteration by hydration. The aim is to study at first non-radioactive materials which enable us to investigate different tech-niques before implementing these techtech-niques for radioactive mate-rials. Water on oxide surfaces is both chemisorbed and physisorbed. The first layer is strongly bound to the surface (chemisorption). The first layer might be responsible for surface evolution because chemi-sorption leads to chemical bound between hydroxyl group and the surface[17,18]. On plutonium oxide surface water adsorbs in three different stages: chemisorption, quasi-chemisorption (hydrogen bound to the first layer), physisorption[3]. The chemisorbed water requires very high temperature superior to 800!C for desorption showing very strong bonding[3]. Water adsorption on ceria surface is a controversial subject since water seems to promote oxidation of non-stoichiometric surface and reduction of the stoichiometric sur-face depending on orientation and sursur-face structure[19]. Calorimet-ric measurements allows to highlight two different adsorption sites for water on the surface corresponding to a structural cerium(IV) site and oxygen vacancy site [20]. Water molecule dissociation is controversial, however dissociation looks to be promoted by surface oxygen vacancies[21]. DFT simulation of water adsorption on low
index ceria surface shows that water dissociation is
⇑ Corresponding author. Tel.: +33 4 66 79 16 11. E-mail address:[email protected](P. Moisy).
thermodynamically more favorable on reduced ceria surface[19]. The presence of oxygen vacancy increases the adsorption energy which is favorable to dissociation. Indeed the results show that sub-stoichiometric surfaces are stabilized by dissociative water adsorp-tion. The behavior of water molecules on PuO2surface is not known
as well as on CeO2surface, however PuO2surface is expected to have
a similar behavior to CeO2.
In the present study, IGC was used to study ceria surface evolu-tion during atmospheric hydraevolu-tion. IGC is a physico-chemical method dedicated to surface analysis which is based on surface energy measurement. The use of molecular probes permits non-intrusive measurement ensuring an efficient surface state investigation. Both Infinite dilution method (IGC-ID) and finite sol-ute concentration method (IGC-FC with elution characteristic point method) are applied. The finite solute concentration method was used to map surface adsorption site and especially to evaluate the surface energetic heterogeneity [22]. The infinite dilution method allowed to monitor surface evolution with hydration and thermal treatment. Although IGC is widely used for polymer sur-face characterization[23], inorganic materials have been studied like oxides[22,24,25], clays[26]or zeolites[27].
Raman spectroscopy was used to study evolution of the vibra-tional behavior of the ceria surface induced by hydration. Raman spectroscopy has already been applied to actinide oxides as ThO2,
UO2, NpO2and PuO2[28–34]. Raman spectra of CeO2show one
ma-jor vibration band corresponding to T2gmode at 465 cm!1.
Addi-tional bands corresponding to 1LO and 2LO mode can be observed at 595 cm!1and 1180 cm!1[35]. The first order LO band
scattering modes are normally forbidden in the fluorite structure. Disorders in the crystal lattice due to chemical change can lead to the apparition of these bands. Recently, the existence of 1LO band on PuO2 spectrum has been assigned to lattice defects due
to radiation damage[34]. No characteristic band is assigned to sur-face alteration by hydration. In the case of PuO2, additional bands
are observed at 2116 and 2611 cm!1 which seem to have
elec-tronic origin[34]. A potential evolution of material might be in-duced by laser beam[28]and experimental method is adapted in order to insure non-intrusive measurements.
ESEM allows to follow potential evolution of the microstructure of the oxide. ESEM enables to study surfaces in higher pressure than conventional scanning electronic microscope (SEM) and to hydrate sample in situ. Reaction equilibria are then less modified compared to ultra-high vacuum conditions. Indeed ultra-high vac-uum conditions are too intrusive to ensure the preservation of the tenuous equilibrium of hydration of the surface. ESEM using much higher pressure is equipped with a Peltier setup. It permited to control the relative humidity in the ESEM to hydrate samples in situby cooling down humid atmosphere and enables to examine potential evolution of the microstructure during hydration. AFM was applied for its capacity to discern surface topology modifica-tion at a nanometer scale[36]. AFM enables to study the surface topology at atmospheric pressure which prevents any surface evo-lution induced by low pressure environment. AFM is usually used with oxide thin films [37,38] but in our study, the preparation route precludes the formation of thin films. AFM was then applied directly on powder particles scattered on mica support.
The objective is to study the hydration of ceria surface with independent methods (IGC, Raman spectroscopy, ESEM and AFM) helping to validate these techniques for implementing on radioac-tive materials. Ceria is furthermore a classic surrogate for
pluto-nium dioxide [39]. Oxides were prepared using the same
procedure used for plutonium oxide in the PUREX process, that is to say oxalate calcination. Oxalate as precursor leads to oxide with particular features (specific surface area, porosity) [40]. Cerium oxide used in this study has characteristic close to PuO2prepared
with the same oxalate route.
2. Experimental section
All chemicals were pure grade and supplied by Sigma Aldrich. Oxalate of Ce(III) were precipitated from cerium nitrate solution adding oxalic acid. The nitrate solution (0.25 M) was stirred using magnetic stirrer while adding 0.525 M oxalic acid. Precipitation was performed under ambient temperature. The solution was fil-tered; the filtrate was washed with 1 M nitric acid solution and fi-nally washed with a mixture of ethanol/water (50/50). A first precipitation batch (batch A) led to an oxalate powder which is cal-cined under air at two different temperatures, 650!C and 800 !C, to form CeO2(mass(oxide) = 9.135 g,Table 1). The temperature ramp
was 10!C min!1 and calcination temperature was hold 5 h. The
temperature of 650!C and 800 !C were chosen to obtain an impor-tant difference of specific surface area. Calcination at 650!C leads to an oxide with a specific surface area at least two times higher than calcination at 800!C[40,41]. The batch A was dedicated to the study of surface hydration and thermal treatment by IGC. These oxides compounds were characterized using X-ray diffraction and BET specific surface area measurement. A part of the CeO2powder
was stored at room temperature under non-specific conditions (reference samples). Two samples (differenced by calcination tem-peratures) were stored in a closed vessel in order to be contacted with humid atmosphere at 80% (hydrated_1 and hydrated_2). Two hydrated samples were taken from the closed vessel and underwent thermal treatment after hydration (treated_1 and trea-ted_2). Samples were treated at 550!C during 3 h under argon and 3 h under air. Temperature was kept 100!C below calcination tem-perature. This parameter prevents reduction of surface area. A last stage was performed into air to ensure stoichiometry of the surface known to influence surface reactivity [42]. These samples (trea-ted_1 and treated_2) were stored before analysis in tightly closed vessels to prevent evolution of the surface. These samples are ref-erenced A in the Table 1. For general characterizations (Raman spectroscopy, ESEM, AFM), a second batch B of cerium oxalate was synthesized using the same procedure and calcined under air at 800!C (mass(oxide) = 39.854 g).
Besides characterization of ceria surface, cerium hydroxide were also characterized by Raman spectroscopy. Cerium(III) and cerium(IV) hydroxide were precipitated from a nitrate cerium(III) and a sulfate cerium(IV) solution by bubbling NH3. The NH3flow stream was set
up by bubbling argon in a concentrated ammoniac solution (27%). The specific surface area was measured by the BET method with a Micromeretics Gemini 2360 apparatus. The surface area of ceria samples before hydration or thermal treatment is shown inTable 1. It should be noted that this method requires thermal treatment of the sample at 350!C during 4 h. These low specific surface areas are related to the preparation method and calcination tempera-tures. The decrease of specific surface areas with the increase of calcination temperature is due to pores disappearance[40,42]. X-ray powder diffraction (with gold as standard) experiments were performed with a Bruker AXS D8 diffractometer (curved
position-sensitive detector) using Cu radiation (K
a
1 = 1.5406 Å,K
a
2 = 1.5444 Å) equipped with a LynxEye angular detector. Lattice parameters were calculated using FULLPROF software with Le Bail – full pattern matching method. Results are shown inTable 1. The diffraction patterns are in good agreement with literature showing the characteristic lines of the fluorite structure (space groupFm!3m). XRD patterns on reference CeO2 and hydrated CeO2
showed the classic pattern for CeO2 in both cases. The lattice
parameter for both samples is consistent with literature[43]. The lattice parameter is not changed over hydration of the sample. Thus, the crystalline structure of the bulk oxide is not modified during the hydration as it can be expected since X-ray penetrates at a depth (several
l
m) where hydration is not supposed to occur.Raman experiments were performed on a Horiba-Jobin Yvon Aramis apparatus equipped with an edge filter and using a green YAG (k = 532 nm) laser. The laser beam was focused on the sample using an Olympus BX 41 microscope, resulting in a spot area of about 1
l
m2. Spectra were recorded from 100 to 900 cm!1. Threedifferent locations were investigated at the surface of each sample, considering a dwell time of 60 s and 3 scans.
l
-Raman bands areas were then determined from a Gaussian fitting using the Origin 6 software. The Raman spectroscope is equipped with an LIN-RAMT-1500 heating device with a quartz window enabling mea-surement under high temperature.SEM observations were performed with a FEI Quanta 200 envi-ronmental scanning electron microscope (ESEM) using a field emission gun. ESEM is equipped with a Peltier device enabling in situhydration.
AFM experiment were performed with a commercial AFM, Mul-timode and Nanoscope V controller (Veeco, Santa Barbara, CA), mounted with an EV Scanner and antimony (n) doped silicium tips (K = 5 N/nm, Bruker). Amplitude images were recorded in tapping mode in air at the cantilever resonance frequency. The resulting images were plane-fitted and flattened with the supplied Nano-scope analysis software (Bruker).
The IGC chromatographic experiments were carried out with two Agilent 6890 gas chromatographs equipped with two flame ionization detectors (FID). Helium was used as carrier gas with a flow rate of about 30 cm3min!1measured with electronic
flowme-ter. The injector and detector temperatures were set at 170!C. Col-umns were filled with ceria in amount limiting pressure drop under 2 bars. Columns were packed using mechanical vibration along column. Ends were plugged with glass beads (a non-interact-ing material). Columns characteristics are described inTable 2. Col-umns were conditioned at 250!C overnight. At this temperature, only physisorbed water is desorbed. This latter is not expected to interfere with surface evolution (especially for hydrated and trea-ted materials). The chromatograms were treatrea-ted with the software supplied by Adscientis (France). Each experiment was repeated three times in order to determine the reproducibility of the mea-surement. Probe molecules were prepared from Sigma Aldrich ana-lytical grade products (pentane, hexane, heptane, octane and
isopropanol). Methane was bubbled in liquid sample of probe be-fore experiments for chromatographic reference.
3. IGC measurements
IGC is based on the elution of molecular probes on chromato-graphic column packed with the under-study material. Unlike the conventional gas chromatography dealing with gas separation, IGC permits characterization of the stationary phase. The elution of specific probes molecules allows to obtain useful information on the surface state. Depending on the amount of injected probe, two types of IGC may be distinguished: infinite dilution (IGC-ID) or finite solute concentration (IGC-FC).
3.1. Evaluation of surface heterogeneity
The finite solute concentration method (IGC-FC) is an experi-mental method of IGC based on the determination of desorption isotherm by inverse gas chromatography[44]. Unlike the infinite dilution method, a large amount of probe molecules is introduced and eluted on the column in order to adsorb one theoretical mono-layer of probe molecules on surface leading to a strong asymmetric peak. Since all the surface is covered by probe molecules, this method allows to obtain information about all kinds of adsorption sites on the surface. Experimentally, the oven temperature was set to 43!C ensuring a slow desorption of the probe molecules. An other criterion for oven temperature is that the contribution of the probe desorption to the total flow rate must be less than 5% of the flow rate in the absence of probe molecules (Conder crite-rion). This condition allows to assume perfect gas behavior of probe molecule vapor and to calculate partial pressure. When the signal is back to baseline, an increase of the oven temperature to 250!C was applied to evacuate the irreversibly adsorbed mole-cules on surface at 43!C.
The desorption isotherm is calculated from the chromato-graphic peak shape which is related to partial pressure of probe and surface coverage. In fact, the first derivative of the isotherm is related to the net retention time at each point of the chromato-graphic peak (Eq.(1)):
dNads dP ! "
L;tr
¼ DcðtrmRT! t0Þ ð1Þ
where for a given characteristic point, Nadsis the number of
ad-sorbed probe molecules, P is the partial pressure of the probe at the output of the column – directly related to the height of the sig-nal, tris the retention time and t0the retention time of CH4– a
mol-ecule not retained by the solid surface, Dcis the corrected flow rate,
m is the mass of the solid contained in the column.
Since the shape of the chromatographic peak is related to the interaction of the molecular probe with the surface, the isotherm includes information about the surface heterogeneity.
Table 1
Ceria samples preparation. Batch Sample Calcination
temperature
Hydration (relative humidity/ duration) Thermal treatment (temperature) Surface area (m2/ g) Lattice parameter (Å) A Reference_1 800!C – – 4.3 ± 0.2 5.4106(5) Reference_2 650!C – – 9.5 ± 0.5 5.4104(1) Hydrated_1 800!C 80%/16 days – _a Hydrated_2 650!C 80%/16 days – –a Treated_1 800!C 80%/16 days 550!C –a Treated_2 650!C 80%/16 days 550!C –a B – 800!C – – 3.4 ± 0.2 5.4109(1)
a BET measurement requires thermal treatment which might modify surface state.
Table 2
IGC column characteristics. Batch Sample Length
(cm) Diameter (mm) DP(mbar) Mass (g) A Reference_1 10 6.35 0.815 2.193 Reference_2 10 3.17 1.521 0.497 Hydrated_1 10 3.17 1.766 0.620 Hydrated_2 10 3.17 1.165 0.476 Treated_1 10 3.17 1.838 0.617 Treated_2 10 3.17 1.622 0.506 B IGC-FC 10 6.35 1.253 2.940 DP represents pressure drop at 25 !C.
The distribution function is calculated as described by Balard et al.[45]using Rudzinski–Jagiello approximation based on a mod-el assuming that the global isotherm is a sum of local isotherms corresponding to isoenergetic domains. Then the distribution func-tion is related to the proporfunc-tion of each domain on the surface.
The distribution function is calculated using the integral (Eq.
(2)):
NðPm; TmÞ ¼ N0 Zemax
emin
hð
e
; Pm; TmÞv
ðe
Þde
ð2Þwhere N(Pm,Tm) is the number of molecules adsorbed at the
pres-sure Pmand temperature Tmof measurement, N0is the number of
molecules needed for the formation of a monolayer, h (
e
, Pm, Tm) isthe local isotherm,
e
is the adsorption energy of a site, andv
(e
) is the distribution function (DF) of the sites seen by the probe. The range of adsorption energies is included between minimal (e
min)and maximal (
e
max) values.3.2. Surface monitoring by
c
dsmeasurement
Surface energy is divided in two components: a dispersive com-ponent
c
ds and a specific component
c
sps. The first one is related toLondon interactions between molecules and surface while the spe-cific component is related to spespe-cific interactions (acid–base inter-actions, polar interinter-actions, hydrogen bond, etc.). These two parameters are determined by IGC-ID respectively by injection of linear alkanes and specific probes. In this paper, only the determi-nation of the dispersive component will be described.
The infinite dilution method (IGC-ID) consists in eluting very low amount of molecular probes[44]. It prevents interactions be-tween probe molecules in the gas phase or on the surface. Experi-mentally, the oven temperature was set to 150!C. The obtained chromatogram reflects only interactions between an isolated probe molecule and the surface. This method is based on the measure-ment of the net retention volume Vnof a specific probe which is
re-lated to the interaction between the molecular probe and the surface[44]. The net retention volume leads to the calculation of the free adsorption energyDD0
a (Eq.(3)).
D
G0a¼ !RT lnðVnÞ þ C ð3Þ
where C is a constant depending on the arbitrary choice of the ref-erence state of the adsorbed molecule.
The net retention volume is calculated using a corrected flow rate of the carrier gas to take into account the drop pressure in-duced by the column.
Experimentally, the elution of a set of n-alkanes allows to plot the free adsorption energy versus the number of carbon atoms of the alkane molecule. The linear plot obtained is called the n-alkane line whose slope corresponds to the variation of the free adsorp-tion energy of one methylene group DGCH2
a . n-alkanes have the
property of developing only London interactions (as known as dis-persive interactions) with the surface. UsingDGCH2
a , one can readily
calculate the value of the dispersive component of surface energy
[46]. IGC-ID helps to follow surface evolution using the variation of dispersive component
c
d s.c
d s¼D
GCH2 a # $2 4N2 aa2CH2c
CH2 ð4Þ where Nais Avogadro’s number, aCH2 is the estimated area of oneadsorbed methylene group (0.06 nm2), and
c
CH2 is the surface
en-ergy of pure methylene group surface, i.e., polyethylene,
c
CH2¼ 35:6 þ 0:058ð293 ! TÞ, in mJ/m2 (T the temperature in K)
[24].
Since a very low amount of probes is eluted, only the most ener-getic adsorption sites mainly influence the retention times. Thus the result reflects the behavior of these particular adsorption sites which are used to testify for surface evolution. This method is cho-sen for its versatility compared to the finite solute concentration method for study evolution upon hydration.
4. Results and discussion
4.1. Evaluation of surface heterogeneity by finite solute concentration method
IGC-FC method was applied to identify different adsorption sites on ceria sample calcined at 800!C. Isopropanol appeared to have a suitable behavior for investigating ceria surface, it means respect of Conder criterion and an adsorption mainly reversible at 43!C. Alkanes were excluded because the Conder condition was not met. 1,4-Dioxane adsorption was mainly irreversible on ceria surface at low temperature. Once the suitable probe selected, one must find the probe amount to inject corresponding to one monolayer. Here, injected volume was 2.05
l
L. Experimentally, increasing quantities of probes are injected, the diffuse fronts of the chromatographic peaks are recovering themselves (see Fig. A.1, supporting information). The top of the peaks appears for lower and lower retention times until a minimum. If the in-jected amount is still increased, distorted peak shapes are obtained suggesting a multilayer adsorption (see Fig. A.1, supporting information).From the chromatogram, the desorption isotherm was calcu-lated using Eq. (1) (see Fig. A.2, supporting information) and the adsorption energy distribution function was deduced using Eq.
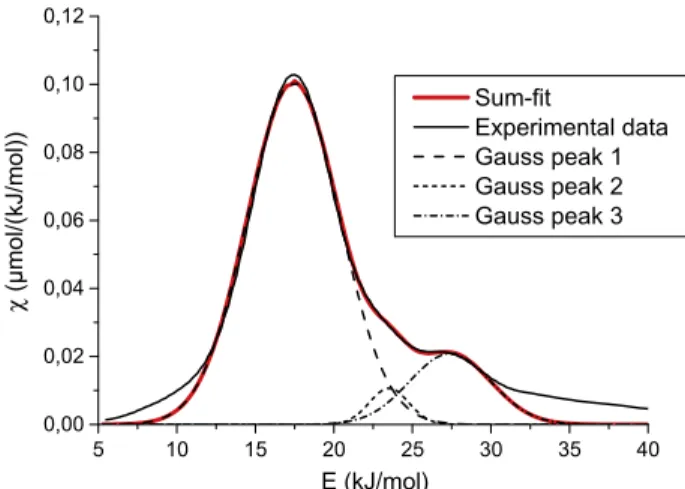
(2). The calculated adsorption energy distribution function of iso-propanol on ceria surface at 43!C is presented in theFig. 1. Curve fitting suggests three different kinds of adsorption sites as three Gaussian peaks are needed to fit the curve. The fitting parameters are described inTable 3. Fitting criterion is to require a minimum number of Gaussian peaks to properly fit the experimental curve. The first Gaussian peak is centered on 17.4 ± 0.01 kJ mol!1. This
peak corresponds to the low energy sites. The surface of the first Gaussian peak strongly suggests that the low adsorption energy sites represent the majority of the adsorption sites on the surface. Two other peaks appear at 23.5 ± 0.07 and 27.4 ± 0.08 kJ mol!1.
These two peaks are related to high adsorption energy sites. The fitting curve is not in good agreement with the experimental curve at low (under 12.5 kJ mol!1) and high (over 30 kJ mol!1) energy.
Low energy adsorption sites correspond to the first probe mole-cules eluted from the surface, i.e. the top of the chromatographic
5 10 15 20 25 30 35 40 0,00 0,02 0,04 0,06 0,08 0,10 0,12 χ ( µmol/(kJ/mol)) E (kJ/mol) Sum-fit Experimental data Gauss peak 1 Gauss peak 2 Gauss peak 3
peak. The signal recorded by gas chromatograph is then very high and sensibility of detector is altered. High energy adsorption sites refer to the last molecules eluted and the signal is very close to baseline and the noise to signal ratio is high. In these conditions, the calculation of the adsorption energy distribution function is less reliable.
Ceria surface appears to be a complex surface with a high sur-face heterogeneity including three different adsorption sites. The complex conversion to oxide from oxalate likely explains the com-plexity of the surface.
4.2. Surface characterization by
c
ds measurement
In this study, methane was used as a non-interacting reference and pentane, hexane, heptane and octane as molecular probes. The results obtained with two reference samples are shown inFig. 2
andTable 3. Probes were collected from partial pressure in equilib-rium with liquid phase alkanes. Progressively lowered amount of probes were injected until retention time became constant and peak symmetric. Examples of n-alkanes lines are given in support-ing information (Fig. A.3, supportsupport-ing information).
The dispersive component of the surface energy
c
ds decreases
from 221 ± 2 mJ m!2to 184 ± 2 mJ m!2 with the increase of the
oxalate calcination temperature. Increasing calcination tempera-ture induces the stabilization of the surface regarding molecular probes adsorption, i.e. the surface is less reactive towards molecu-lar probes adsorption as calcination temperature increases. The comparison of
c
dsvalues with literature[24,27]shows that the
sur-face is very energetic close to activated carbon and zeolite 5A ( Ta-ble 4). A previous study on ceria by Dìaz et al. gives a much lower value (27.5 mJ m!2) for the dispersive component of the surface
energy of ceria[24]. This observation might be related to prepara-tion method which is different from the present study. The prepa-ration of ceria is not described by Dìaz et al. IGC columns are filled by crushed pellets about 250–350
l
m in size. Here, samples were fine powder (granulometry &5l
m[24]) leading to a packed col-umn. The decrease of the particle size is already known in some cases for increasing thec
ds value[47] due to the appearance of
new energy sites. The chemical surface does not alone explain the
c
ds difference. Another parameter which can influence the
adsorption of the probe is the surface morphology. This latter can be affected by the oxide preparation.
A large panel of polar probes was tested to investigate polar interactions (ethanol, chloroform, acetonitrile, dichloromethane, dimethyl sulfoxide, acetone, ethyl acetate, diethyl ether, tetrahy-drofuran, dioxane, diethylamine). Polar probes were not eluted from the surface at low coverage showing a high affinity with the surface. Thermodesorption at higher temperature was needed to desorb polar probes. This result indicates an irreversible adsorp-tion of polar probes at low coverage. It demonstrates very strong polar interactions on its surface. Ceria is a well-known catalyst
[49]and then one can expect strong interactions on surface. Polar probes develop additional non-dispersive interactions with the surface leading to very strong overall interactions on the surface. It also suggests a high reactivity of surface and the feature might explain the surface high reactivity toward adsorbed water.
Cyclic alkanes and branched alkanes were also tested to inves-tigate surface roughness and topology. These probes were not eluted from the surface at 150!C showing a similar behavior to po-lar probes. This result emphasizes once more the high reactivity of the surface.
4.3. Effect of hydration investigated by inverse gas chromatography IGC at infinite dilution was used to monitor surface evolution upon hydration. Results obtained with hydrated samples are shown inFig. 2. The figure shows results for samples calcined at 800!C (hydrated_1) and 650 !C (hydrated_2). In both case, the dis-persive component of the surface energy increased with hydration.
c
dsincreased from 184 ± 2 mJ m!2to 232 ± 2 mJ m!2for sample
cal-cined at 800!C and from 221 ± 2 mJ m!2 to 240 ± 2 mJ m!2 for
sample calcined at 650!C. These observations imply that storing the samples under controlled humid atmosphere induces an evolu-tion of the surface. The effect is more noticeable on sample
cal-cined at 800!C. The surface seems more destabilized by
hydration than in the case of the sample calcined at 650!C. The destabilization is in terms of interaction between oxide surface and molecular probes. After hydration, the molecular probes inter-act more strongly with the oxide surface. It shows that different calcination temperature induces different reactivity of the oxide surface. Increasing calcination temperature leads to stabilization of surface (decrease of
c
ds) (Fig. 2) and hydration has stronger
im-pacts on high temperature calcined sample, i.e. more stable sur-face. Despite an apparent stabilization of the surface, high temperature calcination, (Fig. 2) leads to a higher reactivity toward hydration. One can propose that the evolution induced by hydra-tion is explained by the opposite mechanism explaining the stabil-ization of the surface with increasing calcination temperature. The
Table 3
Fit parameters for adsorption energy distribution function.
Peak Center (kJ mol!1) Area
Gaussian peak 1 17.4 ± 0.01 0.742 Gaussian peak 2 23.5 ± 0.07 0.033 Gaussian peak 3 27.4 ± 0.08 0.135
Pre-hydration Post-hydration Thermally treated
160 180 200 220 240 213 234 232 240 184 221 γ s d (mJ.m -2) calcined at 800°C calcined at 650°C Fig. 2.cd
s measurements on ceria surface with different treatment and different
calcination temperature (light grey: 650!C ; dark grey: 800 !C), uncertainty: ±2.
Table 4
cd
s values for different inorganic materials for reference and (pre-hydration) ceria
samples. Materials Preparation cd s (mJ m!2) Reference Alumina BASF 59.3 [27]
c-Alumina Thermal decomposition of
alum 29 [51]
a-Alumina Calcination ofc-Alumina 28 [51]
Zeolithe 5A Alltech 242.0 [27]
Activated carbon
Norit 230.3 [27]
Ceria Crushed pellets 27.5 [24]
Ceria 800!C calcined oxalate 184 ± 2 This work Ceria 650!C calcined oxalate 221 ± 2 This work
increase of the
c
ds value for the sample calcined at 650!C
(Refer-ence_2) is lower because the surface is already in a state closer to the hydrated one compared to the sample calcined at 800!C (Reference_1). The potential evolution is then lower. For the sam-ples kept under humid atmosphere during 16 days, the dispersive component of the surface energy for the sample calcined at 800!C (hydrated_1) could come equal to the dispersive component for the sample calcined at 650!C (hydrated_2). The evolution of the surface would have reached a final state corresponding to a highest value for the dispersive component of the surface energy. It has to be kept in mind that the measurements only reflect the behavior of the most energetic adsorption site. Nevertheless, these particular adsorption sites can reflect the evolution of the overall surface of the oxide. The measurement of the dispersive compo-nent only accounts for London interactions. The strong adsorption of polar probes suggests strong specific interactions. A precise description of the surface should include the specific component of the surface energy. However, the measurement of the dispersive component allows already to understand the evolution of the sur-face state with hydration and thermal treatment.
4.4. Surface regeneration by thermal treatment
The purpose was to investigate the ability to regenerate the sur-face to a reference state by thermal treatment. For the thermally treated samples, theFig. 2shows a decrease of the dispersive com-ponent of the surface energy in both case (high and low calcination temperature) induced by the thermal treatment. The decrease is 19 mJ m!2 and 6 mJ m!2 for treated_1 (800!C) and treated-2
(650!C) respectively (uncertainty = ±2 mJ m!2). The tendency is
the same for both samples although the sample calcined at 800!C seems more affected by the thermal treatment. This result confirms that the calcination temperature is a crucial parameter for surface reactivity. Comparison with the initial state before hydration shows a gap of 29 mJ m!2and 13 mJ m!2for treated_1
(800!C) and treated-2 (650 !C) respectively. The regeneration of the surface shows a higher impact on 800!C calcined sample since the decrease of
c
dsis higher. However, the final value is closer to the
initial one for the 650!C calcined sample. The calcination of oxa-late at two different temperature leads to different surface states that behave differently upon hydration as shown by
c
ds value. The
surface states of the hydrated samples are then different and the
400 420 440 460 480 500 520 540 0 2000 4000 6000 8000 0 2000 4000 6000 8000 Intensity wave number (cm-1) reference oxide Intensity hydrated oxide 465 cm-1 484 cm-1
Fig. 3. Raman spectra of hydrated sample and reference sample (using in situ furnace). 0 1000 2000 3000 4000 5000 6000 7000 8000 400 420 440 460 480 500 520 540 400 420 440 460 480 500 520 540 0 1000 2000 3000 β band 484cm-1 intensity wave number (cm-1)
(A)
thermal treatmenthydrated with humid atmosphere hydrated with liquid water
T2g band 465cm-1 β band 484cm-1 intensity
(B)
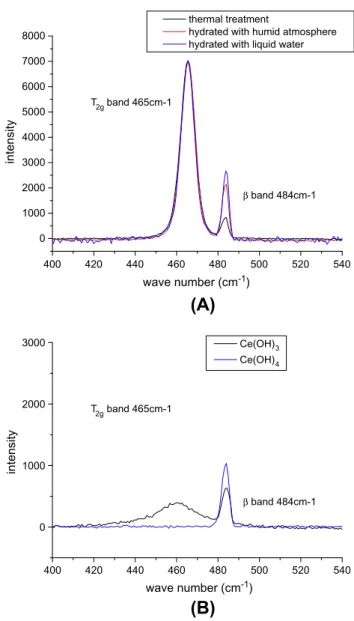
Ce(OH)3 Ce(OH)4 T2g band 465cm-1 wave number (cm-1)Fig. 4. (A) Raman spectra of sample with different preparations (thermal treatment (800!C/Air), humid atmosphere (60%–6 months), liquid water (overnight)) (nor-malized with T2gband), and (B) Raman spectra of cerium hydroxides (cerium(III)
hydroxide, cerium (IV) hydroxide).
Table 5
b/T2gband area ratio for samples with different preparation.
bT2gratio
Thermal treatment 0.06 Humid atmosphere 0.15
surfaces have not the same ability for regeneration at 550!C. This observation might be explained by the thermal treatment temper-ature. A higher temperature for thermal treatment might lead to a
c
ds value for the 800!C calcined sample closer to the initial one.
Furthermore, the
c
ds values decrease with thermal treatment but
are higher than values for the surface in the reference state (pre-hydration). The temperature of the thermal treatment might not be sufficiently high to induce a complete regeneration of the sur-face. The atmosphere during the thermal treatment is likewise a parameter that can influence the regeneration of the surface.
4.5. Investigations using
l
-Raman spectroscopyRaman spectroscopy was used to investigate apparition of addi-tional band induced by surface hydration beside T2g, 1LO and 2LO
bands. Ceria sample was treated at 800!C under static air for 2 h in in situfurnace. Sample was then cooled down to record spectrum at ambient temperature to avoid blackbody radiation disturbances. Recorded spectrum after in situ thermal treatment is presented in
Fig. 3. Spectrum shows only one band at 465 cm!1corresponding
to T2gvibration band indicating a well ordered material. No
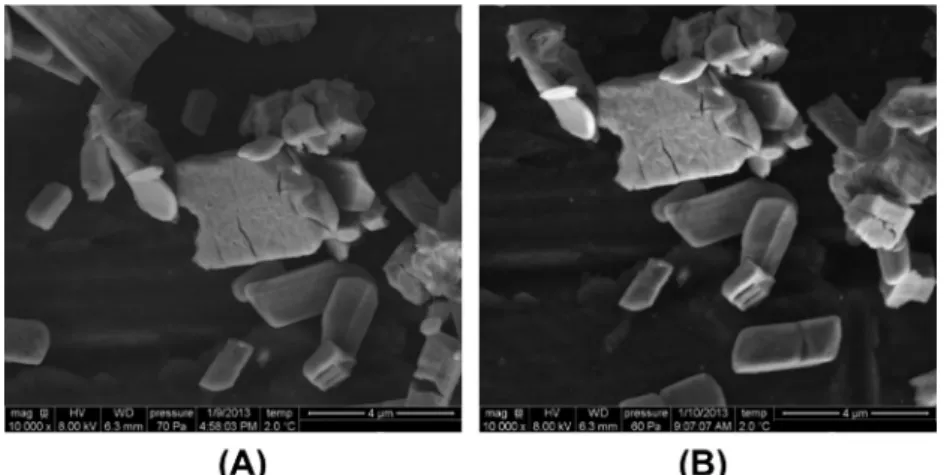
addi-Fig. 5. In situ Hydration-ESEM micrographs of the ceria samples: (A) before in situ hydration, and (B) after in situ hydration.
Fig. 6. Top: AFM amplitude images of the ceria samples and bottom: amplitude variation versus surface distance on (A) non-hydrated sample, and (B) sample hydrated with liquid water ex situ during 6 days.
tional band is observed which suggests non-crystal disorders. This result is expected for a reference sample and is in good agreement with literature[35,43,50]. In situ furnace with high temperature ensured recording of a Raman spectrum representative of a non-hydrated surface.
Detailed spectra for hydrated sample are shown inFig. 3. The spectrum for hydrated sample shows an additional band (named here b band) beside the T2gat 484 cm!1. Filters were used to
pro-vide low power laser beam (6 ' 10!3mW) to prevent any laser
in-duced surface modification. IGC measurements show that thermal treatment is able to regenerate the surface. The local heating in-duced by laser irradiation can then annealed the surface alteration by hydration. Ceria is hydrated during 2 months under 80% relative humidity. No additional bands (1LO band, 2LO band) are observed at wave number higher than 1000 cm!1for any sample. The
pres-ence of the b band suggests the modification of the surface state. To investigate the origin of this additional band, ceria was hy-drated using liquid water to induce extreme conditions and en-hanced surface evolution.Fig. 4shows the recorded spectra. For the sample hydrated with water, the b band is present and the band area ratio is higher than in the case of the samples hydrated by humid atmosphere (Table 5). This result suggests that the b band is related to ceria reaction toward water since the use of li-quid water leads to a modification of the Raman spectra of ceria.
The sample used for reference state (Fig. 3) was stored over-night under ambient conditions (normal conditions of tempera-ture, pressure and humidity) and Raman spectrum was recorded the day after (Fig. 4). Different preparations lead to the same two bands: T2gband at 465 cm!1and the b band at 484 cm!1. It appears
that the band area ratios differ with the sample preparation. The thermally treated sample shows the lowest ratio and the liquid water hydrated sample the highest one. Samples hydrated by hu-mid atmospheric atmosphere show intermediate values. This re-sult is in good agreement with conclusions drawn from IGC-ID results on regeneration of the surface by thermal treatment. Ther-mal treatment is able to reduce the ratio of the areas of the two bands, implying the regeneration of the surface toward a reference state. Since the thermally treated sample is expected to be the less hydrated one, it confirms that the additional band is explained by the hydration of the surface. However, the sample is kept under atmospheric ambiance which contains water. The additional band might be due to a rapid rehydration of the sample overnight.
To investigate the nature of the surface modification, Raman spectra of cerium(III) and cerium(IV) hydroxides were recorded in the same conditions as previous oxide samples. (Fig. 4). The two samples show the same band at 484 cm!1. The spectra confirm
the usual poor cristallinity of hydroxides. This band might be ex-plained by the vibration of Ce-OH bound on surface. This result suggests the formation of a thin hydroxide layer on the oxide sur-face. The oxidation state of cerium on the surface remains un-known since the two hydroxides spectra show the same feature at 484 cm!1. Spectrum of Ce(III) hydroxide shows a weak band
around 460 cm!1. The origin of this band remains unknown.
4.6. Evolution of surface topology: Environmental scanning electron microscopy (ESEM) and atomic force spectroscopy (AFM)
ESEM enables to hydrate sample in situ and microstructure evo-lution can be followed on specific particles.Fig. 5shows the surface evolution upon hydration of the exact same particle. Oxide sample is constituted of lamellar-shaped aggregates of micrometric size. This morphology is expected for oxide prepared by oxalate route
[47]. In situ hydration was performed at 95% relative humidity at pressure below 100 Pa. No significant change is observed on micro-graphs. The sample was dried before experiment at 800!C under static air during 10 min. ESEM experiments suggest that the
sur-face evolution takes place at a smaller scale. To perform analysis at a smaller scale, AFM technique was used. This technique permits to observe surface topology down to the nanometer scale. A non-contact method has already been applied on ceria in ultra-high
vacuum (UHV) conditions to study water adsorption on CeO2
(111) thin film[48]. UHV permits to limit water adsorption to sub-monolayer coverage. Authors were able to show adsorption of
indi-vidual water molecule on specific sites. Fig. 6 shows AFM
amplitude images of both reference surface and hydrated surfaces using tapping mode in air. Reference surface corresponds to ceria sample treated at 800!C before experiment. Hydration was ob-tained using deposition of liquid water for six days to enforce sur-face evolution. AFM images reveal an important evolution of the surface grain topology due to hydration. This observation was made on several different particles to check consistency. This result might be explained by the formation of a hydroxide superficial layer and confirms the nanometer scale of surface evolution. The measurement of amplitude variation versus distance was also re-corded. Typical result is shown in Fig. 6. The measurement was reproduced on 35 different sites on both surfaces. The result ap-pears very reproducible from one point to the other. The reference surface shows a strong interaction between the cantilever tip and surface during both approaching and retracting curves (peaks in the left curve). No particular interactions are suggested in the case of the hydrated sample. Tip-surface interaction measured by AFM force curves is completely different on non-hydrated and hydrated surfaces.
5. Conclusions
Ceria surface evolution upon hydration is studied using differ-ent techniques. Characterization of the reference surface state indi-cates a high complexity of ceria surface when prepared by oxalate calcination which is similar to plutonium oxide preparation. The fi-nite solute concentration method allows to determine the distribu-tion of adsorpdistribu-tion sites. Ceria surface shows three different types of adsorption sites for isopropanol. Inverse gas chromatography at infinite dilution gives a good insight of the surface reactivity to-ward water. The calcination temperature influences the surface reactivity regarding hydration. A thermal treatment at moderate temperature seems to regenerate at least partially the initial fea-ture of the surface. However, a higher temperafea-ture for thermal treatment could allow to induce a complete regeneration of the surface.
l
-Raman spectroscopy confirms the modification of the surface with the emergence of an additional band close to T2gvibration band upon surface hydration suggesting hydroxide superficial layer. Raman spectroscopy experiments confirm IGC re-sults: thermal treatment leads to a regeneration of the surface. ESEM and AFM show that the surface modification takes place at a nanometer scale and AFM results suggest the formation of super-ficial layer with an important evolution of surface nanostructure. PuO2surface is expected to follow a close behavior to CeO2surface.
The surface evolution upon hydration is expected to influence the radiation chemistry occurring at PuO2surface. Further experiments
are expected to better understand the modification during thermal treatment and to estimate the kinetics of surface hydration and, in the case of plutonium dioxide, to relate the generation of H2due to
radiolysis of adsorbed water to the surface modification upon adsorption.
Supporting Information
Determination of suitable probe amount in IGC-FC, Determina-tion of desorpDetermina-tion isotherm from IGC-FC chromatographic peak, IGC-ID chromatographic peak and examples of n-alcanes lines. This
material is available free of charge via the Internet at http://pub-s.acs.org/.
Acknowledgment
The authors would like to thank AREVA NC for financial support and CEA future fuel cycle back-end objectives management. References
[1]V. Onufriev, Status and Advances in MOX Fuel Technology, IAEA, 2003. [2]J.M. Haschke, T.E. Ricketts, Plutonium Dioxide Storage: Conditions for
Preparation and Handling, Las Alamos National Laboratory, 1995. [3]J.L. Stakebake, L.M. Steward, J. Colloid Interface Sci. 42 (1973) 328–333. [4]A. Benhamou, J.P. Beraud, Analusis 8 (1980) 376–380.
[5]M.V. Vladimirova, I.A. Kulikov, Radiochemistry 44 (2001) 86–90.
[6]J.M. Duffey, R.R. Livinston, Gas Generation Testing of Plutonium Dioxide, Westinghouse Savannah River Company, 2002.
[7]J.M. Duffey et al., Pressure Development in Sealed Containers with Plutonium-Bearing Materials, Savannah River National Laboratory, 2010.
[8]P.M. Almond et al., Gas Analyses From Headspace of Plutonium-Bearing Materials Containers, Savannah River National Laboratory, 2010.
[9]H.E. Sims et al., J. Nucl. Mater 437 (2013) 359–364. [10]J.L. Stakebake et al., J. Alloys Compd. 202 (1993) 251–263.
[11]J.M. Haschke, T.H. Allen, Interactions of Plutonium Dioxide with Water and Oxygen-Hydrogen Mixtures, Las Alamos National Laboratory, 1999. [12]S.D. Conradson et al., Inorg. Chem. 42 (2003) 3715–3717. [13]J.D. Farr et al., J. Nucl. Mater. 328 (2004) 124–136. [14]T. Gouder et al., J. Surf. Sci. 601 (2007) L77–L80. [15]A. Seibert et al., Radiochim. Acta 98 (2010) 647–657. [16]C. Madic, Science 287 (2000) 243–244.
[17]P.A. Thiel, T.E. Madey, Surf. Sci. Reports 7 (1987) 211–385. [18]M.A. Henderson, Surf. Sci. Reports 46 (2002) 1–308.
[19]M. Molinari et al., J. Phys. Chem. C 116 (2012) 7073–7082. [20]S. Hayun et al., J. Am. Ceram. Soc. 94 (2011) 3992–3999.
[21]D. Fernandez-Torre et al., J. Phys. Chem. C 116 (2012) 13584–13593. [22]E. Brendle et al., J. Chim. Phys. Phys.-Chim. Biol. 95 (1998) 1685–1710. [23]Y. Al-saigh Zeki, Int. J. Polym. Anal. Charact. 3 (1997) 249–291. [24]E. Díaz et al., J. Chromatogr. A 1116 (2006) 230–239. [25]E. Papirer et al., J. Mater. Sci. 35 (2000) 3573–3577.
[26]L. Boudriche et al., Colloids Surf. – Physicochem. Eng. Asp. 399 (2012) 1–10. [27]E. Diaz et al., J. Chromatogr. A 1049 (2004) 139–146.
[28]C. Jégou et al., J. Nucl. Mater. 405 (2010) 235–243. [29]C. Jégou et al., J. Nucl. Mater. 399 (2010) 68–80. [30]V.G. Keramidas, J. Chem. Phys. 59 (1973) 1561.
[31]G.M. Begun et al., J. Less Common Met. 162 (1990) 129–133. [32]J. Schoenes, J. Phys. Reports 63 (1980) 301–336.
[33]D. Manara, B. Renker, J. Nucl. Mater. 321 (2003) 233–237. [34]J.M. Sarsfield et al., J. Nucl. Mater. 427 (2012) 333–342. [35]W. Weber et al., J. Phys. Rev. B 48 (1993) 178–185. [36]G. Binnig et al., Phys. Rev. Lett. 56 (1986) 930–933.
[37]J.V. Lauritsen, M. Reichling, J. Phys. Condens. Matter 22 (2010) 263001. [38]S. Gritschneder et al., Nanotechnology 18 (2007) 044025.
[39]J.C. Marra et al., Cerium as a Surrogate in the Plutonium Immobilized Form, American Chemical Society, Washington, DC, 2006.
[40]X. Machuron-Mandard, C. Madic, J. Alloys Compd. 235 (1996) 216–224. [41]L. Claparede et al., Inorg. Chem. 50 (2011) 11702–11714.
[42]A. Badri et al., J. Chem. Soc. Faraday Trans. 92 (1996) 4669. [43]D. Horlait et al., Inorg. Chem. 50 (2011) 7150–7161.
[44]J.R. Conder, C.L. Young, Physicochemical Measurement by Gas Chromatography, Wiley, 1979.
[45]H. Balard et al., Langmuir 13 (1997) 1251–1255.
[46]G.M. Dorris, D.G. Gray, J. Colloid Interface Sci. 77 (1980) 353–362. [47]L. Claparede et al., Inorg. Chem. 50 (2011) 9059–9072.
[48]J.Y. Heng et al., Pharm. Res. 23 (2006) 1918–1927. [49]A. Trovarelli, Catal. Rev. Sci. Eng 38 (1996) 439–520. [50]C.T. Nottbohm, C. Hess, Catal. Commun. 22 (2012) 39–42. [51]C. Tisserand et al., Powder Technol. 190 (2009) 53–58.