DOPPLER FLOW DETERMINATION
A. VIELI
In contrast to the more established methods for blood flow determination, the standard ultrasound procedures are non-invasive. Having become relatively easy to use with the advent of duplex-type combinations of imaging devices and Dop-pler instruments, they have gained considerable interest over the recent years. As with all quanti-tative procedures, the basic question refers to the accuracy of the diagnostic information provided.
The present paper concentrates on the measure-ment of blood volume flow rate by means of conventional (not two-dimensional colour map-ped) Doppler ultrasound. After summarizing the fundamental principles of Doppler flow assess-ment, it deals with the question of accuracy from the points of view both of clinical results and of basic physical problems.
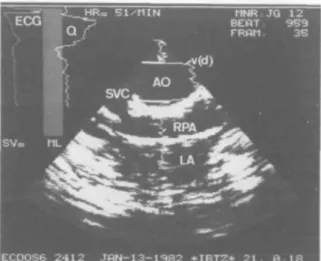
BASIC PRINCIPLES OF DOPPLER ULTRASOUND Figure 1 shows an example of the on-line information a duplex-system can provide to the user. In an overlay on top of a conventional sector scan echogram, local blood flow velocities are indicated as horizontal deflections of a vertical line. From these local velocity measurements the computer determines a volume flow curve. In principle, integrating this flow curve over the cardiac cycle yields the stroke volume (SV). In this example the numerical value for the stroke volume is suppressed because its absolute accur-acy was not considered adequate.
Conventionally, stroke volume is determined by multiplying the cross-sectional area of the aorta by the velocity of the erythrocytes present in this cross-section (fig. 2). The cross-sectional area is measured by conventional echography, while the velocity of the erythrocytes is estimated from the Doppler shift in an ultrasonic echo signal. A pulsed Doppler system relates the
AUGUST VIELI, PH.D., Institute of Biomedical Engineering,
University and Federal Institute of Technology, Mousson-strasse 18, CH-8044 Zurich, Switzerland.
FIG. 1. Duplex Information of a Doppler-echocardiography system. The display combines the structural image (AO = aorta; RPA = right pulmonary artery; SVC = superior vena cava; LA = left atrium) with velocity information as a func-tion of depth along the central fan beam (v(d)). The magni-tude of the measured velocity is indicated by the horizontal deviation of the v(d) curve from a straight vertical line. In the upper left corner a computed volume flow tracing (Q) is plotted in parallel with the ECG with the time running from top to bottom. (Annotations not mentioned describe
measure-ment conditions irrelevant in this context.)
Q =
FIG. 2. Basic procedure for the determination of the flow rate. The flow rate Q in a vessel can be obtained by multi-plying the cross-sectional area A by the velocity v of the blood contained in this cross-section. The two quantities to
be measured are thus A and v.
change in the echo delay between successive bursts to a corresponding change in the distance between the transducer and a reflector. Thus, only axial displacements of the reflector give rise to a Doppler signal, while radial components of the velocity go undetected. This effect is usually
108S BRITISH JOURNAL OF ANAESTHESIA
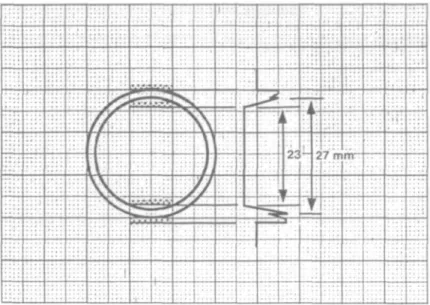
FIG. 3. Ultrasonic pulse dimensions. This Schlieren-photograph visualizes an ultrasound pulse at different dis-tances from the transducer (T). The size of the bright spots imaging the transmitted pulse can be considered typical for a modern phased array scanner. As indicated by the scale on the left, the lateral width of a pulse is of the order of 1 cm, whereas the axial length is of the order of 2 mm. The vari-ation of the lateral dimensions with depth corresponds to
focusing at about 7 cm from the transducer.
compensated for by dividing the measured vel-ocity by the cosine of the angle of incidence. As a consequence it is necessary to measure not only the Doppler shift, but also the angle between the ultrasound beam and the local velocity vector.
Spatial resolution of an ultrasound system has an essential impact on the accuracy of both the echographic measurement of the cross-sectional area and the velocity determination. As indicated in figure 3, typical ultrasound pulses exhibit lateral widths of the order of 1 cm and axial dimensions of a few millimetres. The shapes of the pulses may vary with space, the instrument utilized and the mode in which it operates. It should be noticed, however, that the lower limit of the beam width in today's equipment is of the order of several millimetres and, as such does not permit a very high resolution. On the other hand, the upper limit of resolution is considerably less than the diameter of the adult aorta, so that the cross-sectional average velocity is usually esti-mated on the basis of restricted samples only.
Three different data acquisition modalities are available for Doppler measurements. Figure 1
shows the display of a multigate system. This type of equipment probes the local velocities at multiple locations along the ultrasound beam to provide a spatial velocity profile. By contrast, a single channel device measures the velocity at one given depth range only, but the length of its sample volume can usually be adjusted by the operator. The output of this modality is com-monly given by a velocity spectrum as a function of time plus additional curves indicating the instantaneous mean or maximum velocity, or both. Both pulsed varieties are limited in high velocity applications. If the reflector moves faster than a certain limit, the relative delay increment of successive pulse echos is so large that it can no longer be determined unambiguously. This effect is called aliasing. The third modality is continuous wave Doppler which requires twin transducers, one to transmit permanently and the other to receive permanently. At the cost of losing range resolution, continuous wave instruments over-come the aliasing problems associated with pulsed systems.
REVIEW OF CLINICAL RESULTS
A review of the literature [2] has shown that there are a number of studies comparing ultrasound data with quantitative measurements of cardiac output. The results reported are generally good or excellent for measurements in the aorta, only slightly worse for those in the mitral valve area and somewhat worse for those in the pulmonary artery. For the present paper, data from 20 studies [5-24] (special reference list) were con-sidered, which comply with the following require-ments: they compare various types of Doppler measurements with invasive results; they report absolute results for flow; and the measurements are made in the aorta. The correlations of Doppler
v. invasive methods such as Fick, indicator
dilution, electromagnetic flowmetry or volumetric measurements by beaker and stopwatch are sum-marized in figure 4. The results are grouped according to the subjects evaluated. Correlation worsens from phantoms to animal models to children and finally to adult patients. Moreover, as most of the studies excluded patients with disorders of the left ventricular outflow tract or the aortic valves, it must be anticipated that the correlation for unselected patients would be even worse.
Correlations Doppler flow v. invasive 1.0 0.96-j 0.96-j 0.92r o •8 0 . 8 8
-I
I
0.84
u 0.80h 0.76; ' ' '
'JJ' ' '
" " I I 1 I I I I I I 1 1 1 1 , , , 1 1 1 1 1 M M 1 1 1 1 M M 1 1 1 1 1 1 Phantoms Animals 2 6 Children 2 Adults 15FIG. 4. Overview of clinical results. Correlations of volume flow measurements in the aorta between Doppler procedures and different invasive techniques based on papers of 20 authors [5-24]. The distributions of the coefficients of correlation are presented as boxes extending upwards and downwards from the median line to include 50 % of the samples of each group. The vertical lines cover the remaining range of reported values. The groups as well as their number of correlation coefficients are given at the
bottom of the figure.
When interpreting these comparisons, one should keep in mind that the established invasive "gold standards" may not always be so golden [3].
The above results provide only part of the information necessary to investigate the accuracy of Doppler methods. In order to be able to assess the value of the measurement in a given patient, it is important to understand the basic mechanisms which lead to erroneous results.
FUNDAMENTAL SOURCES OF ERROR
As mentioned earlier, three quantities must be measured for the calculation of flow rate, namely the angle of incidence, the cross-sectional area of the vessel, and the mean transluminal blood flow velocity. Each of these is associated with a potential error.
In a clinical situation the angle of incidence relative to a three-dimensional vascular structure is not easily estimated from a two-dimensional echogram. According to the shape of the cosine function, the error with regard to the flow
measurement varies only from 0 to —6% when the angle between the ultrasound beam and the velocity vector is in the range — 20° to + 20°, but at a nominal angle of incidence of 45° a deviation of ± 20° leads to flow errors between — 40 % and
+ 28 %. An additional angular problem can result from non-laminar flow conditions which are likely to occur behind an obstruction. In these cases the local velocity vector is not necessarily parallel to the vessel wall and can therefore not be fully assessed with the aid of the echogram.
A fundamental problem in the determination of the cross-sectional area is the fact that this area is commonly computed from the echographically measured vessel radius. By squaring the radius one squares the error as well. Such an inaccuracy can occur as a consequence of the limited spatial resolution of the ultrasound equipment. Under realistic assumption, the area error may be of the order of ± 10 to 20% (fig. 5). As the vessel walls are somewhat elastic, the cyclic variations of the vascular diameter resulting from pressure changes should also be taken into account. Furthermore, in veins or obstructed arteries the luminal shape
110S BRITISH JOURNAL OF ANAESTHESIA
T
TV* • • » *s
....
•
to — J • 27 n mr-Trr " ' ] . , . .FIG. 5. Errors in the diameter measurement attributable to finite pulse dimensions. Because of the finite pulse dimensions, a gradual transition occurs when the ultrasound pulse (shaded with dots) enters or leaves the vessel walls. The essential features of the variation of the echo as a function of depth are depicted on the right. Depending on the machine settings, the apparent internal diameter can vary from 23 to 27 cm in this simplified example. This 15% variation yields a 33% uncertainty for the
cross-sectional area.
FIG. 6. Site dependence of velocity tracings. This example recorded in a patient with severe aortic insufficiency shows the velocity, v, as a function of time t as recorded simul-taneously at five different locations across the aortic
lumen.
may deviate considerably from the circle com-monly assumed for the area calculation.
Figure 6 illustrates the irregular transvascular velocity distribution observed in a patient with severe aortic insufficiency. Depending on the site
at which the velocity is sampled, one can record either considerable retrograde flow or a fairly normal pattern. In such patients with highly irregular velocity distributions, the measurements become strongly dependent on the size and the
Flow proximal and distal of stenosis -5cm 0 3cm5cm 13-mmtube Selective:30.0 Global: 30.5 Qs.opwa,ch30.9mls-1 70 25 (mis'1) 35 33 (mis'1)
FIG. 7. Effect of an artificial obstruction. For this experiment an obstruction was created within a rigid tube in a fluid mech-anical bench model. The volume flow rate of bovine blood pumped through the tube was determined by beaker and stop-watch as well as by Doppler ultrasound. Two different Dop-pler modalities were applied at three different sites. The global modality had a wide pulse covering the entire lumen of the tube and the conventional multigate procedure (selec-tive) involved a narrow beam. The resulting volume flow
position of the sample volume. A phantom experiment documented in figure 7 shows that errors of the order of 100 % can occur in extreme cases if the velocities are merely sampled along a relatively narrow beam as usual. By contrast, an experimental wide beam covering the entire vessel keeps the error within 20% bounds under the same haemodynamic conditions.
From the above considerations errors up to 100% cannot be excluded in an individual measurement with the equipment of today, es-pecially if the person utilizing the method is not aware of adverse measurement conditions.
DISCUSSION AND CONCLUSIONS
The considerable discrepancy between the serious worst case errors anticipated from basic measure-ment problems and the good correlations reported clinically require some further elucidation. First, one should keep in mind that some cardiac patients exhibit almost normal velocity distri-butions [4]. In these patients, usually without major disorders in the region of the measurement site, the errors are far below the worst-case numbers. Second, coefficients of correlation are average values. They do not give a clear indication as to the worst measurement, which can be estimated from the plots given in some references as being associated with a discrepancy in excess of 50 %. Moreover, in some of the studies the cardiac output range covered extends beyond the usual limits as a result of medication. This usually improves the r value, but may not be rep-resentative for a general patient population [1].
Thus the following conclusions can be drawn: (1) with the equipment available today, reliable cardiac flow measurements having an absolute accuracy of 10-20% can be obtained only in specific groups of patients; (2) the Doppler procedure must be carefully selected to take account of the haemodynamic condition of the patient; (3) the quality of the results can be improved by orienting the beam directions paral-lel to the flow and by directly assessing the cross-sectional area instead of the vascular diameter. Equipment optimized to quantify the instan-taneous mean velocity of the entire vascular cross-section is being developed to alleviate the problem of probing irregular flow distributions. Never-theless, whenever feasible, multiple independent measurements should be averaged to reduce the uncertainty of the result.
SUMMARY
Doppler ultrasound provides a non-invasive alter-native to the established methods of blood flow measurement. The standard principle of the Doppler-echographic determination of volume flow rate is based upon the assessment of three quantities: the vascular cross-section, the angle of incidence of the ultrasound relative to the direc-tion of the velocity vector, and the cross-sectional average velocity. In the literature report-ing comparisons between Doppler and invasive cardiac output measurements, correlation coef-ficients ranging from 0.8 to 0.95 are given for adult patients. Error limits of less than 20 % for individual measurements, however, require a skilful investigator, a high quality instrument, and an appropriate subject. From a technical point of view, the highest accuracy is achieved by directing the ultrasound beam parallel to the flow, by measuring the true cross-sectional area instead of the diameter, and in the presence of well-behaved transluminal blood velocity distributions.
ACKNOWLEDGEMENT
This work was supported by the Swiss National Science Foundation under grant number 4.890-0.85.18 (NFP 18)
REFERENCES
1. Diebold B, Peronneau P, Essiambre R, Delouche A. Velocity profiles in the aortic arch and Doppler determi-nation of cardiac output: The normal and the pathological. In: Spencer NP, ed. Cardiac Doppler Diagnosis, vol. II. Dordrecht, Boston, Lancaster: Martinus Nijhoff Pub-lishers, 1986; 63.
2. Jenni R, Pfluger N. Doppler evaluation of cardiac output (literature review). Echocardiography 1988; (in press). 3. Schuster AH, Nanda NC. Doppler echocardiographic
measurement of cardiac output: Comparison with a non-golden standard. American Journal of Cardiology 1984; 53: 257-259.
4. Vieli A, Jenni R, Moser U, Casty M, Anliker M. Doppler-sonographische Erfassung der mittleren Blut-flussgeschwindigkeit in der aufsteigenden Aorta: Proble-matik und mogliche Losung. Ultraschall in der Medizin
1987; 8: 64-69.
SPECIAL REFERENCE LIST (Correlation coefficients for figure 4)
5. Alverson DC, Eldridge M, Dillon T, et al. Journal of
Pediatrics 1982; 101: 46-50.
6. Chandraratna PA, Nanna M, McKay C, et al. American
Journal of Cardiology 1984; 53: 234-237.
7. Fisher DC, Sahn DJ, Friedman MJ, et al. Circulation 1983; 67: 370-376.
8. Fisher DC, Sahn DJ, Freidman MJ, et al. Circulation 1983; 67.872-877.
112S BRITISH JOURNAL OF ANAESTHESIA
9. Goldberg SJ, Sahn DJ, Allen HD, et al. American
Journal of Cardiology 1982; 50: 1394-1400.
10. Huntsmann LL, Stewart DK, Barnes SR. Circulation 1983; 67: 593-602.
11. Ihlen H, Myre E, Amlie JP, et al. British Heart Journal 1985; 54: 378-383.
12. Keagy BA, Lucas CL, Hsiao HS, Wilcox BR. Journal of
Ultrasound in Medicine 1983; 2: 357-362.
13. Lang-Jensen T, Berning J, Jacobsen E. Acta
Anaes-thesiologica Scandinavica 1983; 27: 454-457.
14. Levy BI, Pay en DM, Tedgui A, et al. Ultrasound in
Medicine and Biology 1985; 11: 841-849.
15. McLennan FM, Haites NE, Mackenzie JD, et al. British
Heart Journal 1986; 55: 25-31.
16. Magnin PA, Stewart JA, Myers S, et al. Circulation, 1981; 63: 388-392.
17. Matre K, Segadal L, Engedal H. Journal of Biomedical
Engineering 1985; 7: 84-88.
18. Nakamura T, Hayashi K, Taenaka Y, et al. Medical and
Biological Engineering and Computing 1986; 14: 235-245.
19. Nishimura RA, Callahan MJ, Schaff HV, et al. (1984).
Mayo Clinic Proceedings 1984; 59: 484-489.
20. Ohsumi H, Okumura F. Japanese Journal of
Anes-thesiology 1985; 34: 1074-1078.
21. Rose JS, Nanna M, Rahimtoola SH, et al. American
Journal of Cardiology 1984, 54: 1099-1101.
22. Smith HJ, Grottum P, Simonsen S. Acta Radiologica :
Diagnosis 1985: 26: 257-263.
23. Stewart WJ, Jiang L, Mich R, et al. Journal of the
American College of Cardiologists 1985; 6: 653-662.
24. Vandenbogaerde JF, Scheldewaert RG, Rijckaert DL, et al. Critical Care Medicine 1986; 14: 294-297.

![FIG. 4. Overview of clinical results. Correlations of volume flow measurements in the aorta between Doppler procedures and different invasive techniques based on papers of 20 authors [5-24]](https://thumb-eu.123doks.com/thumbv2/123doknet/14920824.662854/3.774.178.551.92.436/overview-clinical-correlations-measurements-doppler-procedures-different-techniques.webp)