Data Mining Techniques for Large-Scale Gene
Expression Analysis
by
Nathan Patrick Palmer
21
L '
Submitted to the Department of Electrical Engineering and
Computer Science
in partial fulfillment of the requirements for the degree of
Doctor of Philosophy
at the
MASSACHUSETTS INSTITUTE OF TECHNOLOGY
ARCHIVES
September 2011
@
Massachusetts Institute of Technology 2011.
/V:
All rights reserved.
/7
Author... .
Department of Electrical
... ...
Engineering an
o
uter Science
August 31, 2011
C ertified by ...
...
Dr. Bonnie Berger
Professor of Applied Mathematics and Computer Science
Thesis Supervisor
Accepted by...
.f Q
es
..
A.
K..
o d i..
.
Ibrof)sLeslie A. Kolodziejski.
Chairman, Department Committee on Graduate Students
Data Mining Techniques for Large-Scale Gene Expression
Analysis
by
Nathan Patrick Palmer
Submitted to the Department of Electrical Engineering and Computer Science on August 31, 2011, in partial fulfillment of the
requirements for the degree of Doctor of Philosophy
Abstract
Modern computational biology is awash in large-scale data mining problems. Several high-throughput technologies have been developed that enable us, with relative ease and little expense, to evaluate the coordinated expression levels of tens of thousands of genes, evaluate hundreds of thousands of single-nucleotide polymorphisms, and sequence individual genomes. The data produced by these assays has provided the research and commercial communities with the opportunity to derive improved clini-cal prognostic indicators, as well as develop an understanding, at the molecular level, of the systemic underpinnings of a variety of diseases.
Aside from the statistical methods used to evaluate these assays, another, more subtle challenge is emerging. Despite the explosive growth in the amount of data being generated and submitted to the various publicly available data repositories, very little attention has been paid to managing the phenotypic characterization of their samples (i.e., managing class labels in a controlled fashion). If sense is to be made of the underlying assay data, the samples' descriptive metadata must first be standardized in a machine-readable format.
In this thesis, we explore these issues, specifically within the context of curat-ing and analyzcurat-ing a large DNA microarray database. We address three main chal-lenges. First, we acquire a large subset of a publicly available microarray repository and develop a principled method for extracting phenotype information from free-text sample labels, then use that information to generate an index of the sample's medically-relevant annotation. The indexing method we develop, Concordia, in-corporates pre-existing expert knowledge relating to the hierarchical relationships
between medical terms, allowing queries of arbitrary specificity to be efficiently an-swered. Second, we describe a highly flexible approach to answering the question: "Given a previously unseen gene expression sample, how can we compute its sim-ilarity to all of the labeled samples in our database, and how can we utilize those similarity scores to predict the phenotype of the new sample?" Third, we describe a method for identifying phenotype-specific transcriptional profiles within the context of this database, and explore a method for measuring the relative strength of those signatures across the rest of the database, allowing us to identify molecular signa-tures that are shared across various tissues ad diseases. These shared fingerprints may form a quantitative basis for optimal therapy selection and drug repositioning for a variety of diseases.
Thesis Supervisor: Dr. Bonnie Berger
Acknowledgments
The author would like to thank Dr. Bonnie Berger and Dr. Isaac Kohane for many years of thoughtful guidance and support. He would also like to thank his close collaborator, Patrick Schmid, for an enduring friendship forged over many cups of coffee and shared research interests. Finally, he would like to thank his loving parents and brother, and especially his wife, Kaitlyn, whose patience and support made this thesis work possible.
Contents
1 Introduction 17
1.1 M icroarrays . . . . 18
1.2 Thesis Overview . . . . 20
2 Concordia: A UMLS-based Index of Free-text Documents 21 2.1 Designing an ontology-based indexing system . . . . 23
2.1.1 Resolving multiple synonymous terms to unified concepts . . . 24
2.1.2 Mapping documents and queries onto UMLS ontology of med-ical concepts . . . . 25
2.2 Concordia implementation details . . . . 28
2.3 Applications of Concordia . . . . 32
3 Making NCBI's Gene Expression Omnibus Machine Readable with Concordia 33 3.1 Motivation... . . . . . . . . . . . . 33
3.2 M etadata . ... ... .. .. ... .. .. .. . . . . .. . . .. . . 34
3.2.1 Generating high-confidence phenotype labelings . . . . 35
4 Mapping the Transcriptional State Space of Cell Identity 40
4.1 Background and biological motivation . . . . 41
4.2 Multi-resolution analysis of human transcriptional state space . . . . 43
4.3 Predicting phenotype with the Concordia GEO database . . . . 51
4.3.1 UMLS concept enrichment score calculation . . . . 52
4.3.2 Quantifying performance of the enrichment strategy . . . . 55
4.4 A discussion on "batch effects"... . . . . . . . . 60
4.5 Using the Concordia-based phenotype enrichment statistics to identify the primary site of tumor metastases . . . . 64
4.6 Im plications . . . . 68
5 Core Stem Cell Transcriptional Activity and Cancer Signatures 70 5.1 Biological overview and motivation . . . . 71
5.2 Identifying a stem cell gene set . . . . 74
5.3 ES-like signature stratifies a diverse expression database by pluripo-tentiality and malignancy . . . . 86
5.4 ES-like signature stratifies tumor grade . . . . 88
5.5 Characterizing the functional diversity of the stem cell gene set . . . 89
5.5.1 SCGS genes represented in the Figure 5-4 . . . . 90
5.6 Implications of the stem cell gene set . . . . 93
6 Concluding Remarks 96 6.1 Future W ork . . . . 97
6.1.1 Expanding the expression database . . . . 97
6.1.2 Therapeutic compound expression profiles . . . . 98
6.1.4 Monitoring disease outbreak . . . . 99
7 Supplemental Tables 100
7.1 GEO Samples in the Concordia database . . . 100 7.2 T ables . . . 117
List of Figures
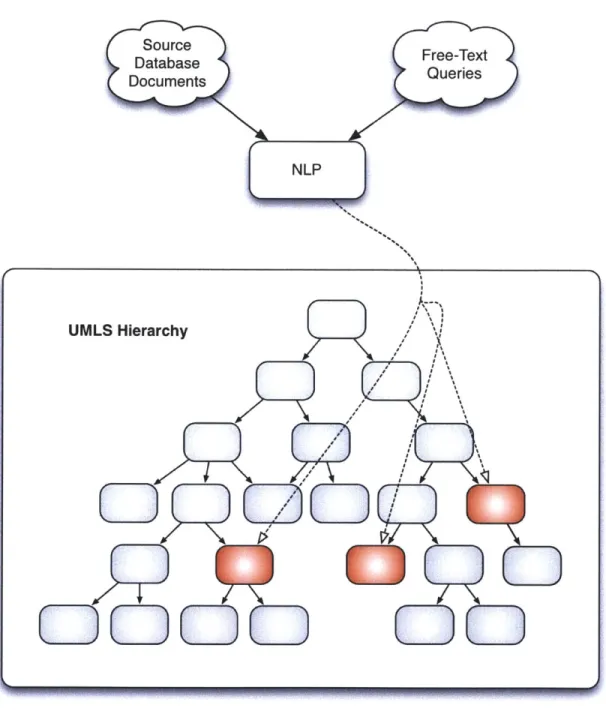
2-1 Free text source documents are processed with NLP software that maps them to unified medical concepts. Queries against those docu-ments are similarly processed with NLP, reducing the query procedure to matching concepts from the query string against the standardized
database. ... ... 27
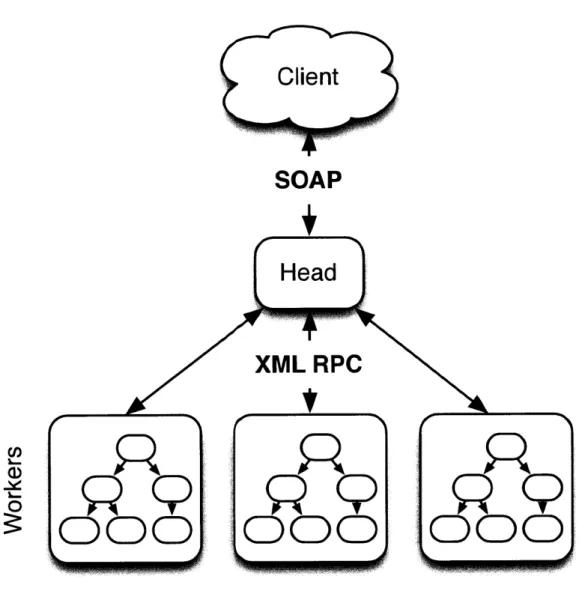
2-2 The Concordia APIs enable naive data federation to support both fault tolerance and improved total throughput. A query node serves as an intermediary between the client applications and the data-storing nodes that each run a separate Concordia instance. That is, each data-storing "worker" node is responsible for data-storing a specific subset of the total database. The query node processes client requests and requests that each worker node process the portion of the query representing the data that it is responsible for managing. Each worker node returns its portion of the response, and the multiple worker responses are aggregated at the query node, where they are assembled to be returned to the client application. . . . . 31
3-1 A screen shot of the software designed to allow manual validation of the Concordia-derived UMLS annotation. On the extreme left-hand side of the interface, there is a list of the GEO samples in the database, grouped by GEO series. The user may select one of these, populating the remaining fields on the form. the next column to the right contains the GEO fields derived from the sample's associated series. To the right of that are the fields derived from the samples' associated data sets. To the right of the data set entries are the fields derived from the sample-level annotations. At the bottom of each column, a list of check-boxes allows the user to manually validate the UMLS concepts associated with various text fragments. . . . . 38
4-1 Multi-resolution analysis of the gene expression landscape. (A) The gene expression landscape, as represented by the first two principal components of the expression values of 3030 microarray samples sep-arates into three distinct clusters: blood, brain, and soft tissue. The shading of the regions corresponds to the amount of data located in that particular region of the landscape such that the darker the color, the more data exists at that location. Interestingly, the area where the soft tissue intersects the blood tissue corresponds to bone marrow samples, and where it intersects the brain tissue, mostly corresponds to spinal cord tissue samples. (B) There is a clear separation of geni-tourinary tissue samples and gastrointestinal samples in the soft tissue cluster. (C) A closer examination of the genitourinary and gastroin-testinal sub-clusters shows clear localization of phenotypes. (D) Can-cerous tissue samples show greater variance in their expression signals while still remaining proximal to their non-cancerous counterparts. . . 45 4-2 Expression intensity distribution of the top 20 overexpressed soft tissue
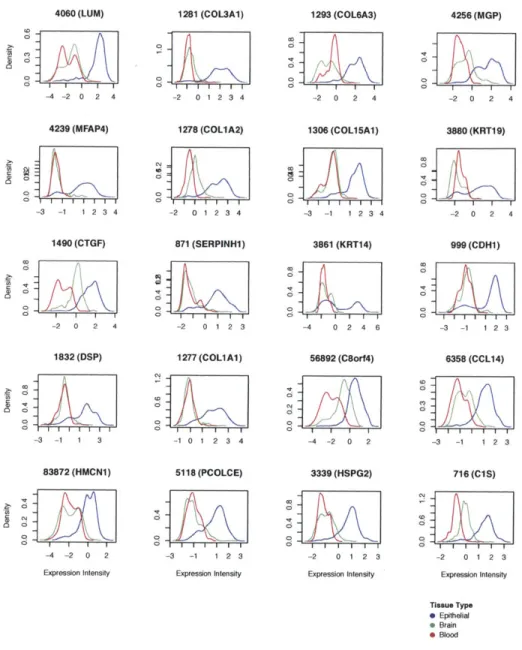
genes. Each plot corresponds to the kernel density estimate of expres-sion values for the gene named above each plot for the three broad tissue types, blood, brain, and soft tissue. We see that the expression values of soft tissue specific genes such as COL3A1, COL6A3, KRT19, KRT14, and CADH1 are markedly higher in samples corresponding to soft tissues than in samples of the other two types. . . . . 47
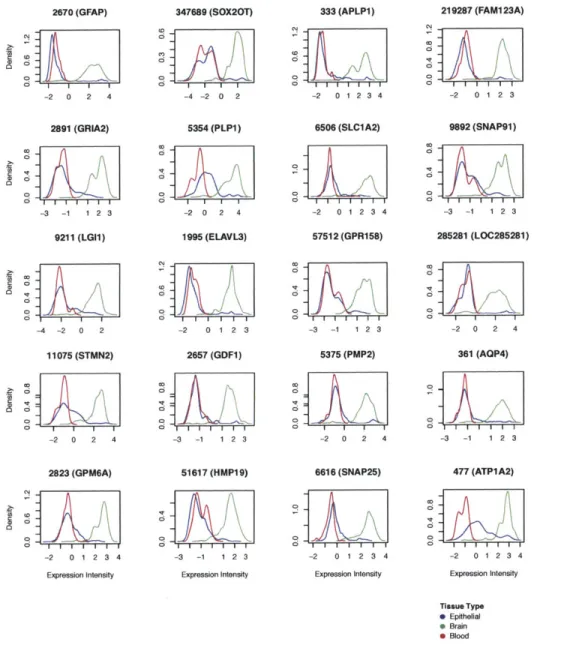
4-3 Expression intensity distribution of the top 20 overexpressed brain tissue genes. Each plot corresponds to the kernel density estimate of expression values for the gene named above each plot for the three broad tissue types, blood, brain, and soft tissue. We see that the ex-pression values of brain specific genes such as GFAP, APLP1, GRIA2, PLP1, and SLC1A2 are markedly higher in samples corresponding to brain tissue than in samples of the other two types. . . . . 48 4-4 Expression intensity distribution of the top 20 overexpressed blood
genes. Each plot corresponds to the kernel density estimate of expres-sion values for the gene named above each plot for the three broad tissue types, blood, brain, and soft tissue. We see that that the ex-pression value of brain specific genes such as HBM, PPBP, VNN2, SELL, and NFE2 are markedly higher in samples corresponding to blood than in samples of the other two types. . . . . 49 4-5 A user submits a gene expression profile to the database that then
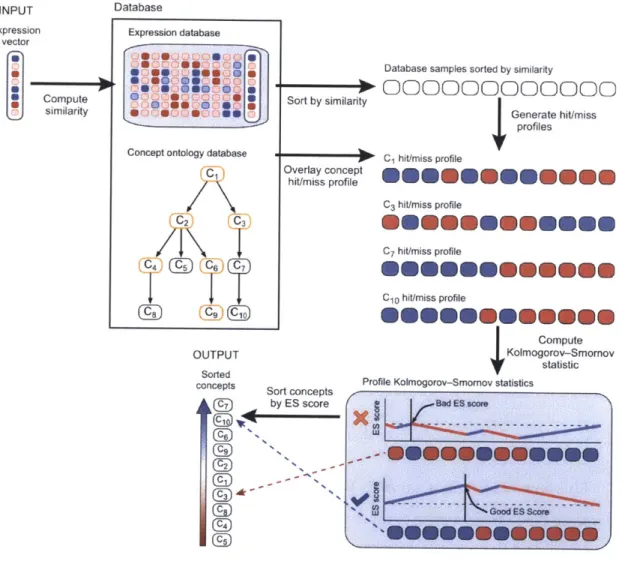
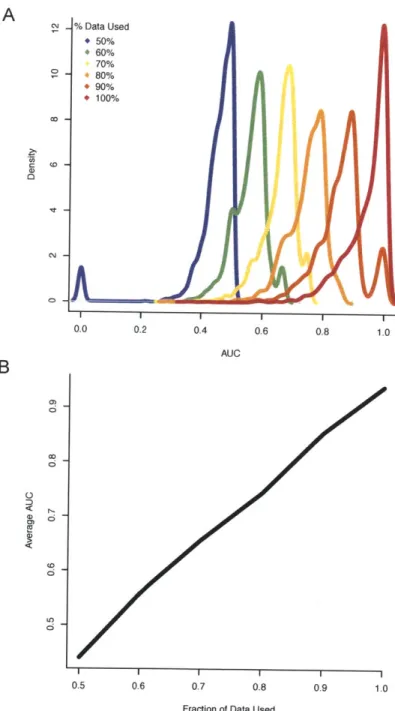
computes the similarity to all other samples in the database. Based on the similarity, an enrichment score is computed for each UMLS concept for which data exists in the database and the concepts are returned to the user in order of statistical significance. . . . . 54 4-6 Improvement of accuracy of the enrichment statistic with the increase
of data in the database. (A) Density estimate of the performance of the method over various amounts of data. (B) The average AUC values over all concepts when varying the amount of data used to compute the enrichment scores. For example, when using only 50% of
4-7 The ROC curve for leukemia depicts a lack of batch effect. The colors plotted along the curve correspond to the series of origin for each of the samples used to generate the curve. The intermingling of series points to the robustness of the phenotypic signal: samples with the same phenotype cluster together before all other phenotypes, and samples from different data series are intermingled within a phenotype. . . . . 61 4-8 Principal component analysis shows that metastatic samples more
closely resemble their primary sites. Along with the concept enrich-ment, the first two principal components of the gene expression data show that the gene expression signature of tumor metastases more closely resembles that of their primary site location than that of their metastasized sties. (A) Breast tumors that metastasized to the lung, brain, and bone still appear to be more closely related to other breast samples than to their metastasis sites. (B) Colon tumors that metas-tasized to the liver lie proximal to colon tissue and are enriched for concepts such as Rectum and sigmoid colon and Colon carcinoma. (C) While we were not able to correctly identify the exact primary site location, the lung adenocarcinoma samples that metastasized to the brain look nothing like brain tissue that is located in the top right cluster (see Figure 1). (D) In the context of the entire transcriptome landscape, there is significant overlap in breast and ovarian tumor and tissue samples; this makes it difficult to properly distinguish between them . . . . 67
5-1 Distribution of differentiating mouse ES cells over stem cell signature. Each curve represents the distribution of SCGS summary values for a particular time point. The stem cell signature collocates the four time points samples and clearly separates the early and late stages of
differentiation.. . . . . . . . . 77
5-2 The stem cell signature genes stratify a phenotypically diverse database according to pluripotentiality. Each panel shows the entire expression database plotted on the principal coordinates defined by the stem cell signature genes. PCi is represented on the x-axis of each plot, while PC2 is on the y-axis. In each plot, the pluripotent stem cells (IPS and ES) are clustered on the extreme right-hand side (magenta), followed by mesenchymal stem cells (blue) and immortalized cell lines (cyan). Each panel demonstrates that, across tissue types, this stem cell signa-ture draws a coherent picsigna-ture of pluripotentiality and differentiation. While the distinction between the pluripotent stem cells and the nor-mal tissues represents the predominant signal (PC1) in the data, the contrast in the expression profiles of hematopoietic and neural tissues apparently defines the second strongest signal. Even so, both tissues respective malignancies show a common tendency to exhibit greater stem-like activity, as demonstrated by their closer proximity to the pluripotent stem cell cluster. A, B, C, D) Blood, breast, brain and colon all demonstrate the same enhanced stem-like expression activity among their respective malignancies. That is, tumor samples cluster more closely to the pluripotent stem cells than their associated normals 87
5-3 Stem cell-like activity correlates with tumor grade in various solid ma-lignancies. Each panel displays the distribution, within the space of the stem cell genes, of graded tumor samples for one particular tissue type. Our molecular index of pluripotentiality and proliferative po-tential consistently separates high-grade tumors from low grade ones.
Based on this transcriptional index, the mid-grade tumors are less well
defined. ... ... 89
5-4 Four distinct expression modules are apparent within the stem cell genes. To demonstrate the transcriptome-wide implications of these profiles, this figure shows a series of cell types, ranging from fully dif-ferentiated (normal breast), through the associated malignancy, par-tially committed stem cells, and pluripotent stem cells. Each gene (row) has been independently z-score normalized to improve readabil-ity and highlight cluster-specific trends. Biological significance of each cluster was determined by GO analysis. . . . . 91
List of Tables
4.1 The change in correlation between normal and cancerous tissue sam-ples. Each value in the table corresponds to the mean correlation between all samples with the given phenotype. We see that the cor-relation between normal tissue samples is generally higher than the corresponding correlation of cancerous tissue pointing toward a loss of differentiation. This loss of correlation may be attributed to the loss differentiation in tumor tissue causing a more variance in gene
expression. . . . . 51
4.2 Area under the curve for selected UMLS concepts. . . . . 56
4.3 Area under the curve for selected UMLS concepts. . . . . . . . . 63
5.1 Genes comprising the SCGS . . . . 78
7.1 GO terms associated with the top 250 differentially expressed soft tissue genes . . . 117
7.2 GO terms associated with the top 250 differentially expressed soft tissue genes . . . 187
7.3 GO terms associated with the top 250 differentially expressed brain genes. ... ... .. ... .. . .... ... .. . 190
7.4 GO terms associated with the top 250 differentially expressed blood
genes. ... ... 191
7.5 GO terms associated with the DNA replication
/
cell cycle SCGS expression m odule . . . 194 7.6 GO terms associated with the RNA transcription/
protein synthesisSCGS expression module . . . 210 7.7 GO terms associated with the metabolism
/
hormone signaling SCGSexpression m odule . . . 217 7.8 GO terms associated with the signaling
/
cellular identity SCGSChapter 1
Introduction
Modern biology is awash in data mining problems, many of a high-dimensional na-ture. Several high-throughput technologies have been developed that enable us, with relative ease and little expense, to evaluate the coordinated expression levels of tens of thousands of genes [24, 33], evaluate hundreds of thousands of single-nucleotide polymorphisms [6], and sequence individual genomes [30]. The data produced by these assays has provided the research and commercial communities with the op-portunity to derive improved clinical prognostic indicators, as well as develop an understanding, at the molecular level, of the systemic underpinnings of a variety of diseases.
Although several of these technologies have been available for a number of years, there were relatively few samples available, with respect to the number of features assayed. This is beginning to change, with several government-funded biological data repositories boasting sample collections numbering in the hundreds of thousands [82, 14]. The accessibility of such large and phenotypically diverse data resources should eventually enable large-scale data-driven hypothesis generation and testing. This
will necessitate, however, a new generation of data mining techniques that are tuned to the specific signals generated by these assays, and aware of their inherent technical and biological noise properties.
Aside from the statistical methods used to evaluate the assays themselves, an-other, more subtle challenge is emerging. Despite the explosive growth in the amount of data being generated and submitted to the various publicly-available biological data repositories (or perhaps because of that growth), very little work has gone into managing the phenotypic characterization of their samples. If sense is to be made of the underlying assay data, something must first be done to standardize the descrip-tive nomenclature used to annotate each sample and data set. If we are to bring data mining and machine learning methods to bear on these resources, the sam-ple labeling, which is at present largely based on free-text, must be made machine readable.
In this thesis, we explore these issues, specifically within the context of curating and analyzing a large DNA microarray database [83].
1.1
Microarrays
There are three main classes of macromolecules that form the information and phys-ical superstructures required for life: deoxyribonucleic acid (DNA), ribonucleic acid (RNA), and proteins [4]. The "central dogma of molecular biology" [27] asserts a model of information flow between these molecules that closely reflects the biome-chanical operation of the cell. DNA contains all of the fundamental instructions required to form a living organism. Those instructions, encoded primarily as genes,
are passed along, via gene transcription, through messenger RNA (mRNA) molecules
are the organic polymers responsible for directing nearly all of the activity within living cells.
This arrangement is loosely comparable to that of a modern computer executing a program. DNA can be seen as the rough (although inexact) analog to a program's source code: it provides a predefined set of instructions for running a set of algorithms in response to input. Consequently, the state of the machine's memory is fully determined by the combination of that source code along with the input supplied to the program - as the mRNA messages observable at any point in time in a cell are largely the result of the instructions provided by DNA in response to the environment. Thus, quantification of mRNA concentrations has become a popular mechanism for characterizing the molecular state of a cell [5]. Modern DNA microarrays are capable of measuring the relative expression intensities of tens of thousands of genes simultaneously. A thorough explanation of microarray technology is beyond the scope of this thesis, but can readily be found elsewhere
[47].
Briefly, microarrays consist of a set of DNA "probes" bound to a solid substrate over which flourescence-tagged cDNA copy of the sample RNA is hybridized. After sample hybridization, the array is scanned, and the relative flourescence of each probe is recorded. Gene-level transcription levels are then inferred, based on the sequences of the array's probes.Acceptance of this "high-throughput" technique was inhibited early-on by sev-eral high-profile studies citing reproducibility problems [88, 61]. Subsequently, how-ever, many of these inconsistencies were associated with the differences in the cited array technologies and designs, post-processing normalization and statistical analy-ses [48, 99, 15, 12], and a number of studies have successfully demonstrated biological consistency between molecular phenotype signatures derived from high-throughput array technologies [91].
1.2
Thesis Overview
This thesis addresses three main challenges. First, we acquire a large subset of a publicly-available microarray repository and develop a principled method for extract-ing phenotype information from free-text sample labels, then use that information to generate an index of the sample's medically-relevant annotation. The indexing method we develop, Concordia, incorporates pre-existing expert knowledge relating to the hierarchical relationships between medical terms, allowing queries of arbitrary specificity to be efficiently answered. Second, we describe a highly-flexible approach to answering the question: "Given a previously unseen gene expression sample, how can we compute its similarity to all of the labeled samples in our database, and how can we utilize those similarity scores to predict the phenotype of the new sample?" Third, we describe a method for identifying phenotype-specific transcriptional pro-files within the context of this database, and explore a method for measuring the relative strength of those signatures across the rest of the database.
Chapter 2 discusses generically the problems presented by free-text bio-medical annotations, and details our approach to building a standardized queryable database from them. Chapter 3 describes the application of that framework specifically to the data resources explored in the remainder of this thesis, namely the transcrip-tional profiles available from NCBI's Gene Expression Omnibus. Chapter 4 presents a method for using the curated database in a nearest-neighbors-like approach to at-tribute phenotype to new samples. Chapter 5 describes the relationship between normal tissue, malignant tissues and stem cells, from the perspective of a highly-conserved stem cell expression profile derived from our database. Due to the diverse nature of the content in this thesis, related and previous works are presented inline with each topic, rather than together in one section.
Chapter 2
Concordia: A UMLS-based Index
of Free-text Documents
The widespread adoption of electronic storage media throughout the medical and biomedical research communities presents significant new challenges and opportuni-ties. Current estimates place United States healthcare IT spending in the range of $7 billion per year [39]. Recent publications have emphasized the utility of these data resources for genomic research, as well as patient care [46, 100, 65]. By recent estimates however, only 17% of doctors and 10% of hospitals are currently utilizing such systems [18]. A variety of programs recently enacted by the US government are intended to motivate doctors and hospitals to adopt technologies that interoperate with other parts of the healthcare system by 2015, or face financial penalty in sub-sequent years [18]. The volume of data generated by this mandate over the coming years will be tremendous.
In addition to the imminent proliferation of electronic medical records, a variety of high-throughput biomedical assays have been refined over the past decade, and
more continue to be developed today. It is expected that the data derived from these assays will eventually be brought to bear on clinical diagnostics as well as therapeutic drug design. The volume of data available from some of these sources (e.g., NCBIs Gene Expression Omnibus repository [14]) has already outstripped our ability to perform large-scale, automated discovery of relevant patterns among records with shared phenotype. At the time of writing, GEO contained over 600,000 samples, each associated with a variety of free-text medical and biological descriptions. Moreover, at present, there exist no systems capable of associating these assay records in a standardized and meaningful way with relevant EHRs or other clinical narrative. Such cross-pollenization would enable sophisticated quantitative clinical diagnostic systems, as well as accelerate the pace of therapeutic innovation.
To our knowledge, there are no open, scalable, standardized systems for cataloging and searching large volumes of medical data that leverage existing expert knowledge. Many institutions have developed proprietary in-house solutions that tend to be ad hoc, lack portability between problem domains (e.g., systems designed for retrieving medical records cannot be easily adapted to the task of retrieving medical literature) and require a major technical undertaking. The applications that consume such services must interact with several different systems that cannot interoperate with one another in any natural, meaningful way.
One of the main contributions of this thesis is a data indexing system that ad-dresses these challenges, called Concordia. Concordia is a scalable standards-based infrastructure for searching multiple disparate textual databases by mapping their contents onto a structured ontology of medical concepts. This framework can be leveraged against any database where free-text attributes are used to describe the constituent records (for example, medical images might be associated with a short description). While our main focus will remain on indexing the metadata associated
with a large gene expression database (NCBI's GEO), we will mention several other use cases for such a system.
This system may be used to form the cornerstone backend search tool required to build portable applications that leverage the wide variety of data-rich resources that are becoming available. Outside the realm of searching biological sample reposito-ries this may also help address one of the core challenges in personalized healthcare practice: identifying clinically distinct subgroups to which a particular patient
be-longs
[45].
The remainder of this chapter will consist of a brief description of the conceptual methods underlying Concordia, and then a brief discussion of implementation details.
2.1
Designing an ontology-based indexing system
Two major challenges arise when indexing free-text medical literature as it appears in electronic medical records, medical reference volumes or other medical docu-ments: resolving synonyms and identifying conceptual relationships between medical terms. We suggest that both of these challenges can be addressed by building a system around the National Library of Medicines Unified Medical Language System (UMLS) [?, 66]. UMLS is an ontological organization of medical concepts, built from various thesauri, such as SNOMED [73], MeSH [51], and RxNorm [53]. Concordia works by mapping both source documents and user queries into UMLS hierarchically
2.1.1
Resolving multiple synonymous terms to unified
con-cepts
Multiple synonymous phrases are often used to describe one common medical or bi-ological concept. For example, the terms malignant neoplasm of the lung and lung carcinoma both describe the same medical concept, but there is no agreement on which term should be used to describe the one underlying concept, a malignant can-cerous growth appearing in the lung. To see where this becomes a challenge, consider searching a database for the phrase lung carcinoma where all of the constituent doc-uments refer to malignant neoplasm of the lung: Searching the database by simple string matching will fail to find the documents related to the query.
We address this problem by mapping the text content of each entity in the database to a controlled vocabulary, the UMLS. The UMLS consists of a series of "biomedical vocabularies developed by the US National Library of Medicine" [66, 19].The purpose of these expert-curated vocabularies is to provide a set of thesauri that map multiple synonymous phrases to a single unified concept. The collection of
these mappings is called the UMLS Metathesaurus. MetaMap [7], a program that
generates these thesaurus correspondences from free text, is available from the Na-tional Library of Medicine (NLM), and is the standard tool for such tasks. MetaMap matches simple syntactic noun phrases from an input text to UMLS concepts, effec-tively standardizing the text to a set of unique concepts.
In our setting, applying MetaMap to the database entities allows us to alleviate the problem of resolving synonymous but textually disparate phrases. One of the major contributions of our approach is the concept that when we later query the database, we can apply the same standardization to the input query as was used to transform the original source text, allowing us to search for database entities
matching the query in the structured space of standardized UMLS concepts rather than free-text. In addition, when the practitioner later wishes to perform large-scale data mining on such a database, we can treat the UMLS concepts associated with the database entities as a discrete labeling thereof, without applying ad-hoc text
searches to identify groups of related records.
2.1.2
Mapping documents and queries onto UMLS ontology
of medical concepts
UMLS provides a hierarchical organization of the concepts that it contains. For ex-ample, the concepts "white blood cell abnormality," "thrombosis," "anemia," and "hemorrhage" are all among the descendants of the concept "hematological diseases" in the UMLS hierarchy. Concordia processes free-text user queries with the same NLP-driven UMLS mapping tool that we use to process the source documents, thus translating the query task into the simpler job of identifying documents associated with the concept(s) to which it maps (see Figure 2-2). Continuing the above ex-ample, any query that maps to the hematological diseases concept should return documents related to any one (or several) of these four subordinate concepts, even though the NLP mapping of the documents source text may not have directly hit hematological diseases. We exploit the expert knowledge encoded in this structure by storing references to the source documents (e.g., medical records, diagnostic tests, medical literature) on top of the UMLS hierarchy.
The ontology is manifested as a directed acyclic graph. Each vertex in this graph stores a pointer to the documents that reference it. This hierarchical structure allows us to efficiently traverse the ontology and retrieve records related to a particular concept and its subordinates. For each concept that a query string maps to, we can
thus efficiently (running time proportional to the number of vertices in the subgraph) return both all of the source documents whose text directly mapped to that concept, as well as those whose text mapped to some subordinate concept.
In scenarios where traversing each subgraph presents a prohibitive impact on sys-tem performance, we have also developed a "pre-processing" procedure that enables faster query response. This procedure first creates a hash table mapping each con-cept to a list of all of its descendants, as well as another hash table mapping each concept to a list of all of its ancestors. These hash tables are then used to generate two additional hash tables: one that maps each concept to a list of all documents referenced by it or one of its subordinates; and another that maps each document to a list of the concepts and their ancestor concepts that are hit by the document. Using these data structures, the query running time for a single concept is constant, rather than dependent on the size of the UMLS subgraph below it. Of course, this comes at the expense of the time required to completely traverse the subgraph reachable from each vertex, as well as the storage space required to persist the results of those graph traversals.
Figure 2-1: Free text source documents are processed with NLP software that maps them to unified medical concepts. Queries against those documents are similarly processed with NLP, reducing the query procedure to matching concepts from the query string against the standardized database.
Utilizing these data structures, we have developed a mechanism in Concordia 27
that can efficiently aggregate documents that match arbitrarily complex logical com-binations of UMLS concepts. We have implemented a standard stack-based algo-rithm [68] for evaluating infix set logic expressions. Here, the operands are the set operators (INTERSECTION, UNION, DIFFERENCE) and the arguments are UMLS concepts. Conceptually, the algorithm works by replacing the stack entry for each UMLS concept in the expression with the set of database records that reference it, then proceeding with the logical evaluation as usual. This enables us to perform free-text queries such as "anemia and cancer" or "lung cancer and metastasis but not smoking" against the library of documents.
2.2
Concordia implementation details
Traditional relational database systems are typically regarded as more flexible than hierarchical databases. Such systems index their records based on lexicographical ordering of key values, irrespective of conceptual relationships that exist between these keys [26]. Here, however, every query (or precomputed traversal) performed against the UMLS index will require a traversal of the UMLS topology similar to the one described in the above. Thus, a hierarchically structured database is more appropriate than a relational model when indexing documents based on an ontology such as UMLS.
We designed software for maintaining the persistent hierarchical database in Java, utilizing Oracles BerkeleyDB JE package. This package allowed us to easily serialize the in-core data structures manipulated by our search algorithms without the com-munication overhead incurred when interacting with an out-of-core database service. To make our Concordia databases accessible to a wide variety of applications, we implemented both SOAP [90] and XML-RPC [97] services that wrap the Concordia
functionality. These APIs expose two main pieces of functionality: they present the topology of the UMLS ontology to the client, and present the concept
/
document associations to the client. API procedures for reporting all ancestor and descendant concepts relative to a particular query concept (as well as their respective minimum hop distance in the UMLS graph), reporting all indexed documents (including those related to descendant concepts) related to a specified query string, and reporting all concepts (including ancestors) related to a particular document are implemented in the current version of the system. We have also implemented an interface be-tween Concordia and the R statistical programming environment [101] via the rJava package [102], avoiding the network-induced overhead of the XML-based APIs.The XML-based APIs (SOAP, XML-RPC) enable out-of-core queries to non-Java applications. In addition, they allow the database the be hosted on dedicated hardware, freeing client applications to run anywhere the network protocols allow. The R API presents a convenient interface to the popular statistical environment. While rJava is JNI-dependent [40], the overhead incurred therein is less than the XML-based APIs. For this reason, the R API is preferred when performance is at a premium, but it is not feasible to develop the entire analysis workflow solely in Java. In addition, this design, with standards-based APIs surrounding the Concordia system, allows for a great deal of scalability through data federation. Similar in spirit to Googles MapReduce methodology [28], queries may be initially processed by a head node which in turn requests that multiple worker nodes perform the database search in parallel . Each of these worker nodes would be capable of searching a separate portion of the database. Results would then be returned to the head node, aggregated, and returned to the client.
This infrastructure enables us to scale to meet future needs by simply adding additional worker nodes. Throughput, scalability and fault tolerance may all be
improved by a variety of striping schemes [81]. Although the particular application of Concordia described in this thesis does not directly rely on this functionality, we mention it as possible future work.
SOAP
XML RPC
a,
S000 000
000
Figure 2-2: The Concordia APIs enable naive data federation to support both fault tolerance and improved total throughput. A query node serves as an intermediary between the client applications and the data-storing nodes that each run a separate Concordia instance. That is, each data-storing "worker" node is responsible for storing a specific subset of the total database. The query node processes client requests and requests that each worker node process the portion of the query representing the data that it is responsible for managing. Each worker node returns its portion of the response, and the multiple worker responses are aggregated at the query node, where they are assembled to be returned to the client application.
2.3
Applications of Concordia
In addition to the database constructed from NCBI's Gene Expression Omnibus that is described in detail later in this thesis, we note several other likely applications.
NCBI maintains a database of gene-centric annotation data [60]. These annota-tions explicitly connect each annotated gene to both biological processes and medical concepts. We have experimented with using Concordia to index these annotations. Such a resource may be valuable for gene set enrichment-type analyses [95], where one wishes to understand the broad-stroke disease and tissue concepts most strongly associated with a predetermined set of genes. We propose replacing the commonly-used Gene Ontology [8] (or GO) terms in these analyses with UMLS concepts whose associated genes are learned from the application of Concordia described above.
Data mining electronic health records is becoming an increasingly popular method for performing pharmacovigilance [100] and genetic studies [46]. By standardizing the nomenclature of disparate data sources across healthcare IT infrastructure and research databases, Concordia may enable larger-scale studies to be performed with minimal overhead.
Concordia is not limited to generating its index based solely on the UMLS on-tology. The system has been designed to be easily reconfigured to generate an index over any ontology or acyclic graph. The possible applications of this technology, therefore span beyond the realm of medical language and knowledge, and it may prove a useful backend datastore for implementing semantic web applications [41].
Chapter 3
Making NCBI's Gene Expression
Omnibus Machine Readable with
Concordia
This chapter presents a brief overview of NCBI's Gene Expression Omnibus, and describes how we applied the Concordia framework to construct a machine-readable index of it. In addition, we will also discuss the handling of GEO's underlying gene expression intensity data, which will be used throughout the remainder of this thesis.
3.1
Motivation
Our analyses will require a large volume of gene expression (microarray) data ac-quired from samples spanning a wide range of clinically relevant biological condi-tions. We have assembled this database from NCBIs Gene Expression Omnibus (GEO) [13]. GEO contains tens of thousands of human microarray samples derived
from extremely diverse experimental conditions. While the sheer volume of data available to the public is promising, bringing these resources to bear on structured analyses presents several challenges [22]. First, the quantitative measurements ac-quired from the microarrays need to be normalized to be comparable to one another across data sets
[47].
Second, because NCBI has not enforced any organization on GEOs free-text description fields, significant work must be done to decipher the relevant phenotype of each sample [22].3.2
Metadata
GEO serves as a public repository of gene expression microarray data. Each submit-ted microarray hybridization is, in GEO terminology, called a sample. Each sample has a set of gene expression intensities associated with it, along with a variety of meta-data describing the sample phenotype and any relevant treatment information. All of this metadata is free-text. Samples are grouped into data series, which represent a collection of related samples, typically derived from the same study
/
publication. Further, each sample may be assigned to zero or more data sets, providing an addi-tional level of phenotypic classification. For example, a researcher publishing a paper on colon tumors might submit a series to GEO containing colon cancer samples along with non-malignant colon biopsies to serve as a control (the series metadata would describe the overall experiment design, and the sample-level annotations would be expected to provide malignant vs. non-malignant phenotype). Continuing the exam-ple, a data set might be composed over a subset of these samples, comprising only those samples derived from patients with a history of inflammatory bowel disease(this phenotype classification might only be represented at the data set level). The goal of our automated processing of GEO was to obtain as comprehensive
picture of phenotype as possible for each sample. As such, we associated all of the relevant free text (sample-, series- and data set-level) available to each sample. We then removed erroneous phenotype associations caused by this overly-optimistic strategy manually (see section 3.2.1).
One of the greatest challenges that needs to be addressed when utilizing loosely-curated resources such as GEO is the lack of standardized nomenclature (see Chapter 2). Specifically, our analyses (described later in this thesis) will seek to cast the activ-ity of both individual genes and coupled gene modules within the context of multiple disease and tissue conditions. GEO's samples are described by free-text descriptions relating to the experimental setup and phenotype of the biological material. In order to utilize this data for our analyses, we need to construct an index into it based on a standardized biomedical nomenclature. We employed the previously described Con-cordia framework to address this challenge. The UMLS thesauri used to construct
the Concordia index were MeSH [51] and SNOMED [73].
3.2.1
Generating high-confidence phenotype labelings
The NLP software that was used to map the samples into the UMLS hierarchy tends to be overly sensitive
[63],
picking up unintended text-to-concept associations. For example, it frequently mistakes certain abbreviations used in a sample's description for concepts that the author hadn't intended (e.g., any text containing the abbrevi-ation "mg." gets mapped by MMTx to the concept that represents "Madagascar", even when the context of the document suggests the author intended it as an abbre-viation for "milligram"). These are challenges that can be overcome only by training an NLP algorithm on domain-specific patterns. As a consequence, the concept as-sociations produced by MMTx represent a good first-pass filter on the text, butare hardly reliable enough to drive analyses where we require data relating to very specific phenotypes. Rather than attempting to refine the NLP procedure, we took a simpler data-driven approach to constructing a high-confidence set of reference samples.
In addition to these homonym errors, the inclusion of high-level descriptive meta-data is often a source of false concept associations. For example, the summary text for GEO series GSE9187 reads:
Transcriptional profiling of human breast cancer cell line LM2, a sub-line of MDA-MB-231 highly metastatic to lung when injected to nude mice, to identify the genes that are regulated after the metastasis gene metadherin is knocked down. Keywords: Genetic modification
Because the NLP software identifies tissue concepts related to both the terms "breast cancer" and "lung", we need to filter out the unintended association (in this case lung, since the cell line is actually breast cancer).
In order to assist with the task of manual data curation, we developed a graphical user interface that allows domain experts to examine the NLP results and both verify the concept associations, as well as add new ones that MMTx missed altogether. This tool allows a user to quickly examine and annotate a large number of samples by grouping samples based on their MMTx-derived annotation. Thus, repeat errors are easily caught and corrected. Nevertheless, the process of generating a high-confidence reference set in this manner is tedious.
This tool presents the user with a list of the GEO samples in the database, grouped by GEO series. The user may select one of these sample identifiers, populat-ing the remainpopulat-ing UI elements, includpopulat-ing fields derived from the sample's associated series, fields derived from the samples' associated data sets and fields derived from
the sample-level annotations. The UI presents the user with the UMLS concepts as-sociated with various text fragments from each level of metadata, allowing each one to be manually verified (see Figure 3-1). A total of 3030 samples (listed in section 7.1) were manually verified. Those samples comprise the data used throughout the remainder of this thesis.
klbamtx EMerimenits sre GSEM108Tit4 4 1 Eripeseion Proj G3084 GE13ec SThirssir of Humar,. inegatlngitu ~ ~ oluea WMe48aos. SM468H7 Eprssia Proj ti 4 unfiqadpw perspetion I maplunr SEria ManualA B Prasarym GSM46973 [ N7pls as s0 _3 Mainat
Programs 786% coplete (1 this session)
ect for Oncology expO
xmpO is to build on the technologies and outcomes of the j Project to accelerate improved clinical management E
IGCs Expression Project for Oncology (expOl seeks to dnl clinical annotation with gene expresson data for a erful portrait of human malignancies. providing critical
dagnostic makers. prognostic irdcators. and therapeutic of expO and its consortium supporters is to procure tissue tandard conditions and perform gene expression analyses notated set of deidentiied tumo sampeit. The tumor data is
*A outcomes nd is released tito the pubic domain
sal property restriction Sernesnatrices are avaiable at
r.gov/pur/geo/DATAJSeiesMatri/GSE2109/ For
see http://www.itgenorg/ Keywords: cancer portraits j
ninotations ISou r Phre Al NeopL.. alig-NeoplL.. Aigun-descripL.. descript.. deasipL.. descriL.. descipt. descript... descript.. decript. of cancer patient: of cancer patients of human maignancief of hman malignancies tissue samples
of deidentiied umor sampk The tumor data
cancer portraits cancer portaits Datset Ttle DaetDescription Dataeat rijaAnnotations GSM137974 Ttle Sma bowetl-195181 GSM1 37374 Description
Qualty metric = 28S to 18S:1.2 PatientAge- 60-70 Gender: Female Ethnic
Background: Caucasian Tobacco Use: NoAlcohol Consumption?: Yes Famig History of Cancer? No Prior Therapy Surgical Relapse Since Primary Treatment Yes Number of Years Until Relapse- 0-5 Retreatment T:
X Retreatment N: X Retreatment M: 1 Retreatment Metastatic Sites Other Retreatment Stage: 4 Retreatment Grade X Retreatment ER: Negative Retreatment PR* Negative Retreatment HER/2 Neu: Negative Primary Site Breast Histology: Metastatic Lobular Carcinoma
GSM13774 Sorce Sa4 boe 135tr137974 Latset
Eripmnrert M anualAesitusor
Anen I Source I Phrase
jtestinal carciroma intestinal cancer
Arrereteie So I 03 03 03 1 1 41 -, ~ . .~
Figure 3-1: A screen shot of the software designed to allow manual validation of the Concordia-derived UMLS annotation. On the extreme left-hand
side of the interface, there is a list of the CEO samples in the database, grouped by CEO series. The user may select one of these, populating the remaining fields on the form. the next column to the right contains the CEO fields derived from the sample's associated series. To the right of that are
the fields derived from the samples' associated data sets. To the right of the data set entries are the fields derived from the sample-level annotations.
At the bottom of each column, a list of check-boxes allows the user to manually validate the UMLS concepts associated with various text fragments.
3.3
Expression Intensity Data
The database is presently comprised exclusively of gene expression samples per-formed on the Affymetrix HGU-133 Plus 2.0 platform. The original CEL files were downloaded from GEO and Affymetrixs MAS 5.0 normalization procedure [2] was performed on each sample. The probe-level measurements were subsequently sum-marized (mean) at the gene level. This summarization step both helps to reduce probe-specific noise [47] and to make the database interoperable with a wide vari-ety of gene-level and protein-level analysis tools. The gene-specific measurements for each sample were then processed to generate both rank normalized values, and z-scored log2 transformed values. The ranked data is often useful when mining the database for phenotypic trends across large sets of samples [47] (e.g., clustering sam-ples related to particular tumor pathologies, and comparing our database to external resources, such as data acquired from alternative platforms), whereas the z-scored data can be useful when looking for more subtle gene-level trends [23] (e.g., detecting tightly-coupled gene modules [10]).
The MAS 5.0 procedure operates on individual samples without explicitly model-ing any inter-chip relationships, as opposed to, e.g., the loess or RMA procedures [20]. Our approach of rank or z-score normalizing the MAS 5.0 data has proven adequate for a wide variety of analyses, while also enabling fast and reliable integration of new samples into the database without the requirement of reprocessing the entire library of expression values. Because we have generated gene-level data (as opposed to, say, platform-specific probe-level data), the data are readily interpretable within the framework of genetic interactions, protein-protein interaction networks, regulatory models, gene set
/
pathway analysis, and all of the publicly available data resources devoted to them.Chapter 4
Mapping the Transcriptional State
Space of Cell Identity
The material presented in this chapter is the result of collaboration with Patrick R. Schmid.
This chapter describes a statistical method that uses our curated GEO Concordia database for phenotype prediction. The central problem we address here is: Given a previously unseen gene expression sample, how can we compute its similarity to all of the labeled samples in our Concordia database, and how can we utilize those similarity scores to predict the phenotype of the new sample?
While microarray experiments have become commonplace, the transcriptional landscape of tissue and disease still remains poorly understood. A macroscopic anal-ysis of 3030 human gene expression samples presented here reveals that biologically related tissues are highly co-localized within the transcriptional state space. From a transcriptome-wide perspective, the boundaries between these related tissues overlap
to form a smooth continuum of related phenotypes. By systematically focusing on restricted regions of this landscape, these boundaries become increasingly distinct, and additional biologically-meaningful organization is revealed. We have developed an online resource that uses this structure to provide detailed tissue and disease phenotype enrichment information for user-submitted microarray samples. We also show that tissue specific marker genes are activated in localized subspaces, and that tumor samples, while proximal to their unaffected counterparts, exhibit greater re-spective expression variance. Furthermore, we see that tumor metastases are often enriched for phenotypes relating to their tissue of origin. In addition, we provide a specificity measure for the conventional clinical classification of tissue and disease, and lay the foundation for large-scale automated clinical prognostication and novel drug-discovery.
4.1
Background and biological motivation
Although the human genetic code has been successfully sequenced, the comprehensive transcriptome-wide landscape representing similarities between various tissues and diseases has yet to be deciphered. Even with the hundreds of thousands of expression arrays available through public repositories such as NCBIs Gene Expression Omnibus (GEO) [13] and EMBIs ArrayExpress [71], transcriptional analyses have generally been limited to isolated pockets of this landscape (e.g., comparison of a diseased tissue class vs. its normal counterpart). While it is known that the activation or repression of specific genetic modules plays a role in creating the phenotypic variances that differentiate various tissue and disease states
[87],
these programs are frequently shared based on high-level biological similarities [74, 107]. The topology of the transcriptional space, as defined by the common vs. unique activation ofthese modules in various tissues and diseases, remains unclear. Insight into the organization of this landscape may provide a quantitative basis for drug repositioning and design, as well as the practice of personalized therapeutics.
Among the principal challenges for large-scale analyses have been the biological and measurement noise and biases that characterize each data set [85], as well as the lack of standardized annotations of tissue and disease characteristics for each sample [22]. Unlike previous efforts such as Oncomine [78], EBIs Human Gene Ex-pression Map [58], TiGER [54], BODYMAP [69], BioGPS, and TiSGeD [105] that address these difficulties by providing gene-centric analyses performed using relative measures of expression, we took a macroscopic view by combining the results from 3030 microarray samples and explored the global transcriptomic landscape.
Indeed, we see that a macroscopic analysis of the human transcriptome shows that tissues reside as close neighbors in a smooth continuum in the expression landscape. Although there are relatively gradual transitions between phenotypes, there is a high degree of localization of individual phenotypes in expression space. A holistic analysis of the global expression landscape reveals that the expression locality of phenotypes provides a key insight to prediction accuracies for clinically meaningful categories using gene expression.
However, the tantalizing goal of leveraging a large, diverse set of data to auto-matically classify and prognosticate patients based on biological samples, perhaps along lines even more clinically relevant than current diagnostic classes [56], has remained distant. The classification of diseases across studies has either used expres-sion samples from small numbers of data sets [92] or within relatively homogenous disease classes [78]. To this end, we take a robust statistical approach that allows users to obtain detailed tissue and disease labels, as well as an enrichment statistic, for new, unlabeled microarray sample by mapping it to this expression continuum.
By providing a view into this continuum, we see that malignant tumor samples are co-located with their unaffected counterparts and that tumor metastases are also mapped to the location of their primary site.
4.2
Multi-resolution analysis of human
transcrip-tional state space
A multi-resolution investigation of the global transcriptome landscape, as represented by the first two principal components of the gene expression values of 3030 microarray samples obtained from GEO, reveals that the expression continuum is first divided into three distinct landmarks: blood, brain, and soft tissue (Figure 4-1A).
A Principal component 1 A 50 0 50 100 B 100 2! C 50 E 80 -50 -100 Genitounnary samples 100 50 * 0 . * Ovary -50 Uterus * Myometrium * Endonetrium V Prostate 100 a Penis & Breast 100 Genditourinary cancer * Ovarian cancer Uterine cancer * Myometrium cancer * Endornetriun cancer s Prostate cancer 9 Breast cancer -50 0 50 Principal component 1 ) 0 50 100 i it--Gastrointestinal Geitounrinary Gastrointestinal samples * Colon Gingiva " Stomach " Kidney " Esophagus
* Liver and/or biliary struc * Tongue * intestine * Salivary glands ture 4-. :*~fr Gastrointestinal cancer C. n' * Colon cancer SLiver cancer 0 Intestinal cancer
& Stomach cancer * Kidney cancer -100 -50 0 50 Principal component I Blood Brain Epithelial -50 -100 *
Figure 4-1: Multi-resolution analysis of the gene expression landscape. (A) The gene expression landscape, as represented by the first two principal components of the expression values of 3030 microarray samples separates into three distinct clusters: blood, brain, and soft tissue. The shading of the regions corresponds to the amount of data located in that particular region of the landscape such that the darker the color, the more data exists at that location. Interestingly, the area where the soft tissue intersects the blood tissue corresponds to bone marrow samples, and where it intersects the brain tissue, mostly corresponds to spinal cord tissue samples. (B) There is a clear separation of genitourinary tissue samples and gastrointestinal samples in the soft tissue cluster. (C) A closer examination of the genitourinary and gastrointestinal sub-clusters shows clear localization of phenotypes. (D) Cancerous tissue samples show greater variance in their expression signals while still remaining proximal to their non-cancerous counterparts.
Tissue specific genes were selected by performing permutation based t tests com-paring, for example, the log-normalized expression values for the blood samples for a given gene to the log-normalized expression values of the samples associated with brain and soft tissue. Each permutation run consisted of computing the t statistic for the actual labeling of the samples and comparing it to the t statistics produced when the labels were randomly permuted 200 times while keeping the sample size distribution constant. To counter the potential influence of sampling bias, this entire procedure was performed 100 times, each time using only a random 75% of the data for each tissue type. Genes that were deemed significant were those that had a false discovery rate corrected p-value of 0.05 or lower in all 100 runs. The genes were then sorted such that a gene that had a larger difference in means between the pheno-types was ordered before those that had a smaller difference. GO enrichment was performed on the top 50, 100, and 250 genes for each tissue type using FuncAssociate 2 [17]. We report only the GO terms that had a resampling-based p-value less than 0.05.
As to be expected, when analyzing the tissue specific characteristics of the clusters for marker genes we see the over-expression of genes such as COL3A1, COL6A3, KRT19, KRT14, and CADHI in the soft tissue cluster and GFAP, APLP1, GRIA2, PLP1, and SLC1A2 in the brain cluster (Figures 4-2 - 4-4). GO enrichment analysis of these tissue specific genes further points to over-enrichment for terms related
to each of the three tissue types (see Supplemental Tables (Chapter 7) 7.2 - 7.4). Interestingly, many spinal cord tissue samples lie at the intersection of the brain and soft tissue clusters, while bone and bone marrow samples lie at the intersection of the blood and soft tissue clusters. Although there have been several reports that data from different datasets are not comparable as the dataset (aka batch) signal is dominant [70, 77], we find that the tissue signal is dominant in this macroscopic view of the transcriptome (see Section 4.4).