HAL Id: hal-01870946
https://hal.archives-ouvertes.fr/hal-01870946
Submitted on 19 Sep 2018
HAL is a multi-disciplinary open access
archive for the deposit and dissemination of
sci-entific research documents, whether they are
pub-lished or not. The documents may come from
teaching and research institutions in France or
abroad, or from public or private research centers.
L’archive ouverte pluridisciplinaire HAL, est
destinée au dépôt et à la diffusion de documents
scientifiques de niveau recherche, publiés ou non,
émanant des établissements d’enseignement et de
recherche français ou étrangers, des laboratoires
publics ou privés.
Quantitative evaluation of muscle tone using force and
acceleration sensors
Ashesh Shah, Christopher Kaewmulpet, Bénédicte Pontier, Jerome Coste,
Jean-Jacques Lemaire, Erik Schkommodau, Simone Hemm-Ode
To cite this version:
Ashesh Shah, Christopher Kaewmulpet, Bénédicte Pontier, Jerome Coste, Jean-Jacques Lemaire, et
al.. Quantitative evaluation of muscle tone using force and acceleration sensors. Swiss Society for
Biomedical Engineering 2014 Annual Meeting, Swiss Society for Biomedical Engineering, Aug 2014,
Zurich, Switzerland. �hal-01870946�
QUANTITATIVE EVALUATION OF MUSCLE TONE USING FORCE
AND ACCELERATION SENSORS
Ashesh Shah(1), Christopher Kaewmulpet(1), Pontier Benedicte(2), Jerome Coste(2), Jean-Jacques Lemaire(2), Erik Schkommodau(1), Simone Hemm-Ode(1),
1. University of Applied Sciences and Arts Northwestern Switzerland, Switzerland;
2. Centre Hospitalier Universitaire de Clermont-Ferrand, Université d'Auvergne, France
Introduction
Rigidity and hypertonia, i.e. abnormally increased muscle tone, are typical symptoms of different neurological diseases such as Parkinson's disease (PD) or coma patients. So far to estimate the severity degree of the symptoms, the semi-quantitative modified Ashworth rating scale [Pandyan , 1999] is used to assess the patient's state in a subjective manner. In this scale, numerical values describe the passive resistance to muscle stretching performed by the examiner but with a high intra- and inter-examiner variability. The aim of the present work was to circumvent this limitation and to study the feasibility to quantify the clinical observations with the use of force and acceleration sensors.
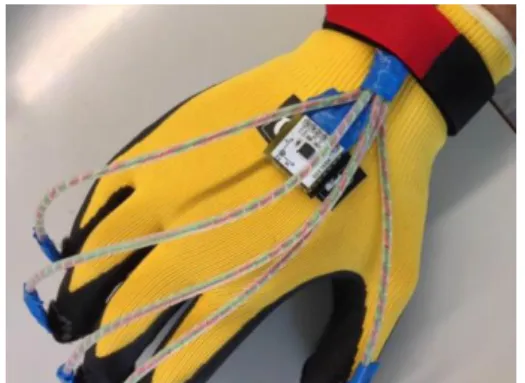
Figure 1: Sensor glove system with force sensors and acceleration sensor.
Method and Patients
A sensor glove prototype with 5 force sensors on the tip of each digit and an acceleration sensor on the back of the palm was designed at our institute to quantify hypertonia (Fig 1). This arrangement of sensors makes it possible to record the amount of forces exerted by the evaluator and the acceleration of his/her movements.
The sensor glove system was used to evaluate the muscle tone of 4 healthy subjects and of 3 PD patients presenting rigidity (University hospital Clermont-Ferrand). The extension of the arm was performed with two different speeds, fast and slow. Additionally, from all the healthy subjects, the fast and the slow movements were performed twice to check for repeatability of the data recording and evaluation process. From the recorded data the arm extension parts were extracted and then filtered
using a low pass filter at 5 Hz. Statistical features like standard deviation (STD), signal energy, signal entropy, peak frequency and peak frequency amplitude were extracted. The Mann-Whitney U test was used to determine the statistical significance of the repeatability tests and to differentiate between the features extracted from healthy subjects and patients.
Results
Out of the different statistical features extracted, only standard deviation and signal energy showed a significant difference between slow and fast movements (p<0.001, α= 0.05) in healthy subjects for force and acceleration sensors. No significant difference existed for the STD and signal energy for the repeated measurements.
A significant difference could be found in energy and STD between PD patients and the mean value of the healthy subjects for the quick movement. The parameters extracted for the slow movement were only significantly different in two patients.
Discussion
The time duration between each evaluation and the limitations of current methods for evaluation of hypertonia increase the difficulty in evaluating the effect of treatments on patients. The quantification of the evaluation using acceleration and force sensors will simplify the comparison of multiple evaluations. One of the most important features required for these evaluations is repeatability. Statistical results between repeated measurements on healthy subjects for slow movement and fast movements clearly demonstrate the repeatability of using the current setup for muscle tone evaluation. It is also possible to differentiate between the slow and the fast movements based on the statistical features extracted. The results demonstrate as well that it is possible to quantify the difference in muscle tone of patients and healthy subjects. Further research is necessary to analyse the correlation between the clinical evaluation by the medical staff and the quantitative evaluation.