HAL Id: hal-00302766
https://hal.archives-ouvertes.fr/hal-00302766
Submitted on 11 May 2007HAL is a multi-disciplinary open access
archive for the deposit and dissemination of sci-entific research documents, whether they are pub-lished or not. The documents may come from teaching and research institutions in France or abroad, or from public or private research centers.
L’archive ouverte pluridisciplinaire HAL, est destinée au dépôt et à la diffusion de documents scientifiques de niveau recherche, publiés ou non, émanant des établissements d’enseignement et de recherche français ou étrangers, des laboratoires publics ou privés.
Measurement of ambient aerosols in northern Mexico
City by single particle mass spectrometry
R. C. Moffet, B. de Foy, L. T. Molina, M. J. Molina, A. Prather
To cite this version:
R. C. Moffet, B. de Foy, L. T. Molina, M. J. Molina, A. Prather. Measurement of ambient aerosols in northern Mexico City by single particle mass spectrometry. Atmospheric Chemistry and Physics Discussions, European Geosciences Union, 2007, 7 (3), pp.6413-6457. �hal-00302766�
ACPD
7, 6413–6457, 2007Single particle mass spectrometry of Mexico City aerosols
R. C. Moffet Title Page Abstract Introduction Conclusions References Tables Figures ◭ ◮ ◭ ◮ Back Close
Full Screen / Esc
Printer-friendly Version Interactive Discussion
EGU Atmos. Chem. Phys. Discuss., 7, 6413–6457, 2007
www.atmos-chem-phys-discuss.net/7/6413/2007/ © Author(s) 2007. This work is licensed
under a Creative Commons License.
Atmospheric Chemistry and Physics Discussions
Measurement of ambient aerosols in
northern Mexico City by single particle
mass spectrometry
R. C. Moffet1, B. de Foy2,3, L. T. Molina2,4, M. J. Molina1, and A. Prather1
1
University of California, San Diego, La Jolla, CA, USA
2
Molina Center for Energy and the Environment (MCE2), La Jolla,d CA, USA
3
Saint Louis University, Saint Louis, Missouri, USA
4
Massachusetts Institute of Technology, Cambridge, MA, USA
Received: 18 April 2007 – Accepted: 25 April 2007 – Published: 11 May 2007 Correspondence to: K. A. Prather (kprather@ucsd.edu)
ACPD
7, 6413–6457, 2007Single particle mass spectrometry of Mexico City aerosols
R. C. Moffet Title Page Abstract Introduction Conclusions References Tables Figures ◭ ◮ ◭ ◮ Back Close
Full Screen / Esc
Printer-friendly Version Interactive Discussion
Abstract
Continuous ambient measurements with aerosol time-of-flight mass spectrometry (ATOFMS) were carried out in an industrial/residential section in the northern part of Mexico City as part of the Mexico City Metropolitan Area – 2006 campaign (MCMA-2006) between 7–27 March, 2006. Biomass and organic carbon (OC) particle types
5
were found to dominate the accumulation mode both day and night. The concentrations of both organic carbon and biomass particles were roughly equal early in the morning, but biomass became the largest contributor to the accumulation mode mass from the late morning until early evening. The diurnal pattern can be attributed to aging and/or a change in meteorology. Fresh elemental carbon (EC) particles were observed during
10
rush hour. The majority of the EC particles were mixed with nitrate, sulfate, organic carbon and potassium. Submicron particles from industrial sources in the northeast were composed of an internal mixture of Pb, Zn, EC and Cl and peaked early in the morning. A unique nitrogen-containing organic (NOC) particle type was observed, and is hypothesized to be from industrial emissions based on the temporal profile and back
15
trajectory analysis. This study provides unique insights into the real-time changes in single particle mixing state as a function of size and time for aerosols in Mexico City. These new findings indicate that biomass burning and industrial operations make sig-nificant contributions to particles in Mexico City. These sources have received relatively little attention in previous intensive field campaigns.
20
1 Introduction
The Mexico City Metropolitan Area (MCMA) is a megacity that allows for a unique opportunity to study air pollution. High levels of criteria pollutants are a product of the city’s high population density, meteorology, and unique geographical location. Both gas and particle phase contaminants are generated that degrade human health and
25
ACPD
7, 6413–6457, 2007Single particle mass spectrometry of Mexico City aerosols
R. C. Moffet Title Page Abstract Introduction Conclusions References Tables Figures ◭ ◮ ◭ ◮ Back Close
Full Screen / Esc
Printer-friendly Version Interactive Discussion
EGU pollutants in the MCMA, with research focusing on a wide range of topics that include
health effects, gas and particle phase measurements, modeling, economics and policy (Molina, 2002; Raga et al., 2001). The basic approach has been to use Mexico City as a case study of air pollution mitigation while major advances continue to improve the regional air quality.
5
To help decrease particulate matter (PM) pollution in Mexico City, one needs a better understanding of the spatial and temporal variability of the sources, size distribution, and chemical composition of the ambient aerosol. Knowledge of these parameters en-ables well-guided strategies for decreasing the PM fraction that is suspected to be the most harmful to human health. Prior to the development of the Automatic Ambient Air
10
Quality Monitoring Network (RAMA) measurements that began in the mid 1980s, there were very few detailed measurements of particulate matter chemical composition in Mexico City. From the late 1980’s to present, Aldape, Miranda, Flores and co-workers measured PM chemical composition in Mexico City by using filters to collect PM fol-lowed by analysis with Proton Induced X-Ray Emission (PIXE) (Aldape et al., 1996a,
15
b; Cahill et al., 1996; Flores et al., 1999; Miranda et al., 1992, 1998, 2004). Flores (1999) showed that there were increased concentrations of lead, copper and zinc in the northern (industrial) part of the city. These results were further corroborated by later results from the sampling period (Mugica et al., 2002).
In the late 1990s, as part of the Aerosol and Visibility Evaluation Research
(IMADA-20
AVER) campaign, Chow and co-workers measured the chemical composition of PM2.5 and PM10 at a variety of sites using filter based techniques while also publishing com-plementary results characterizing the chemical composition of fugitive dust sources (Chow et al., 2002a, b; Vega et al., 2002). Moya and co-workers examined the gas-particle equilibrium of ammonium and nitrate during the same campaign for purposes
25
of evaluating thermodynamic models (Moya et al., 2001). They followed up those stud-ies with size resolved measurements focusing on ammonium and sulfate from winter of 2000 to fall of 2001, but also included measurements of other cations (Moya et al., 2003). From January to February of 2003, Moya and co-workers provided a
size-ACPD
7, 6413–6457, 2007Single particle mass spectrometry of Mexico City aerosols
R. C. Moffet Title Page Abstract Introduction Conclusions References Tables Figures ◭ ◮ ◭ ◮ Back Close
Full Screen / Esc
Printer-friendly Version Interactive Discussion
resolved characterization of inorganic species. They found an unexpectedly large con-centration of K particles, which they attributed to dust from the dry lake bed of Texcoco in the northeastern part of the city (Moya et al., 2004).
The most recent and detailed studies of aerosols in Mexico City were carried out during the MCMA-2003 campaign (Baumgardner et al., 2004; Dunn et al., 2004; Jiang
5
et al., 2005; Jimenez et al., 2004; Marr et al., 2006). Electron microscopy was used to infer the mixing state and transformation of soot particles (Johnson et al., 2005). Chemically resolved PM2.5mass distributions were obtained using a variety of tech-niques including Aerosol Mass Spectrometry (AMS), and other filter based techtech-niques (Salcedo et al., 2006). Salcedo et al. (2006) was also able to track mass concentrations
10
of select, non-refractory aerosol components with a higher time resolution than previ-ously reported by Chow et al. (2002a), while showing a general agreement between the two studies. Newer source apportionment measurements during the MCMA-2003 campaign were able to classify major sources of particles including industrial emissions using factor analysis (Johnson, 2006). Industrial emissions in Johnston et al. (2006)
15
were found to be well correlated with Na and Zn as well as other metals.
Many earlier studies of aerosol size and composition in Mexico City from 1990 to the present day were carried out as a part of major campaigns funded through an interna-tional effort (Molina, 2002). Prior to 2006, there were three major research initiatives that measured aerosol physico-chemical properties: The Mexico City Air Quality
Re-20
search Initiative (MARI), IMADA-AVER and MCMA-2003. The current effort: MILAGRO (Megacity Initiative: Local and Global Research Observations) is the largest to date representing the collaboration of over 400 scientists, from more than 120 institutions. A component of MILAGRO, MCMA-2006, with cooperation from NSF, DOE and a vari-ety of Mexican and European agencies, represents an effort to characterize boundary
25
layer emissions within the MCMA. The single particle mass spectrometry measure-ments discussed herein represented a new approach for studying air quality in Mexico City and were conducted as part of MCMA – 2006. The goal of this current paper is to provide unique insights into the real-time changes in single particle mixing state as a
ACPD
7, 6413–6457, 2007Single particle mass spectrometry of Mexico City aerosols
R. C. Moffet Title Page Abstract Introduction Conclusions References Tables Figures ◭ ◮ ◭ ◮ Back Close
Full Screen / Esc
Printer-friendly Version Interactive Discussion
EGU function of size and time for aerosols in Mexico City.
2 Experimental
2.1 Sampling site – T0
The ATOFMS instrument was located at the Instituto Mexicano del Petroleo (IMP) in the northern part of Mexico City (19◦29′23.60 N, 99◦08′55.60 W). This was one of the
5
three supersites selected for the MILAGRO measurement campaign to characterize the transport of emissions from the urban areas in the MCMA to the surrounding regions. Figure 1 shows the geographical location of the IMP site, referred as T0 (urban site). Measurements were located in a secondary structure on top of a five-story building. Sampling lines were placed >10’ above the structure’s roof to minimize the effects of
10
sampling from the building ventilation exhaust ports. To the north was an 800 m high mountain, Cerro del Chiquihuite, that served to block most of the winds coming from the north. An industrialized area existed to the west, while urban areas resided to the east and south. A dry lake bed of Lake Texcoco was located to the east. A busy roadway was located on the east side of the site with traffic jams during most of the
15
day and street vendors cooking primarily during the morning and afternoon. 2.2 ATOFMS measurements and clustering analysis
The ATOFMS is an instrument designed to measure real-time size and chemical com-position of aerosols. The specific model of the instrument used in Mexico City is de-scribed in (Gard et al., 1997). The aerosols are drawn through a nozzle inlet where the
20
gas undergoes a supersonic expansion, and the particles are accelerated to a specific terminal velocity depending on their aerodynamic size. The particle velocity is deter-mined by measuring the time-of-flight between two 50 mW diode pumped, solid state, frequency doubled Nd:YAG lasers operating at 532 nm. The single-particle scattering
ACPD
7, 6413–6457, 2007Single particle mass spectrometry of Mexico City aerosols
R. C. Moffet Title Page Abstract Introduction Conclusions References Tables Figures ◭ ◮ ◭ ◮ Back Close
Full Screen / Esc
Printer-friendly Version Interactive Discussion
intensities from the two light scattering channels were acquired and saved along with the other single particle data as described in Moffet (2005) (Moffet and Prather, 2005). The particle size is then calculated from the speed using a calibration curve gener-ated with known sizes of standard polystyrene spheres. The speed of the particle is also used to time the arrival of the particle in the ion source region of the dual-polarity
5
time-of-flight mass spectrometer. Once the particle is in the source region, a frequency quadrupled Nd:YAG laser operating at 266 nm with a typical pulse energy of 1.2 mJ desorbs and ionizes each particle. The ATOFMS measures both the positive and neg-ative mass spectra of each particle simultaneously.
The ATOFMS has wide dynamic range capabilities. This is accomplished by taking
10
the two signals from the two mass spectra being measured (positive and negative ion) and splitting them into an attenuated (30 dB) and non-attenuated channel, making four signals in total. The ATOFMS was operated from 6 March 2006 to 29 March 2006. Due to damage incurred during shipment, from 6 March 2006 19:00:01 to 13 March 2006 16:00:01, the instrument was operated without the negative wide dynamic range
15
channel. After March 2006 16:00:01, both the negative and positive mass spectra were acquired using wide dynamic range.
A total of 1.6 million particles were sized and chemically analyzed with the mass spectrometer. The typical percentage of particles producing both size and chemical in-formation was 50%; of these particles, 88% produced both positive and negative
spec-20
tra. This percentage showed little variation over the study, indicating chemical matrix effects did not play a major role (Wenzel et al., 2003). Data from the ATOFMS were imported into a Matlab database program known as YAADA (http://www.yaada.org). Once in the Matlab database, the particles were split into four groups: sub and super-micron having wide dynamic range and non-wide dynamic range. The 48 000 particles
25
from the four subsets of particles were separately classified using ART-2a, a clustering algorithm (Song et al., 1999), run with a vigilance factor of 0.80 and a learning rate of 0.05. The clusters resulting from each analysis were matched to the rest of the particles in the complete dataset. In order to classify 1.4 million out of 1.6 million
par-ACPD
7, 6413–6457, 2007Single particle mass spectrometry of Mexico City aerosols
R. C. Moffet Title Page Abstract Introduction Conclusions References Tables Figures ◭ ◮ ◭ ◮ Back Close
Full Screen / Esc
Printer-friendly Version Interactive Discussion
EGU ticles, 60 sub-micron and 200 super-micron clusters were considered (for each of the
four groups) and accounted for 88% of the chemically analyzed particles. The 200 000 particles not classified made up a large number of sparsely populated clusters. The unclassified particles did not have any major temporal spikes indicating that the original number of particles given to ART-2a was sufficient. The particle clusters resulting from
5
the ART-2a analysis were grouped by hand into 15 general particle types.
Hourly scaling functions were derived by scaling the ATOFMS data with size dis-tribution data acquired with an aerodynamic particle sizer (APS, TSI, Inc.) using the method developed previously by our group (Qin et al., 2006). These scaled data were then used to derive mass concentrations of the specific particle classes by assuming
10
the densities suggested by Qin et al. (2006).
3 Results and discussion
For the 3.5 weeks that the ATOFMS operated at the T0 site, unique anthropogenic particle types and mixing states were observed in northern Mexico City. These unique particle types primarily contained different metals and organic nitrogen species. The
15
majority of particles in the accumulation mode were either identified as biomass (from meat cooking or biomass burning), or organic carbon (OC). In the coarse (super-micron) mode, inorganic dust types were found to dominate. For all particle types, hourly time series (Sect. 3.4) and chemically resolved size distributions were obtained (Sect. 3.2). Average diurnal trends indicate that industrial emissions primarily occur in
20
the early morning and that biomass and OC make the largest contributions to aerosol mass during the early morning to late afternoon hours. To identify possible source re-gions, a concentration field analysis was performed by combining ATOFMS time series with stochastic Lagrangian back trajectories (Sect. 3.5).
ACPD
7, 6413–6457, 2007Single particle mass spectrometry of Mexico City aerosols
R. C. Moffet Title Page Abstract Introduction Conclusions References Tables Figures ◭ ◮ ◭ ◮ Back Close
Full Screen / Esc
Printer-friendly Version Interactive Discussion
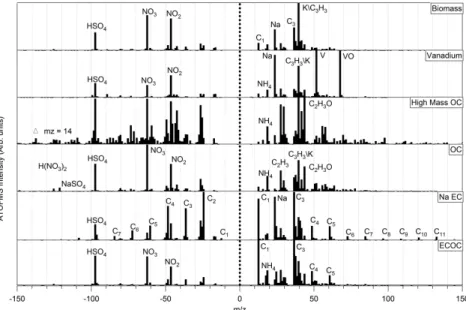
3.1 Mass spectral analysis of the major particle types
Overall, out of the 1.6 million particles analyzed, 88% of the particles were placed into 15 general types by hand grouping the 60 submicron and 200 supermicron clusters from the ART-2a analysis. The average mass spectra for the single particle types are displayed in Figs. 2a and b. A feature that is common to all of the particle types is
5
that 46NO−2 and 62NO−3 are detected in the negative ion spectra, indicating a signifi-cant amount of secondary processing. Other secondary markers occur in the positive ion spectra, namely18NH+4 and 43C2H3O+. Fine mode particles, especially carbona-ceous types, contain sulfate (97HSO−4) in their negative spectra. Conversely, coarse mode particle types (AlSi, NaK, Ca Dust) often contain other different markers in their
10
negative ion mass spectra such as35Cl− and79PO−3. 3.1.1 Carbonaceous particle types
OC: Organic carbon (OC) particles were one of the most abundant particle types ob-served during this study. These particles are similar to those detected in other ATOFMS field studies (Liu et al., 2003; Noble and Prather, 1996; Pastor et al., 2003) and
vehic-15
ular source characterization studies (Sodeman et al., 2005; Toner et al., 2006). OC particles are typified by a large number of hydrocarbon envelope peaks that start with the base carbon peak12nC+n. In Fig. 2a, the major hydrocarbon-containing peaks are
identified as27C2H+3 and 43
C2H3O+. Many spectra also contain a large peak at m/z 39 (K+), indicating agglomeration between OC and biomass types.
20
Biomass: Previous ATOFMS studies have provided a solid basis for the identification of biomass particles (Guazzotti et al., 2003; Silva et al., 1999). Particles classified as biomass always have39K+ as one of the largest peaks in the positive ion mass spec-trum. Additionally, the biomass mass spectrum contains carbon marker ions. Na+ is more prominent in the biomass particles than it is in the other carbonaceous particle
25
types (with the exception of the NaEC type). Particles having these chemical signa-tures can be emitted as a result of biomass burning or cooking operations (Silva, 2000).
ACPD
7, 6413–6457, 2007Single particle mass spectrometry of Mexico City aerosols
R. C. Moffet Title Page Abstract Introduction Conclusions References Tables Figures ◭ ◮ ◭ ◮ Back Close
Full Screen / Esc
Printer-friendly Version Interactive Discussion
EGU NaEC: The NaEC type is characterized by elemental carbon cluster ions at spacing
of 12 m/z unitsin both the positive and negative ion spectra. This type has a dominant 23
Na+ peak. This combination of EC and Na ions is consistent with observations in other single particle mass spectrometry measurements of heavy duty vehicle (HDV) emissions (Toner et al., 2006) and field studies (Guazzotti et al., 2001; Liu et al., 2003;
5
Noble and Prather, 1996; Pastor et al., 2003).
ECOC: The Elemental Carbon/Organic Carbon (ECOC) type is characterized by a positive ion mass spectrum that is dominated by clusters of carbon atoms. In addi-tion to the major elemental carbon markers, minor signals occur from organic carbon envelopes along with many of the typical OC markers.
10
High Mass OC: The high mass organic carbon class was made to be a separate par-ticle type due to the presence of hydrocarbon envelopes in the positive ions extending above 100Da. Typically these hydrocarbon envelopes have a ∆m/z = 14, which is due to successive losses of a 14CH2 group. Although not shown in the figure, the hydro-carbon envelopes can extend out to m/z = 200 and above. High mass negative ions
15
have been shown in lab secondary organic aerosol (SOA) studies (Gross et al., 2006) and have been attributed to oligomeric species. Positive ion laser desorption ioniza-tion mass spectra at 266 nm with such high mass signatures are typically attributed to polycyclic aromatic hydrocarbons (PAH) (Gross et al., 2000).
Vanadium: Vanadium particles have been identified with other analytical methods as
20
well as single particle mass spectrometry in studies of light duty vehicle (LDV) emis-sions (Sodeman et al., 2005), from industrial urban areas (Noble and Prather, 1996; Tolocka et al., 2004), and from coal and oil fired power plant emissions (Suarez and Ondov, 2002). Particles containing vanadium produce a very unique mass spectrum with peaks at51V+ and 67VO+. Oxalate was seen in the negative mass spectrum at
25
m/z = 89, having the chemical formula 89C2O3OH−. Secondary sulfate and primary vanadium are a result of emissions from fossil fuel combustion. Oxalate may be from either biomass burning, or VOC oxidation followed by subsequent cloud processing (Chebbi and Carlier, 1996; Morawska and Zhang, 2002). The fraction of the oxalic acid
ACPD
7, 6413–6457, 2007Single particle mass spectrometry of Mexico City aerosols
R. C. Moffet Title Page Abstract Introduction Conclusions References Tables Figures ◭ ◮ ◭ ◮ Back Close
Full Screen / Esc
Printer-friendly Version Interactive Discussion
mass formed by cloud processing is currently a topic of research (Ervens et al., 2004; Kanakidou et al., 2005).
Nitrogen-containing organic (NOC): One of the new particle types detected in this study includes the NOC particle type. The “NOC” label is used due to the large peak at m/z =58 which we hypothesize is due to58C2H5NHCH+2 which has been identified
5
by ATOFMS and in other laboratory studies (Angelino et al., 2001; Pitts et al., 1978). There is also a grouping of peaks at m/z =212–215 of unknown identity. Although the peaks are small, they occur on almost every NOC particle detected.
3.1.2 Coarse mode particle types
NaK: Some particles are characterized by having the majority of the positive spectrum
10
dominated by23Na+ or39K+. The negative spectrum shows nitrate46NO−2 and 62NO−3 as the major peaks, but there is also significant signal from79PO−3 and35,37Cl−. Coarse mode Na and K have been found to be in soil dust, biogenic material, and sea salt (Beddows et al., 2004).
AlSi: 27Al+ was frequently found to be mixed with 23Na+,39K+ and 35Cl−. If Al was
15
associated with silicon markers60SiO−2 and76SiO−3, the particle was placed in the Al/Si class. The presence of these peaks suggests that the particle was an aluminosilicate species common to mineral dust. 7Li was another common peak seen in the positive spectrum of the Al/Si type. The peak at m/z =56 could occur from56Fe+ or56KOH+; and possibly even contributions from56CaO+ when there is a corresponding peak at
20
m/z =40, indicating40Ca+.
Ca: At m/z = 4040Ca+ stands out as the largest peak in the positive ion spectrum accompanied by smaller peaks at m/z = 56 and 57 due to 56CaO+ and 57CaOH+. Previous studies have described the ability of CaCO3 dust to react with nitric acid to form Ca(NO3)2 (Krueger et al., 2004; Laskin et al., 2005). It is likely that the calcium
25
dust shown herein has undergone this reaction as indicated by the negative ion mass spectrum which shows intense markers for nitrite and nitrate at 46NO−2 and 62NO−3.
ACPD
7, 6413–6457, 2007Single particle mass spectrometry of Mexico City aerosols
R. C. Moffet Title Page Abstract Introduction Conclusions References Tables Figures ◭ ◮ ◭ ◮ Back Close
Full Screen / Esc
Printer-friendly Version Interactive Discussion
EGU Minor peaks are seen in the positive spectrum at 24 and 27, likely due to Mg and Al,
respectively.
3.1.3 Metal-rich particles
PbZn: Zn is one of the largest contributors to the positive ion spectrum occurring at m/z = +64, +66, +67 and +68. Often internally mixed with Zn, Pb shows up at m/z =
5
+206, +207, and +208. Other major peaks in the positive spectrum were23Na+ and 39
K+. It has been observed in other studies that Pb, Zn and Na were associated with the industrial areas in northern Mexico City (Chow et al., 2002a; Flores et al., 1999; Johnson et al., 2006; Miranda et al., 1994). In addition to 46NO−2and 62NO−3,35Cl− was one of the most abundant markers in the negative ion spectrum. In general, zinc
10
and lead chlorides have relatively low boiling points (732◦C and 950◦C respectively), and their precursors may be present in high temperature combustion sources such as waste incinerators (Hu et al., 2003; Olmez et al., 1988; Ondov and Wexler, 1998). Upon cooling, these compounds will condense into the solid phase, forming submicron Cl-containing particles.
15
PbNa: It was common for Pb to occur without Zn, so the Pb/Na particles were sep-arated to highlight this difference in mixing state. The Pb/Na type has Pb as the major transition metal marker. As for the PbZn type, Na was typically the largest peak in the positive ion mass spectrum, followed by potassium. Another similarity between Pb/Na and Pb/Zn is the appearance of the35Cl− peak in the negative mass spectrum.
20
Other metal types: The other minor particle types that account for less than 1.3% of the total particles analyzed during the study were given the following labels: Cu, Fe, and miscellaneous metals (MiscMetals). The Cu particle type typically was mixed with EC, Pb, Cl, Na and K. MiscMetals contained a combination of different particle types containing various elements including Mg, Mn, Ti, and Ag.
ACPD
7, 6413–6457, 2007Single particle mass spectrometry of Mexico City aerosols
R. C. Moffet Title Page Abstract Introduction Conclusions References Tables Figures ◭ ◮ ◭ ◮ Back Close
Full Screen / Esc
Printer-friendly Version Interactive Discussion
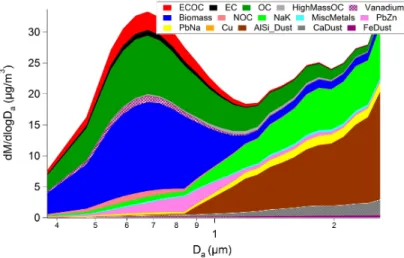
3.2 Chemically resolved particle size distributions
Figure 3 presents the average mass distribution of the major particle types detected with the ATOFMS during the MCMA-2006. This size distribution was determined by scaling the ATOFMS data to the APS using a separate density for each particle class to transform the volume distribution into a mass distribution. In this study, we used
5
the density value of 1.9 g/cm3 for carbonaceous particles, 2.7 g/cm3for dust particles, 1.9 g/cm3 for Na-rich salt particles, 2.0 g/cm3 for biomass emission particles and EC rich particles, and 1.9 g/cm3for the rest of the particle types. This follows the method developed by Qin et al. (2006). By integrating the size distribution shown in Fig. 3, we determine the average PM2.5mass to be 43.5 µg/m
3
. This mass concentration is close
10
to the value of 44.34 µg/m3obtained by Chow et al. (2002a, b) at the Xalostoc site (XAL in Fig. 1; close to T0), as well as that obtained at the RAMA site (38.1 µg/m3) during the same time period as the current measurements. The RAMA site was located 1 km away from the T0 site.
With the exception of the high mass OC type, which peaked around 1 µm,
carbona-15
ceous particle types are typically located in the accumulation mode between 0.1 and 1 µm, whereas the super-micron coarse mode particles were inorganic dust and salt particles as seen in previous ATOFMS studies (Noble and Prather, 1996). The high mass OC type may occur at larger sizes due to the higher degree of chemical aging or fog/cloud processing these particles have undergone. Given that this particle type
20
typically peaked at night when the relative humidity was high, this is likely the case (Qin and Prather, 2006).
The lead and zinc types have interesting size characteristics: the PbNa particle type is primarily supermicron, whereas the PbZn particle type occurs at smaller sizes with a mode at about 850 nm. If these particles were formed by condensation, this size
25
characteristic may be due to different concentrations and physical properties of the vapor. Vanadium particles occur primarily in the submicron portion of the size distribu-tion. Based on their size, the submicron metals are most likely a result of combustion
ACPD
7, 6413–6457, 2007Single particle mass spectrometry of Mexico City aerosols
R. C. Moffet Title Page Abstract Introduction Conclusions References Tables Figures ◭ ◮ ◭ ◮ Back Close
Full Screen / Esc
Printer-friendly Version Interactive Discussion
EGU processes.
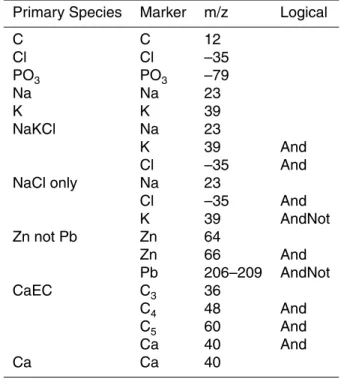
3.3 Analysis of mixing state using the peak search method
In addition to the cluster analysis presented above, a separate analysis involving a peak search method was employed to highlight trends in the aerosol mixing state of the various particle types. A series of markers were selected to represent the
differ-5
ent primary and secondary species. The m/z values used for primary and secondary species are shown in Tables 1 and 2. All ion intensities were set to be above or equal to an absolute peak area (≥100 units) that is just above the noise level (<50). To see which of the selected markers were associated with the various particle types, the par-ticles with the species defined in Tables 1 and 2 were intersected with the major particle
10
types derived from the ART-2a clustering analysis (Sect. 3.1). Figures 3 and 4 show the results of these intersections, where the color scale represents the fraction of particles of each major type (y-axis) associated with a particular marker (x-axis).
3.3.1 Mixing state of secondary species
The presence of secondary species on the various particle types (Fig. 4) provides an
15
indication of the type of chemical processing the particles have undergone in the at-mosphere. The key question is: are there differences in the associations of the major secondary species (e.g. sulfate, nitrate, and ammonium) with each of the major particle types? For instance, the EC and NOC types contain the fewest particles with ammo-nium, nitrate and sulfate, indicating that they may be freshly emitted. As these particles
20
age through condensation and coagulation, they can accumulate other markers to be-come other particle types such as OC, ECOC and even biomass. Ammonium is seen to be constrained mainly to the submicron ECOC and OC types, whereas coarse mode particle types that contain NH+4 are mainly limited to the AlSi and Cu types. For the AlSi type, the NH+4 does not necessarily come from the atmosphere because it is common
25
ACPD
7, 6413–6457, 2007Single particle mass spectrometry of Mexico City aerosols
R. C. Moffet Title Page Abstract Introduction Conclusions References Tables Figures ◭ ◮ ◭ ◮ Back Close
Full Screen / Esc
Printer-friendly Version Interactive Discussion
of aging in this particle type.
Inorganic nitrogen species, such as NO2and NO3,mostly occur on primary inorganic particles such as dust. However, more than 50% of the fine carbonaceous particles are associated with NO2and NO3, and show nitrate is often associated with fine mode particles. Differences in abundance are most likely due to preferential partitioning of the
5
NO2/NO3to the coarse mode particle types (size distribution presented in Sect. 3.2). This is because of the competition between nitrate and sulfate for surface area. Since sulfate is non-volatile, it remains on the smaller particles (limited by gas diffusion), whereas the more volatile ammonium nitrate can evaporate from the smaller particles (Kelvin effect) and condense on coarse mode particles (Bassett and Seinfeld, 1984).
10
The Pb/Na, Cu, and Pb/Zn particle types are more strongly associated with NO2/NO3 compared to any other particle class. The Pb/Zn type is primarily a fine mode particle type, and it is unusual for particles in this size range to be so strongly associated with nitrate. Given that these industrial metal types are likely to be freshly emitted, this is an indicator that these particle classes are emitted with an air mass that contains large
15
amounts of NO that reacted to form particulate nitrate. It is likely the NOx displaced the Cl that was originally in the particles.
The organic carbon markers used to highlight mixing with other particle types were chosen to be43C2H3O+ and C2O3OH
−
(oxalate). It is apparent that43C2H3O is mainly associated with the fine mode particles but occurs in over 40% of the supermicron
20
particles (with the exception of the PbNa type). This organic carbon likely comes from secondary reactions and gas-to-particle conversion. The oxalate marker is an indica-tor of the presence of oxalic acid. Oxalic acid may be emitted as a part of vehicle exhaust and biomass burning (Chebbi and Carlier, 1996; Falkovich et al., 2005; Kawa-mura and Kaplan, 1987) but is most commonly formed through secondary processes
25
including photochemistry followed by condensation, fog processing or aerosol surface reactions (Blando and Turpin, 2000; Faust, 1994; Kawamura and Ikushima, 1993; Yao et al., 2002). Oxalate is associated with biomass and vanadium types, as shown in Fig. 4, where 37 and 45% of the particles in these classes contain the oxalate marker,
ACPD
7, 6413–6457, 2007Single particle mass spectrometry of Mexico City aerosols
R. C. Moffet Title Page Abstract Introduction Conclusions References Tables Figures ◭ ◮ ◭ ◮ Back Close
Full Screen / Esc
Printer-friendly Version Interactive Discussion
EGU respectively.
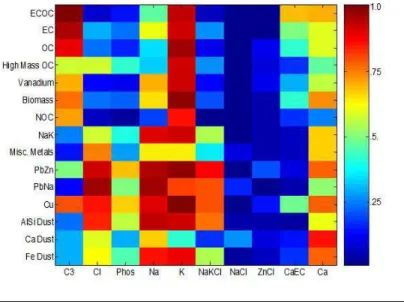
3.3.2 Mixing state of primary species
A marker for EC,36C3, was chosen to highlight the distribution of carbon – especially in the non-carbonaceous particle types. This marker can come from secondary species as well, but is more commonly detected in primary particles. In Fig. 5, it is seen that the
5
PbZn and Cu types are mixed with EC. This result, combined with the predominately fine mode size distribution (Fig. 3), provides further evidence that the PbZn and Cu particles are products of high temperature combustion. While 36C3 can be used to identify particle classes that are internally mixed with EC,40Ca can be used to identify unique sources of EC. Source studies indicate that particles containing both Ca and
10
EC are primarily associated with heavy duty vehicle emissions (Toner et al., 2006). The mixing of elemental carbon with Ca is observed by searching for the typical EC markers together with Ca (CaEC). From Fig. 5, it is apparent that about 50% of the EC is associated with Ca, suggesting diesel vehicles produce a substantial fraction of EC/soot in this region.
15
Chlorine (m/z –35 and –37) is mainly associated with the inorganic particle types. This is supported by Fig. 5 which shows a strong degree of internal mixing between metals, K, Na and Cl. Cl is also strongly associated with the AlSi type and moder-ately associated with the NaK and Ca dust particle types. For Ca dust, there is much less Na and K associated with Cl compared to the other inorganic particle classes. A
20
secondary source of Cl is HCl, which can be formed by heterogeneous displacement when primary particles composed of NaCl, KCl, PbCl2, or ZnCl2 react with acidic (i.e. HNO3 or H2SO4) gases. The resulting HCl can then partition to other particles. This suggests that for the metals and AlSi dust, the Cl is primary and for the Ca dust, the Cl is secondary. It has been shown in previous studies that the mixing between Cl and
25
Ca is due mainly to secondary processing by HCl gas (Sullivan et al., 2007).
In Fig. 5, K particles are present in both the coarse and fine mode particles, whereas Na particles appear to be constrained mainly to the coarse mode. Caution is necessary
ACPD
7, 6413–6457, 2007Single particle mass spectrometry of Mexico City aerosols
R. C. Moffet Title Page Abstract Introduction Conclusions References Tables Figures ◭ ◮ ◭ ◮ Back Close
Full Screen / Esc
Printer-friendly Version Interactive Discussion
when interpreting this result because of the interference of39K with organic markers (e.g. 39C3H+3). This may explain why a large fraction of the organic carbon particles appear to contain K. On the other hand, it is likely that organic particles also contain K, given the high relative intensity of the K ion peak. Biomass particles are a prime example of a submicron particle type that definitely contains K and organic carbon
5
as an internal mixture. Comparison of the OC Art-2a clusters from Mexico City and Riverside, CA reveals that the peak at m/z=39 makes a larger contribution to Mexico City particles, indicating biomass represents a more significant source in Mexico City. 3.4 Temporal characteristics of single particle types
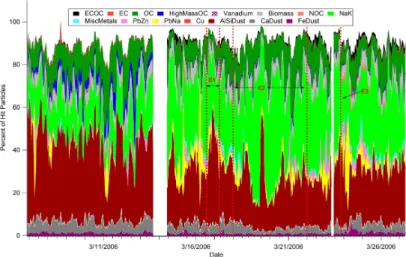
The temporal characteristics of the single particle types can provide a great deal of
10
insight into the origin of the particles. In this section, the temporal profiles for sub- and super-micron particle types are described in detail. Three major events are labeled on the temporal profiles shown in Fig. 6. The first event (E1) was a large dust event where the PM10 concentration exceeded 1 mg/m
3
. The second event (E2) was a holiday weekend and the third event (E3) was a heavy rain event. Figure 7 shows an average
15
diurnal cycle of scaled mass concentrations representing the average of 19 days for the study.
3.4.1 Temporal profile of the entire study
Examining the study as a whole, major features in the overall submicron temporal trends (Fig. 6a) show sharp spikes of metal and nitrogen organic carbon (NOC)
par-20
ticles. Frequently the metal and NOC classes peaked in the morning, usually with relatively short spikes compared with the trends of the other particle classes (organics, biomass etc). This feature suggests that the source of these particles is local. The to-tal PM2.5mass concentrations during these early morning spikes were typically around 50 µg/m3 at the La Villa RAMA site. The weekend event (E2) showed lower
contri-25
ACPD
7, 6413–6457, 2007Single particle mass spectrometry of Mexico City aerosols
R. C. Moffet Title Page Abstract Introduction Conclusions References Tables Figures ◭ ◮ ◭ ◮ Back Close
Full Screen / Esc
Printer-friendly Version Interactive Discussion
EGU with industry. After the rain event (E3), the fractional contribution from the biomass
decreased while OC, NOC, and metal particles increased. This trend continued for the rest of the measurement period, during which evening rain events occurred on a regular basis. Overall, the submicron classes exhibited a fairly strong diurnal behavior which will be examined further in Sect. 3.4.2.
5
Figure 6b shows the temporal profiles of the major supermicron particle types. There was one particularly large dust event caused by strong winds on 16 March 2006 be-ginning at 16:00 CST (E1) during which the measured PM10 exceeded 1 mg/m3at the San Agustin and Xalostoc RAMA sites (near the dry lake bed Texcoco, SAG and XAL in Fig. 1) and almost 700 µg/m3at the La Villa RAMA site closest to T0. The wind blew
10
from these sites towards the west in the direction of T0. Our results show that the Na/K and Al/Si particle types dominated the chemical composition for this time period, thus indicating that the dry lake bed and fugitive sources nearby are major contributors to these particle types. This is consistent with the observations of Chow et al. (2002a and b), who found concentrations of Al, Si, K, and Na to be highest around the SAG and
15
XAL sites compared to other sites around the city. 3.4.2 Average diurnal trends
Figure 7 shows the average diurnal trends for the most abundant submicron parti-cle classes. Metal and NOC partiparti-cles reached their highest concentrations in the early morning hours between midnight and 10:00 a.m. The most dominant particle
20
types in the early morning (from 03:00–8:00 a.m.) were the OC and biomass parti-cle classes. As the day continued, the relative proportion of ECOC and biomass in-creased. Biomass was the most abundant particle class from 08:00 a.m. to 05:30 p.m. Frequently, in the late afternoon, numerous fires were observed on the periphery of the city. In the late evening into the morning, the concentration of the OC particle types
25
increased compared to the other classes. This may be due to increased gas-to-particle phase partitioning of OC as the temperature decreased, or due to less dilution caused by a lower boundary layer. If the latter were true, this would indicate that more of the
ACPD
7, 6413–6457, 2007Single particle mass spectrometry of Mexico City aerosols
R. C. Moffet Title Page Abstract Introduction Conclusions References Tables Figures ◭ ◮ ◭ ◮ Back Close
Full Screen / Esc
Printer-friendly Version Interactive Discussion
OC particles were retained within the basin at night (Qin and Prather, 2006).
Although it appears that biomass particles are the major source of particulate mass in the afternoons, one must use caution when interpreting this result. In the afternoon, there is more secondary organic carbon coating all of the particle classes – including the biomass class. Furthermore, coagulation can also cause a great deal of external
5
mixing on a timescale of about 12 h (Jacobson, 2002). Because the ATOFMS has a high sensitivity to K, it is likely that if an OC particle coagulated with a biomass particle, the resulting particle would be classified as a biomass particle. Therefore, the ATOFMS would see more biomass and less OC particles in the late afternoon. On the other hand, the flow conditions in the afternoon were much different than in the morning and
10
the relative increase in biomass particles may be indicative of influences from different sources. This aspect will be discussed further in the following section using a back trajectory analysis.
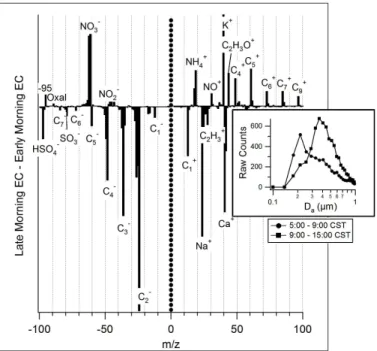
Elemental carbon showed a bimodal diurnal temporal profile with the largest tempo-ral peak at 7:30 a.m. and the second mode occurring at 11:30 a.m. at the same time
15
as the total mass concentration peaked. According to Fig. 8, the EC particles sampled during the early morning peak had smaller aerodynamic diameters (number distribu-tion mode =0.20 µm) than those sampled at the later peak (number distribudistribu-tion mode =0.38µm). In Fig. 8, it is also shown that the EC particles sampled later in the day had more ion intensity from NO−3, NH+4, C3H3O+, and K+. With the exception of K+, these
20
markers are indicative of secondary photochemical processing. Early morning EC par-ticles had more intensity from12nC−n clusters and sulfates in the negative ions as well as more intensity from Na+ and Ca+ in the positive ion mass spectrum. Most of these markers indicate primary species emitted with the elemental carbon particles. Based on these facts, it can be concluded that the early morning peak of EC is comprised
25
of more freshly emitted particles than the EC particles which peak later in the day. In addition, the fact that the EC particles sampled later in the day have more K+ signal indicates that a different source of EC particles begins to have a larger influence as the day progresses, or that they have undergone coagulation with K containing particles.
ACPD
7, 6413–6457, 2007Single particle mass spectrometry of Mexico City aerosols
R. C. Moffet Title Page Abstract Introduction Conclusions References Tables Figures ◭ ◮ ◭ ◮ Back Close
Full Screen / Esc
Printer-friendly Version Interactive Discussion
EGU 3.5 Back trajectory analysis
A Concentration Field Analysis (Seibert, 1994) was carried out using back-trajectories from the FLEXPART model (Stohl et al., 2005). To accomplish this, 100 stochastic particles are released from T0 every 2 h and tracked for 3 days. All the positions of the particles every hour are summed into a gridded field indicating the source region
5
of the air mass at each release time. These gridded fields, called Residence Time Analyses, are then multiplied by the ATOFMS normalized particle counts at the release site and summed over the entire campaign. Potential source regions are highlighted by normalizing with the sum of the unscaled residence time analysis. The method was used to analyze data from the MCMA-2003 field campaign (de Foy, 2006a). Analysis
10
of CO data showed that the method was able to correctly identify urban emissions and analysis of SO2 data identified possible impacts of the Tula industrial complex. This analysis was performed for each of the fifteen particle types seen during MCMA-2006; the results of this analysis are shown in Figs. 8–10. For particle types with only a few sharp peaks, a back trajectory corresponding to peak concentrations is shown.
15
The wind fields for the trajectories were simulated using the MM5 model with modifi-cations for the land surface (de Foy and Molina, 2006c). Additional modifimodifi-cations were made to the simulation procedure (de Foy et al., 2006b). These include finer and larger domains with 92×116, 91×145 and 97×97 cells at 27, 9 and 3 km resolution respec-tively and 41 sigma levels in the vertical, as well as corrections to the sea surface latent
20
heat fluxes.
3.5.1 Spatial distribution of industrial emissions
The T0 site is located in the heart of the industrial sector of the MCMA. As a result, a large fraction of the particles detected at the T0 site are expected to be from local in-dustrial emissions. Typically, local point sources emit pollutants over short timescales.
25
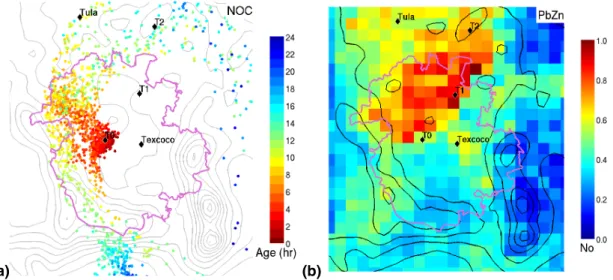
Such pollutant spikes were discussed in Sect. 3.4.1 for the metal and NOC particle types; therefore it is likely that these particle types are from local industry. For the NOC
ACPD
7, 6413–6457, 2007Single particle mass spectrometry of Mexico City aerosols
R. C. Moffet Title Page Abstract Introduction Conclusions References Tables Figures ◭ ◮ ◭ ◮ Back Close
Full Screen / Esc
Printer-friendly Version Interactive Discussion
type, this is verified by looking at the FLEXPART back trajectory shown in Fig. 9 for the largest NOC spike occurring at 09:00 a.m. on 15 March, 2006. This figure indicates that flow was stagnant during this peak in NOC emissions, and thus the source was most likely local. Similar flow conditions were observed during other periods of the study when the NOC particle type was most abundant.
5
From Fig. 7, one can see that the peak of PbNa and PbZn types occurred from midnight to about 10:00 (CST). The concentration field analysis in Fig. 9 indicates source regions north of T0 for PbZn, as well as for PbNa (not shown). Concentrations of Pb and Zn in northern Mexico City have been historically high compared to other regions of Mexico City (Chow et al., 2002b). There is evidence for transport of Na and
10
Zn particles from the northern to southern parts of the city, as Johnson et al. (2006) have shown. At the same site, Salcedo et al. (2006) noticed sharp spikes of particulate Cl in the early morning hours. In this study, we observe early morning spikes of chloride as well, and show that it is internally mixed with Pb, Zn, Na and K. Johnson et al. attributed the Na and Zn to an industrial source in their factor analysis, and Salcedo et
15
al. suggested that most of the Cl was present as NH4Cl. The results obtained herein show that all Na, Cl, and Zn are likely industrial and internally mixed within the same particles (Fig. 5). The speciation of Cl does not necessarily have to be exclusively NH4Cl because NaCl, KCl, ZnCl2or PbCl2are also possible. For all of these species, displacement of Cl by NO3explains the strong association of the metal particle classes
20
with NO2/NO3.
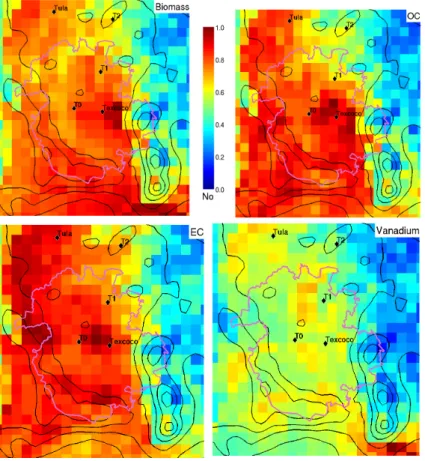
3.5.2 Spatial trends of carbonaceous particle types
Carbonaceous particle types in Mexico City are expected to be produced by a variety of urban and regional sources, both primary and secondary. The concentration field analysis shown in Fig. 10 for the OC particle type shows that these particles originated
25
from all across the basin. The EC particle type shows more intensity close to T0 and in the northwest. Because the EC particle type represents a freshly emitted particle type and also because concentrations are highest when winds are weak and variable, the
ACPD
7, 6413–6457, 2007Single particle mass spectrometry of Mexico City aerosols
R. C. Moffet Title Page Abstract Introduction Conclusions References Tables Figures ◭ ◮ ◭ ◮ Back Close
Full Screen / Esc
Printer-friendly Version Interactive Discussion
EGU Concentration Field Analysis does not indicate a preferred source region. EC particles
coming from the north may be due to combustion operations or other industrial oper-ations in the north. Biomass particles show a strong correlation with flow through the gap in the mountains to the southeast of the city – a region where large fires occurred. This type of flow usually occurs in the afternoon when the biomass particles peaked
5
and is associated with vertical advection and basin venting (de Foy et al., 2005; de Foy et al., 2006c). There is also slightly more source strength for the biomass particles near the hillsides of the basin. This may be due to the fact that there were frequently numerous small fires on these hills that were used to clear fields for the upcoming crop season. Lastly, vanadium particles are also correlated with the gap flow from the south
10
with a smaller signature from the north-northwest. Johnson et al. (2006) had found a single vanadium peak time period during the MCMA-2003 that was strongly correlated with SO2and back-trajectories from the Tula complex. During MCMA-2006, there were half a dozen peaks in the vanadium types in addition to substantial diurnal and day-to-day variations. Some of the peaks are associated with SO2 and trajectories from
15
the north, while others are associated with weak and variable winds followed by the strong gap flow sweeping through the basin. At this time, it is unknown whether there are any large sources of vanadium particles in the MCMA. Some of the major sources that burn fuel-oil are located in the north, where Fig. 10 shows a mild influence from the vanadium particle type.
20
3.5.3 Spatial trends in coarse mode particle types
The concentration field analysis from the coarse (super-micron) mode particle types is shown in Fig. 11. AlSi, Ca and Fe dust all had similar spatial footprints where the highest concentration events correlated well with the flow from the northwest near the Tula region. For the Ca type, this would be consistent with the fact that the cement
25
plants in that region emit dust with high concentrations of Ca (Vega et al., 2001). The Fe particle type had slightly more influence from the northwest than did the AlSi or Ca types. The NaK particle type was significantly different from any other coarse mode
ACPD
7, 6413–6457, 2007Single particle mass spectrometry of Mexico City aerosols
R. C. Moffet Title Page Abstract Introduction Conclusions References Tables Figures ◭ ◮ ◭ ◮ Back Close
Full Screen / Esc
Printer-friendly Version Interactive Discussion
particle type, showing more contributions from the east to northeast. The dry lake bed Texcoco is located in the east, and has been historically correlated with increased quantities of Na and K compared to the rest of Mexico City. Also, the NaK particle type was far more distributed spatially than the other coarse mode particle types. It is also possible that the NaK type contains contributions from vegetative detritus and
5
biomass burning, thus providing a possible explanation for its broad spatial distribution and stronger southerly signature.
4 Conclusions
ATOFMS observations during MCMA-2006 provide chemical mixing state measure-ments with high temporal and size resolution. A new nitrogen-containing organic (NOC)
10
particle type was detected, and lead particles internally mixed with Zn and Cl were also frequently observed. Both of these particle types peaked in the morning hours and were likely the result of industrial emissions. Given the spatial and temporal character-istics of particles with the PbZnCl mixing state, these particles are directly associated with the source of early morning particulate Cl. Furthermore, these same metal
par-15
ticles are likely associated with the source of high Pb and Zn concentrations in the north as seen in previous investigations. These particles and their chemistry will be the subject of a forthcoming paper.
The most abundant particle types seen in the MCMA include biomass and other carbonaceous types for the submicron size range, and dust and inorganic types for
20
the coarse (super-micron) mode. The mixing of these different particle types with sec-ondary species was analyzed in further detail using a peak searching method. Organic carbon was found to be on almost 50% of the coarse mode dust types, while 45% of the biomass and 37% of the vanadium particles were associated with the oxalate ion. It was determined that 58% of the EC particles and 73% of the ECOC particles contained
25
sulfate. This indicates that these freshly emitted particles contain a significant amount of other inorganic components as a result of the source and of secondary chemical
ACPD
7, 6413–6457, 2007Single particle mass spectrometry of Mexico City aerosols
R. C. Moffet Title Page Abstract Introduction Conclusions References Tables Figures ◭ ◮ ◭ ◮ Back Close
Full Screen / Esc
Printer-friendly Version Interactive Discussion
EGU processing.
A temporal analysis of the different particle types gives insight into the possible sources and transformations of the particles. Distinct diurnal variations for the OC and biomass particle types were observed with the Biomass and OC present as the most abundant particle classes in the early morning, then after 10:00 CST, biomass
5
particles took over as the most concentrated carbonaceous particle class. This sug-gests that either transport and/or aging processes served to transform the chemical composition of the carbonaceous particles. After 18:00 CST, OC particles start to in-crease in concentration while biomass particles dein-crease. This diurnal variation has a potential to serve as a “clock” of the aging and transport characteristics of the aerosol
10
in the heart of the MCMA, thus providing a timescale by which measurements can be compared with models. These temporal profiles provided by the ATOFMS were used, together with meteorological modeling to provide source regions for the major particle types. Knowledge gained from this analysis will ultimately be combined with emissions inventories for the MCMA to give the most likely sources for each of the major particle
15
types.
Acknowledgements. This field campaign is the collaborative effort of a large number of partic-ipants with the support of multi-national agencies. The authors would like to thank G. Sosa, P. Sheehy, R. Volkamer, J. L. Jimenez, and K. Docherty for their help and guidance during the MCMA-2006 field study. R. Sanchez overcame the location problems of our digitizers. R.
Os-20
borne and D. Collins helped organize and consolidate the shipment of equipment into Mexico as well as providing APS data. T. Perez and R. Cepeda provided much needed and timely logistical support. R. Ramos graciously provided gas phase and PM data from the RAMA mon-itoring network. We thank NSF for funding under ATM-0511803 and ATM-0528227. We also thank DOE for funding under DE-FG02-0563980.
25
References
Aldape, F., Flores, J., Diaz, R. V., and Crumpton, D.: Upgrading of the PIXE system at ININ (Mexico) and report on elemental composition of atmospheric aerosols from 1990 in the
ACPD
7, 6413–6457, 2007Single particle mass spectrometry of Mexico City aerosols
R. C. Moffet Title Page Abstract Introduction Conclusions References Tables Figures ◭ ◮ ◭ ◮ Back Close
Full Screen / Esc
Printer-friendly Version Interactive Discussion
ZMCM, Nucl. Instrum. Methods Phys. Res., Sect. B, 109, 459–464, 1996a.
Aldape, F., Flores, J. , Garcia, R., and Nelson, J. W.: PIXE analysis of atmospheric aerosols from a simultaneous three site sampling during the autumn of 1993 in Mexico City, Nucl. Instrum. Methods Phys. Res., Sect. B, 109, 502–505, 1996b.
Angelino, S., Suess, D. T., and Prather, K. A.: Formation of aerosol particles from reactions
5
of secondary and tertiary alkylamines: Characterization by aerosol time-of-flight mass spec-trometry, Environ. Sci. Technol., 35(15), 3130–3138, 2001.
Bassett, M. E. and Seinfeld, J. H.: Atmospheric equilibrium-model of sulfate and nitrate aerosols 2: Particle-size analysis, Atmos. Environ., 18(6), 1163–1170, 1984.
Baumgardner, D., Raga, G. B., and Muhlia, A.: Evidence for the formation of CCN by
photo-10
chemical processes in Mexico City, Atmos. Environ., 38(3), 357–367, 2004.
Beddows, D. C. S., Donovan, R. J. , Harrison, R. M. , Heal, M. R., Kinnersley, R. P., King, M. D., Nicholson, D. H., and Thompson, K. C.: Correlations in the chemical composition of rural background atmospheric aerosol in the UK determined in real time using time-of-flight mass spectrometry, J. Environ. Monitor., 6(2), 124–133, 2004.
15
Blando, J. D. and Turpin, B. J.: Secondary organic aerosol formation in cloud and fog droplets: a literature evaluation of plausibility, Atmos. Environ., 34(10), 1623–1632, 2000.
Cahill, T. A., Morales, R., and Miranda, J.: Comparative aerosol studies of Pacific Rim cities – Santiago, Chile (1987); Mexico City, Mexico (1987–1990); and Los Angeles, USA (1973 and 1987), Atmos. Environ., 30(5), 747–749, 1996.
20
Chebbi, A. and Carlier, P.: Carboxylic acids in the troposphere, occurrence, sources, and sinks: A review, Atmos. Environ., 30(24), 4233–4249, 1996.
Chow, J. C., Watson, J. G., Edgerton, S. A., and Vega, E.: Chemical composition of PM2.5 and PM10 in Mexico City during winter 1997, Sci. Total Environ., 287(3), 177–201, 2002a. Chow, J. C., Watson, J. G., Edgerton, S. A., Vega, E., and Ortiz, E.: Spatial differences in
25
outdoor PM10 mass and aerosol composition in Mexico City, Journal of the Air and Waste Management Association, 52(4), 423–434, 2002b.
de Foy, B., Caetano, E., Magana, V., Zitacuaro, A., Cardenas, B., Retama, A., Ramos, R., Molina, L. T., and Molina, M. J.: Mexico City basin wind circulation during the MCMA-2003 field campaign, Atmos. Chem. Phys., 5, 2267–2288, 2005,
30
http://www.atmos-chem-phys.net/5/2267/2005/.
de Foy, B., Clappier, A., Molina, L. T., and Molina, M. J.: Distinct wind convergence patterns in the Mexico City basin due to the interaction of the gap winds with the synoptic flow, Atmos.
ACPD
7, 6413–6457, 2007Single particle mass spectrometry of Mexico City aerosols
R. C. Moffet Title Page Abstract Introduction Conclusions References Tables Figures ◭ ◮ ◭ ◮ Back Close
Full Screen / Esc
Printer-friendly Version Interactive Discussion
EGU
Chem. Phys., 6, 1249–1265, 2006a.
de Foy, B., Lei, W., Zavala, M., Volkamer, R., Samuelsson, J., Mellqvist, J., Galle, B., Martinez, A. P., Grutter, M., and Molina, L. T.: Modelling Constraints on the emission inventory and on vertical diffusion for CO and SO2 in the Mexico City Metropolitan Area using Solar FITR and zenith sky UV spectroscopy, Atmos. Chem. Phys. Discuss., 6, 6125—6181, 2006b.
5
de Foy, B. and Molina, L. T.: MODIS Land Surface Parameters for Improved MM5 Simulations in the Mexico City basin during the MILAGRO Field Campaign, in 7th Annual WRF User’s Workshop, Boulder, Colorado, 2006.
de Foy, B., Varela, J. R., Molina, L. T., and Molina, M. J.: Rapid ventilation of the Mexico City basin and regional fate of the urban plume, Atmos. Chem. Phys., 6, 2321–2335, 2006c.
10
Dunn, M. J., Jimenez, J. L., Baumgardner, D., Castro, T., McMurry, P. H., and Smith, J. N.: Measurements of Mexico City nanoparticle size distributions: Observations of new particle formation and growth, Geophys. Res. Lett., 31(10), L10102, doi:10.1029/2004GL019483, 2004.
Ervens, B., Feingold, G., Frost, G. J., and Kreidenweis, S. M.: A modeling study of aqueous
15
production of dicarboxylic acids: 1. Chemical pathways and speciated organic mass produc-tion, J. Geophys. Res. Atmos., 109(D15), D15205, doi:10.1029/2003JD004387, 2004. Falkovich, A. H., Graber, E. R., Schkolnik, G., Rudich, Y., Maenhaut, W., and Artaxo, P.:
Low molecular weight organic acids in aerosol particles from Rondonia, Brazil, during the biomass-burning, transition and wet periods, Atmos. Chem. Phys., 5, 781–797, 2005,
20
http://www.atmos-chem-phys.net/5/781/2005/.
Faust, B. C.: Photochemistry of Clouds, Fogs, and Aerosols, Environ. Sci. Technol., 28(5), A217–A222, 1994.
Flores, J., Aldape, F., Diaz, R. V., Hernandez-Mendez, B., and Garcia, R.: PIXE analysis of airborne particulate matter from Xalostoc, Mexico: winter to summer comparison, Nucl.
25
Instrum. Methods Phys. Res., Sect. B, 150(1–4), 445–449, 1999.
Gard, E., Mayer, J. E., Morrical, B. D., Dienes, T., Fergenson, D. P., and Prather, K. A.: Real-time analysis of individual atmospheric aerosol particles: Design and performance of a portable ATOFMS, Anal. Chem. , 69(20), 4083–4091, 1997.
Gross, D. S., Galli, M. E., Kalberer, M., Prevot, A. S. H., Dommen, J., Alfarra, M. R., Duplissy,
30
J., Gaeggeler, K., Gascho, A., Metzger, A., and Baltensperger, U.: Real-time measurement of oligomeric species in secondary organic aerosol with the aerosol time-of-flight mass spec-trometer, Anal. Chem., 78(7), 2130–2137, 2006.
ACPD
7, 6413–6457, 2007Single particle mass spectrometry of Mexico City aerosols
R. C. Moffet Title Page Abstract Introduction Conclusions References Tables Figures ◭ ◮ ◭ ◮ Back Close
Full Screen / Esc
Printer-friendly Version Interactive Discussion
Gross, D. S., Galli, M. E., Silva, P. J., Wood, S. H., Liu, D. Y., and Prather, K. A.: Single particle characterization of automobile and diesel truck emissions in the Caldecott Tunnel, Aerosol Sci. Technol., 32(2), 152–163, 2000.
Guazzotti, S. A., Coffee, K. R., and Prather, K. A.: Continuous measurements of size-resolved particle chemistry during INDOEX-Intensive Field Phase 99, J. Geophys. Res. Atmos.,
5
106(D22), 28 607–28 627, 2001.
Guazzotti, S. A., Suess, D. T., Coffee, K. R., Quinn, P. K. , Bates, T. S. , Wisthaler, A., Hansel, A., Ball, W. P., Dickerson, R. R., Neususs, C., Crutzen, P. J., and Prather, K. A.: Characterization of carbonaceous aerosols outflow from India and Arabia: Biomass/biofuel burning and fossil fuel combustion, J. Geophys. Res. Atmos., 108(D15), 4485, doi:10.1029/2002JD003277,
10
2003.
Hu, C. W., Chao M. R., Wu, K. Y., Chang-Chien, G. P., Lee, W. J., Chang, L. W., and Lee, W. S.: Characterization of multiple airborne particulate metals in the surroundings of a municipal waste incinerator in Taiwan, Atmos. Environ., 37(20), 2845–2852, 2003.
Jacobson, M. Z.: Analysis of aerosol interactions with numerical techniques for solving
coag-15
ulation, nucleation, condensation, dissolution, and reversible chemistry among multiple size distributions, J. Geophys. Res. Atmos., 107(D19), 4366, doi:10.1029/2001JD002044, 2002. Jiang, M., Marr, L. C., Dunlea, E. J., Herndon, S. C., Jayne, J. T., Kolb, C. E., Knighton, W.
B., Rogers, T. M., Zavala, M., Molina, L. T., and Molina, M. J.: Vehicle fleet emissions of black carbon, polycyclic aromatic hydrocarbons, and other pollutants measured by a mobile
20
laboratory in Mexico City, Atmos. Chem. Phys., 5, 3377–3387, 2005,
http://www.atmos-chem-phys.net/5/3377/2005/.
Jimenez, J. C., Raga, G. B., Baumgardner, D., Castro, T., Rosas, I., Baez, A., and Morton, O.: On the composition of airborne particles influenced by emissions of the volcano Popocatepetl in Mexico, Natural Hazards, 31(1), 21–37, 2004.
25
Johnson, K. S., de Foy, B., Zuberi, B., Molina, L. T., Molina, M. J., Xie, Y., Laskin, A., and Shut-thanandan, V.: Aerosol composition and source apportionment in the Mexico City Metropoli-tan Area with PIXE/PESA/STIM and multivariate analysis, Atmos. Chem. Phys., 6, 4591– 4600, 2006,
http://www.atmos-chem-phys.net/6/4591/2006/.
30
Johnson, K. S., Zuberi, B., Molina, L. T., Molina, M. J. , Iedema, M. J., Cowin, J. P., Gaspar, D. J., Wang, C., and Laskin, A.: Processing of soot in an urban environment: case study from the Mexico City Metropolitan Area, Atmos. Chem. Phys., 5, 3033–3043, 2005,
ACPD
7, 6413–6457, 2007Single particle mass spectrometry of Mexico City aerosols
R. C. Moffet Title Page Abstract Introduction Conclusions References Tables Figures ◭ ◮ ◭ ◮ Back Close
Full Screen / Esc
Printer-friendly Version Interactive Discussion
EGU
http://www.atmos-chem-phys.net/5/3033/2005/.
Kanakidou, M., Seinfeld, J. H., Pandis, S. N., Barnes, I., Dentener, F. J., Facchini, M. C., Van Dingenen, R., Ervens, B., Nenes, A., Nielsen, C. J. , Swietlicki, E., Putaud, J. P., Balkanski, Y., Fuzzi, S., Horth, J., Moortgat, G. K., Winterhalter, R., Myhre, C. E. L., Tsigaridis, K., Vignati, E., Stephanou, E. G., and Wilson, J.: Organic aerosol and global climate modelling:
5
a review, Atmos. Chem. Phys., 5, 1053–1123, 2005,
http://www.atmos-chem-phys.net/5/1053/2005/.
Kawamura, K. and Ikushima, K.: Seasonal changes in the distribution of dicarboxylic acids in the urban atmosphere, Environ. Sci. Technol. , 27(10), 2227–2235, 1993.
Kawamura, K. and Kaplan, I. R. : Motor exhaust emissions as a primary source for
dicarboxylic-10
acids in Los-Angeles ambient air, Environ. Sci. Technol. , 21(1), 105–110, 1987.
Krueger, B. J., Grassian, V. H., Cowin, J. P., and Laskin, A.: Heterogeneous chemistry of individual mineral dust particles from different dust source regions: the importance of particle mineralogy, Atmos. Environ., 38(36), 6253–6261, 2004.
Laskin, A., Wietsma, T. W., Krueger, B. J., and Grassian, V. H.: Heterogeneous chemistry of
15
individual mineral dust particles with nitric acid: A combined CCSEM/EDX, ESEM, and ICP-MS study, J. Geophys. Res. Atmos., 110(D10), 10208, doi:10.1029/2004JD005206, 2005. Liu, D. Y., Wenzel, R. J., and Prather, K. A. : Aerosol time-of-flight mass spectrometry during
the Atlanta Supersite Experiment: 1. Measurements, J. Geophys. Res. Atmos., 108(D7), 8426, doi:10.1029/2001JD001562, 2003.
20
Marr, L. C., Dzepina, K. , Jimenez, J. L., Reisen, F., Bethel, H. L., Arey, J., Gaffney, J. S., Marley, N. A., Molina, L. T., and Molina, M. J.: Sources and transformations of particle-bound polycyclic aromatic hydrocarbons in Mexico City, Atmos. Chem. Phys., 6, 1733–1745, 2006,
http://www.atmos-chem-phys.net/6/1733/2006/.
25
Miranda, J., V. A. Barrera, A. A. Espinosa, O. S. Galindo, A. Nunez-Orosco, R. C. Montesinos, A. Leal-Castro, and J. Meinguer: PIXE analysis of atmospheric aerosols from three sites in Mexico City, Nucl. Instrum. Methods Phys. Res., Sect. B, 219–20, 157–160, 2004.
Miranda, J., Cahill, T. A., Morales, J. R., Aldape, F., Flores, J., and Diaz, R. V.: Determination of elemental concentrations in atmospheric aerosols in Mexico-City usingproton-induced X-Ray
30
emission, proton elastic-scattering, and laser-absorption, Atmos. Environ., 28(14), 2299– 2306, 1994.
ACPD
7, 6413–6457, 2007Single particle mass spectrometry of Mexico City aerosols
R. C. Moffet Title Page Abstract Introduction Conclusions References Tables Figures ◭ ◮ ◭ ◮ Back Close
Full Screen / Esc
Printer-friendly Version Interactive Discussion
E., Morales, J. R., and Avila-Sobarzo, M. J.: A study of atmospheric aerosols from five sites in Mexico city using PIXE, Nucl. Instrum. Methods Phys. Res., Sect. B, 137, 970–974, 1998. Miranda, J., Morales, J. R., Cahill, T. A., Aldape F., and Flores, J.: A Study of Elemental
Contents in Atmospheric Aerosols in Mexico-City, Atmosfera, 5(2), 95–108, 1992.
Moffet, R. C. and Prather, K. A.: Extending ATOFMS measurements to include refractive index
5
and density, Anal. Chem., 77(20), 6535–6541, 2005.
Molina, L. T. and Molina, M. J.: Air Quality in the Mexico Megacity: An Integrated Assess-ment, Kluwer Academic Publishers, Boston, 1–384, 2002.
Morawska, L. and Zhang, J. F.: Combustion sources of particles. 1. Health relevance and source signatures, Chemosphere, 49(9), 1045–1058, 2002.
10
Moya, M., Ansari, A. S., and Pandis, S. N.: Partitioning of nitrate and ammonium between the gas and particulate phases during the 1997 IMADA-AVER study in Mexico City, Atmos. Environ., 35(10), 1791–1804, 2001.
Moya, M., Castro, T., Zepeda, M., and Baez, A.: Characterization of size-differentiated inorganic composition of aerosols in Mexico City, Atmos. Environ., 37(25), 3581–3591, 2003.
15
Moya, M., Grutter, M., and Baez, A.: Diurnal variability of size-differentiated inorganic aerosols and their gas-phase precursors during January and February of 2003 near downtown Mexico City, Atmos. Environ., 38(33), 5651–5661, 2004.
Mugica, V., Maubert, M., Torres, M., Munoz, J., and Rico, E.: Temporal and spatial variations of metal content in TSP and PM10 in Mexico City during 1996–1998, J. Aerosol Sci., 33(1),
20
91–102, 2002.
Noble, C. A. and Prather, K. A.: Real-time measurement of correlated size and composition profiles of individual atmospheric aerosol particles, Environ. Sci. Technol., 30(9), 2667–2680, 1996.
Olmez, I., Sheffield, A. E., Gordon, G. E., Houck, J. E., Pritchett, L. C., Cooper, J. A., Dzubay,
25
T. G., and Bennett, R. L.: Compositions of particles from selected sources in philadelphia for receptor modeling applications, JAPCA-the International Journal of Air Pollution Control and Hazardous Waste Management, 38(11), 1392–1402, 1988.
Ondov, J. M. and Wexler, A. S.: Where do particulate toxins reside? An improved paradigm for the structure and dynamics of the urban mid-Atlantic aerosol, Environ. Sci. Technol., 32(17),
30
2547–2555, 1998.
Pastor, S. H., Allen, J. O., Hughes, L. S., Bhave, P., Cass, G. R., and Prather, K. A.: Ambient single particle analysis in Riverside, California by aerosol time-of-flight mass spectrometry