HAL Id: hal-00316704
https://hal.archives-ouvertes.fr/hal-00316704
Submitted on 1 Jan 1999
HAL is a multi-disciplinary open access
archive for the deposit and dissemination of sci-entific research documents, whether they are pub-lished or not. The documents may come from teaching and research institutions in France or abroad, or from public or private research centers.
L’archive ouverte pluridisciplinaire HAL, est destinée au dépôt et à la diffusion de documents scientifiques de niveau recherche, publiés ou non, émanant des établissements d’enseignement et de recherche français ou étrangers, des laboratoires publics ou privés.
geomagnetic H, Y and Z fields at Indian observatories
during 1958?1992
R. G. Rastogi
To cite this version:
R. G. Rastogi. Signatures of storm sudden commencements in geomagnetic H, Y and Z fields at Indian observatories during 1958?1992. Annales Geophysicae, European Geosciences Union, 1999, 17 (11), pp.1426-1438. �hal-00316704�
Signatures of storm sudden commencements in geomagnetic H, Y
and Z ®elds at Indian observatories during 1958±1992
R. G. Rastogi
Department of Physics, Gujarat University, Ahmedabad 380 009, India and Physical Research Laboratory, Ahmedabad 380 009, India Received: 25 October 1998 / Revised: 24 March 1999 / Accepted: 13 April 1999
Abstract. The work describes an intensive study of storm sudden commencement (SSC) impulses in hori-zontal (H), eastward (Y) and vertical (Z) ®elds at four Indian geomagnetic observatories between 1958±1992. The midday maximum of DH has been shown to exist even at the low-latitude station Alibag which is outside the equatorial electrojet belt, suggesting that SSC is associated with an eastward electric ®eld at equatorial and low latitudes. The impulses in Y ®eld are shown to be linearly and inversely related to DH at Annamalainagar and Alibag. The average SC disturbance vector is shown to be about 10±20°W of the geomagnetic meridian. The local time variation of the angle is more westerly during dusk hours in summer and around dawn in the winter months. This clearly suggests an eect of the orientation of shock front plane of the solar plasma with respect to the geomagnetic meridian. The DZ at SSC have a positive impulse as in DH. The ratio of DZ/DH are abnormally large exceeding 1.0 in most of the cases at Trivandrum. The latitudinal variation of DZ shows a tendency towards a minimum over the equator during the nighttime hours. These eects are explained as (1) resulting from the electromagnetic induction eects due to the equatorial electrojet current in the subsurface conducting layers between India and Sri Lanka, due to channelling of ocean currents through the Palk Strait and (2) due to the concentration of induced currents over extended latitude zones towards the conducting graben between India and Sri Lanka just south of Trivandrum. Key words. Interplanetary physics (interplanetary shocks) á Ionosphere (equatorial ionosphere) á Magnetospheric physics (storms and substorms) Introduction
The occurrence of aurora in northern high latitudes during disturbed solar and geomagnetic conditions has attracted the attention of scientists for many centuries.
These auroral displays were found to be associated with geomagnetic disturbances. No such apparent relation-ship between the solar and terrestrial disturbances are easily noticed at low and equatorial latitudes. It has been even suggested that the storms do not aect equatorial ionospheric currents (Chapman, 1951; Matsushita, 1953; Sugiura and Chapman, 1960). The Trivandrum observatory was the ®rst one in the world to operate close to the magnetic equator. Broun (1874) observed systematic storm eects in the geomagnetic ®eld at Trivandrum. Moos (1910) was the ®rst to isolate the geomagnetic storm eects at a low-latitude station, at Alibag, India. India is the only country in the world where three equatorial standard magnetic observatories have been in operation for over four decades. The data continue to be published regularly and distributed for the world scienti®c community. Here an attempt has been made to study the ®rst signatures of geomagnetic storm sudden commencement (SSC) phenomena on all three components of the geomagnetic ®eld at Trivan-drum (TRD), Kodaikanal (KOD) Annamalainagar (ANN) and Alibag (ABG) between 1958±1992.
Following the earlier work of Newton (1948), many investigations have been reported on the diurnal varia-tions of the amplitude and the occurrence frequency of storm sudden commencements in horizontal ®eld H, SSC-H, (Watson and McIntosh, 1950). The ®rst global mor-phology of SSC was discussed by Jacobs and Obayashi (1956). Studies of SSC based on the rapid run magneto-grams during the IGY have been reported by Sano (1963). Ferraroand Unthank (1951) was ®rst tonote thesimilarity between the solar daily variation of the mean amplitude of SSC(H) and that of DH itself. The maximum amplitude of SSC(H) at Huancayo, an equatorial electrojet station, occurred at noon and was considerably larger than the same at any other station. Similar daytime enhancement of SSC(H) at equatorial stations were reported by Sugiura (1953), Srinivasamurthy (1959), Maeda and Yamamoto (1960), Rastogi (1965) and Natarajan (1969).
Rastogi et al. (1964) showed that the latitudinal variation of the amplitude of SSC in H at equatorial
stations was similar to that of the solar daily range of H itself. Further, the equatorial enhancement of the amplitude of SSC(H) was shown to be more pronounced in American than in Indian longitudes in a similar fashion to the equatorial enhancement of the amplitude of Sq(H) itself. Recently, Rastogi (1993) described a detailed study of latitudinal and longitudinal variations of the amplitude of SSC(H) in H at equatorial latitudes. The amplitude of SSC(H) over the magnetic equator was shown to vary with longitude inversely as the square of the mean magnetic ®eld intensity.
During the IGY period, additional geomagnetic observatories were started in India at Trivandrum and Annamalainagar situated respectively at the centre and at the fringe of the equatorial electrojet belt, besides the already existing observatories at Alibag and Kodaik-anal. Trivedi and Rastogi (1968) found that the latitu-dinal variation of SSC(H) showed a maximum value at Trivandrum during the daytime and at Annamalainagar during the nighttime hours. The amplitude of SSC in the vertical ®eld, Z, showed a maximum at Trivandrum during the day as well as during the nighttime hours.
Obayashi and Jacobs (1957) described a detailed study of all the three components of geomagnetic ®eld during storm sudden commencements and drew the current system due to SSC. They identi®ed a part of SSC eect (Dst part) to be of extra terrestrial origin and another part, DS, due to atmospheric origin, and suggested an atmospheric dynamo theory for the SSC current system. Simultaneous changes in declination and horizontal ®elds during SSC were examined by Wilson and Sugiura (1961) and by Sano (1963) from the rapid run magnetograms during the IGY. Rastogi (1992) reported that the storm time (Dst) as well as the disturbance daily (SD) variations in H and westerly declination at equatorial electrojet station, Huancayo, were remarkably similar to each other. Chandra and Rastogi (1997) showed signi®cant simultaneous eects in H and Y at Kodaikanal during SSC and subsequent
storm periods. Rastogi (1998) has recently described the result of detailed study of the eect of storm sudden commencement in H, Y and Z ®elds at the equatorial electrojet station, Annamalainagar based on the data covering 1958±1991. The impulses due to SSC were found to be positive in H and Z but negative in Y. The increase of the Z ®eld simultaneously with the increase of the H ®eld at a northern electrojet station is itself anomalous. The mean amplitudes of SSC impulses were found to be ampli®ed during the day time for H as well as Y components.
Fukushima (1994) showed that the direction of SSC disturbance vector de®ned as tan)1(DY/DH) at low
latitude station can give an idea of the direction of the shock front of the solar plasma bubble causing the sudden commencement. The apparent abnormal DZ due to SSC at Annamalainagar cannot be explained in terms of temporary increase of the strength of the equatorial electrojet current. It was therefore felt necessary to study the eect of the equatorial electrojet on the SSC amplitude DH, DY and DZ at other equatorial stations. With the availability of an excellent set of SSC data from four Indian observatories Trivandrum, Kodaik-anal, Annamalainagar and Alibag since IGY, an anal-ysis was made of the eect of SSC in H, Y and Z components of the geomagnetic ®eld at these stations and are described in this work. The coordinates and the geomagnetic ®eld components are given in Table 1. It is to be noted that the station Trivandrum has been almost at the centre of the electrojet belt, Kodaikanal nearly half way and Annamalainagar near the fringe of the electrojet belt. Alibag seems to be outside the general eects of the equatorial electrojet current.
The amplitudes of the sudden commencement im-pulses DH, DD and DZ were measured from the predisturbed level of the ®eld to the ®rst main impulse. Any preliminary reversed impulses in H ®eld and very rarely in Z or D ®elds were ignored. The DD values were converted in DY according to the formula DY (in nT) =
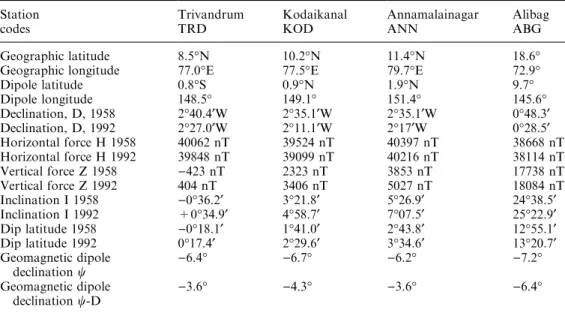
Table 1. Coordinates of geo-magnetic data used in the ana-lysis
Station
codes TrivandrumTRD KodaikanalKOD AnnamalainagarANN AlibagABG Geographic latitude 8.5°N 10.2°N 11.4°N 18.6° Geographic longitude 77.0°E 77.5°E 79.7°E 72.9° Dipole latitude 0.8°S 0.9°N 1.9°N 9.7° Dipole longitude 148.5° 149.1° 151.4° 145.6° Declination, D, 1958 2°40.4¢W 2°35.1¢W 2°35.1¢W 0°48.3¢ Declination, D, 1992 2°27.0¢W 2°11.1¢W 2°17¢W 0°28.5¢ Horizontal force H 1958 40062 nT 39524 nT 40397 nT 38668 nT Horizontal force H 1992 39848 nT 39099 nT 40216 nT 38114 nT Vertical force Z 1958 )423 nT 2323 nT 3853 nT 17738 nT Vertical force Z 1992 404 nT 3406 nT 5027 nT 18084 nT Inclination I 1958 )0°36.2¢ 3°21.8¢ 5°26.9¢ 24°38.5¢ Inclination I 1992 +0°34.9¢ 4°58.7¢ 7°07.5¢ 25°22.9¢ Dip latitude 1958 )0°18.1¢ 1°41.0¢ 2°43.8¢ 12°55.1¢ Dip latitude 1992 0°17.4¢ 2°29.6¢ 3°34.6¢ 13°20.7¢ Geomagnetic dipole declination w )6.4° )6.7° )6.2° )7.2° Geomagnetic dipole declination w-D )3.6° )4.3° )3.6° )6.4°
(DD in minutes of arc) (H/3438) where H is the mean horizontal ®eld at the station. The westerly declination is taken as negative and easterly as positive.
Observations
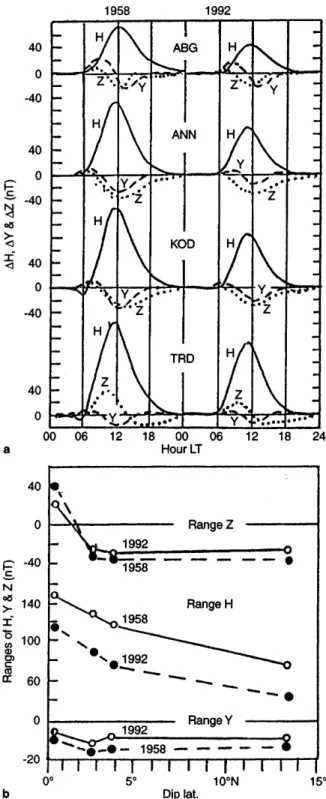
Before describing the characteristics of SSC at these observatories, the yearly mean solar daily variations of H, Y and Z as well as the latitudinal variations of the solar daily ranges of H, Y and Z are shown in Fig. 1 for the typical years 1958 and 1992 which are the beginning and end years of the epoch studied.
During the low sunspot year 1992, the H ®eld at any of the stations was almost constant during midnight to sunrise, increased rapidly with the rising of the Sun reaching a peak around 11 00 LT, after which it decreased relatively slowly reaching the base midnight value shortly after sunset. The amplitude of daily range of H decreased with increasing distance of the station from the equator. During the high sunspot year, 1958, a negative value of DH was observed at TRD and KOD for couple of hours before sunrise. The decrease of DH after the midday peak continued well after the sunset, almost till midnight. The daily range of H at any of the stations was larger in 1958 than for 1992 because there were sunspots in 1958 than in 1992. These observations are similar to those observed at other equatorial electrojet stations described by Ras-togi and Iyer (1976).
The eastward ®eld, Y during 1992 or 1958 showed minor maximum around 09 00 LT and a major mini-mum around 12 00 LT at the equatorial stations TRD, KOD and ANN. The magnitude of the minimum was largest at ANN. At ABG the magnitude of forenoon maximum and noon minimum were of the same order.
The vertical ®eld Z, at KOD and ANN showed primarily a minimum around noon as expected at an equatorial station close to the northern fringe of the electrojet belt. At ABG the DZ showed comparatively smaller minimum around noon. At the station close to the magnetic equator the DZ should be almost zero. However, at TRD a signi®cant positive peak of DZ was observed around 09 00±10 00 LT and a comparatively smaller minimum in the evening hours. Fukushima (1993) noticed similar features in the Z ®eld at Koror and has attributed it to induction by the ocean currents. Thus, the important features to remember in inter-preting observations of SSC in H, Y and Z are (1) a large midday peak of DH at the centre of the electrojet, Trivandrum; (2) largest midday minimum of DY at Annamalainagar; (3) a large forenoon peak of Z at Trivandrum.
In Fig. 2 are reproduced the H, D and Z magneto-grams following a nighttime SSC at 21 38 h on July 17, 1959 at Indian stations TRD, KOD and ANN and ABG. The traces have been so arranged that an upward shift of the trace indicates a increase of DH, DDw westerly declination as well as DZ for any of the stations, but the sensitivity of traces are dierent for dierent stations and are indicated in the diagram.
It is to be noted that the impulse of SSC in H indicates a positive change at any of the stations. It is 131 nT at TRD, 150 nT at KOD, 160 nT at ANN and 149 nT at ABG showing signi®cant decrease of DH near the magnetic equator.
The DZ due to SSC was positive at all electrojet stations, the value at TRD was abnormally large being
Fig. 1. Annual mean solar daily variations of the three components of the geomagnetic ®eld, horizontal (H), eastward (Y) and vertical (Z) for the years 1958 and 1992 at the four observatories in India. Trivandrum (TRD), Kodaikanal (KOD), Annamalainagar (ANN), and Alibag (ABG)
more than corresponding DH at TRD, DZ at ABG was small and negative.
The DY due to SSC was small and positive at TRD and negative at other stations. The value of DY was largest at ANN.
To obtain a consistent idea of the impulses the whole period of study was divided into a daytime period (09 00±13 00 LT) and nighttime period (22 00±02 00
LT). In Fig. 3a, b and c respectively are shown the histograms of the amplitude of impulse in H, Y and Z ®elds at each of the stations for the nighttime and daytime periods separately. In Fig. 3d are shown the latitudinal variations of the SSC impulses DH, DY and DZ for the daytime and for the nighttime hours.
Referring to Fig. 3a relating to the distribution of SSC(DH) the individual values during the daytime ranged from 0 nT to more than 150 nT at TRD, KOD and ANN and between 0 nT and 70 nT at ABG. During the night, the ranges of distribution of DH were smaller compared to those during the daytime at TRD, KOD and ANN. At ABG the scatter of individual values of DH was larger during the night than during the day. The latitudinal variation of DH during the daytime showed a consistent increase towards the magnetic equator. Dur-ing the nighttime DH showed instead a minimum at the magnetic equator.
The distributions of DY at TRD is very dierent from those at KOD, ANN or ABG. The amplitudes of DY at TRD are too low and more are positive than negative. The impulses at KOD, ANN or ABG were always negative, the mean value were largest at ANN, a station near the fringe region of the electrojet belt. The latitudinal variation of DY during the day or the nighttime shows a negative peak at ANN. The values of DZ are positive at electrojet stations TRD, KOD and ANN and negative at ABG. A very anomalous obser-vation, is that DZ shows a very signi®cant maximum at the magnetic equator during the day as well as nighttime hours. Thus, this anomaly in SSC(Z) is despite the electrojet and is probably due to induction eects by a distant and uniform source ®eld in the magnetospheric regions.
In Fig. 3d are shown latitudinal variations of SSC impulses in H, Y and Z during a few daytime and nighttime events. The impulses in H ®eld during the daytime have a general tendency to increase towards the magnetic equator but on 30 November, 1988 event DH at (ANN) was slightly larger than DH (KOD) and on 24 October, 1988 DH (KOD) was larger than DH (TRD). Whether it is signi®cant may be con®rmed by a detailed analysis of the magnetograms of all these observatories. The impulse in Z ®eld showed a rather narrower peak over the magnetic equator. The impulse in Y ®eld consistently showed largest value at ANN. During the nighttime there was always a minimum of DH at TRD and maximum at ANN. This is most probably a bite out of the usual peak of DH at the equator during the daytime. The DZ showed a maximum over the magnetic equator such that at TRD DZ was larger than DH. The impulse on Y ®eld consistently showed the largest value at ANN. Thus the features seen in the mean latitudinal variations are consistent with the same during individual SSC events.
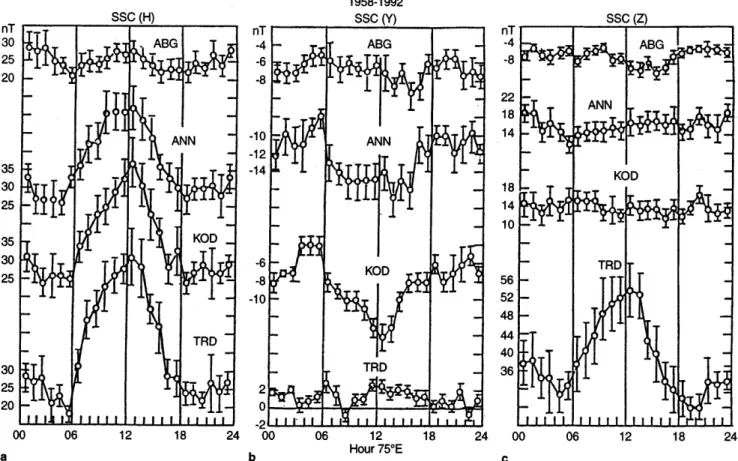
In Fig. 4a, b and c the daily variations of the H, Y and Z components respectively at each of the stations are shown. It may be noticed that the amplitude of SSC(H) at any of the stations was at a minimum during dawn and dusk periods and there is a major maximum around noon and a minor one at midnight. The daytime
Fig. 2. Tracings of H, Y and Z magnetograms at Trivandrum, Kodaikanal and Annamalainagar during SSC at 2138 LT (night-time) on July 17, 1959
enhancement of SSC(H) was most pronounced at TRD, a station closest to the magnetic equator, but is de®nitely clear even at ABG a station accepted to be on the outside of the belt of equatorial electrojet eects. Thus, the amplitude of SSC(H) at low latitude is closely related to the conductivity of the ionosphere which reaches its maximum value at midday. In other words the SSC(H) at low latitudes is associated with an
eastward electric ®eld in addition to the compression of the magnetosphere during the impact of solar plasma on the magnetosphere. The amplitude of SSC(Y) at TRD does not show any signi®cant change with time of the day. At KOD and ANN and to a lesser degree at ABG, the SSC(Y) impulse is negative in sense and larger in magnitude around the midday hours. Thus, a large positive DH is associated with a larger negative DY
Fig. 3a±d. Histograms of the amplitudes of sudden commencements in a horizontal ®eld H and Y and b vertical ®eld, Z occurring during midday hours (09 00±13 00 LT) and during night time hours (20 00± 02 00 LT) at Indian observatories TRD, ANN, KOD and ABG
averaged for 1958±1992, c Latitudinal variations of mean DH, DY, and DZ due to SSC occurring during daytime and nighttime. d Latitudinal variations of DH, DY, and DZ during individual SSC events of daytime and nighttime
around noon hours at low-latitude stations. The diurnal changes in the amplitude of SSC(Z) do not seem to be signi®cant at KOD, ANN or ABG. However, SSC(Z) at TRD shows a very large diurnal change with a maxi-mum around midday hours, the magnitude of which is comparable to the corresponding SSC(H) at the same station.
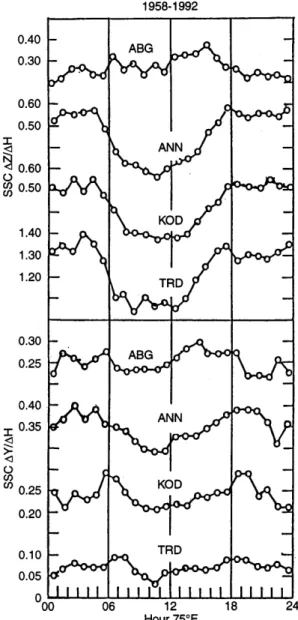
Figure 5 shows the diurnal variations of the ratios jDY=DHj and jDZ=DHj at each of the stations averaged over the entire period of study. The ratio jDY=DHj seems to have minor maxima at sunrise and sunset hours and a minimum around 10 00 LT. The value of jDY=DHj averaged over all hours of the day was 0.07 for TRD, 0.23 for KOD, 0.36 for ANN and 0.25 for ABG. It is to be noted that the ratio of jDY=DHj is largest at Annamalainagar. The ratio jDZ=DHj showed a minimum before midday hours at all the equatorial stations TRD, KOD and ANN while at ABG a small maximum was seen in the afternoon hours. It is important to note that jDZ=DHj at TRD was more than 1.0 at any hour of day. Further the value was larger during nighttime hours than during the day. The whole day mean value of jDZ=DHj was 1.23 for TRD, 0.42 for KOD, 0.45 for ANN and 0.26 for ABG.
The relationship between individual impulses in DH due to SSC at pairs of stations for the nighttime and daytime events is examined separately. Mass plots of SSC(H) at pairs of stations TRD/ABG, KOD/ABG and ANN/ABG are shown in Fig. 6. During the daytime
events the average ratio of DH was 2.5 for TRD/ABG, 2.2 for KOD/ABG and 1.2 for ANN/ABG. This just con®rms the equatorial enhancement of SSC(H) at low latitudes. During the nighttime events of SSC the average ratios of DH was 0.90 for TRD/ABG, 0.93 for KOD/ABG and 1.20 for ANN/ABG. Thus, on average the impulses of H during the nighttime events decreased towards the magnetic equator suggesting a reversal of the daytime enhancement of the DH due to SSC.
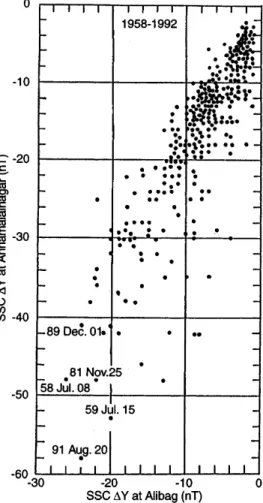
Figure 7 compares the impulse in Y with respect to corresponding impulse in H for individual events at Trivandrum, Annamalainagar and Alibag. The values of DY at TRD were always too small to show any de®nite relationship. The mass plots of DY and DH at ANN show a clear linear relationship, the magnitudes of )DY increasing with increasing DH. The average ratio of DY/DH was )0.37. It is to be noted that large impulses in Y ®eld were occasionally noted at ANN, number of SSC(Y) exceeds the value of )50 nT. Some of the largest SSC events recorded at Annamalainagar are indicated in the diagram. The amplitude of )DY at ABG also increased with corresponding DH, the average ratio was 0.25 (see Fig. 7).
The relationship between individual values of DZ versus DH for each of the stations TRD, ANN and ABG were studied separately for the nighttime and for the daytime events. Figure 8 shows the mass plots of the individual amplitudes of DZ and DH. The amplitude of DZ increased linearly with increase of DH. Thus it is
Fig. 4a±c. Solar daily variations of the amplitudes of SSC in a horizontal ®eld, H; b eastward ®eld, Y and c vertical ®eld, Z averaged over 1958± 1992 at TRD, KOD, ANN and ABG
seen that greater the intensity of storm, the greater were the impulses in the vertical component too. The ratio of DZ/DH at TRD was 1.3 for the nighttime and 1.1 for the daytime. The corresponding ratio DZ/DH at ANN was 0.52 during the nighttime and 0.33 during the daytime. At ABG the ratio of DZ/DH was 0.17 during the nighttime and 0.29 during the daytime. It is seen that the ratio of DZ/DH is smaller during the daytime than during the nighttime at equatorial electrojet stations only.
To test whether the individual values of the SSC(Y) at two stations have any relationship, Fig. 9 shows the mass plot of individual values of SSC(Y) at ANN and ABG. Clearly the impulses in the Y ®eld were always larger at ANN than at ABG. The average ratio of DY ANN/DY ABG was about 2.0. There were more than dozen cases during the period under study when DY at ANN was larger than 40 nT. The largest impulse in SSC (DY) was )70 h at 17 14 IT on 30 April, 1960. The next
two largest SSC (Y) were on 8 July, 1991 and 20 August, 1991.
The change in the eastward ®eld Y during the sudden commencement is supposed to be due to the alignment of magnetic ®eld due to SSC towards the direction of the geomagnetic dipole meridian.
The ratio of DY/DH can be estimated to give the direction of the SSC disturbance vector in the horizontal plane equal to sin)1(DY/DH) in degrees east of north
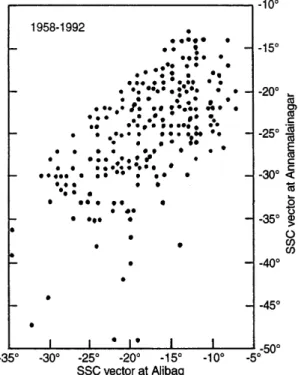
(magnetic). Figure 10 shows the histograms of the percent occurrence of dierent values of the direction of SSC disturbance vectors at Trivandrum, Kodaikanal, Annamalainagar and Alibag. The SSC vector angles is low and 2°E of north of magnetic north or practically due geographic north. At Kodaikanal the median value of SSC vector is 12°W of magnetic or 12°W of geographic north. At Annamalainagar the median vector is 20°W of magnetic or geographic north. At Alibag the SSC vector is 16°W of geographic as well as magnetic north. Thus the derivation of SSC vector is again largest at Annamalainagar. This suggests an additional westward deviation of the ®eld besides the eect due to the orientation of the disturbance vector with respect to the axis of earths magnetic ®eld.
Fukushima (1966) noted that at Kakioka, Japan, the average magnetic declination was 6.5°W and the geo-magnetic dipole meridian deviates 6.3° eastward from the geographic meridian. Therefore, the geomagnetic north deviates about 13° eastward from the local magnetic meridian. Fukushima (1966) showed that the main impulse of SSC at Kakioka, as expected, showed an eastward declination change in most of the SSCs. The deviation angle ranged from 10° to 50° with an average value of 18.2° eastward from the local magnetic merid-ian. Rastogi (1998) had shown that for Annamalainagar the geomagnetic dipole meridian was 3.6°W of the true magnetic meridian. The SSC disturbance vector at Annamalainagar ranged from 10°W to 40°W with a mean value of 20°W. The present study shows that the mean deviation of the SSC disturbance vector is 12°W at Kodaikanal and 16°W at Alibag and only 2°E at Trivandrum. Thus, the direction of disturbance vector follows the direction suggested by Fukushima (1966). There seem to be local irregularities due to the electrojet at Indian equatorial stations superposed over the global component of the disturbances.
To identify whether the individual values of the direction of SSC vector at ANN and ABG are arbitrary or have any relationship between themselves, in Fig. 11 are shown the mass plots of the direction of SSC vector at ANN against the same at ABG. In spite of a rather large scatter of points, a linear relation between the directions of vector at the two places is very evident. This suggests that besides the intensity of individual SSC magnitudes, there is another parameter possibly the direction of impact of the solar plasma at the magne-tosphere at the time of SSC. This needs the study of the direction of the SSC vector with respect to the longitude (h) of the interplanetary Magnetic Field during the SSC. The yearly magnetic data bulletins of Quetta (QUE) are available at the University of Sydney, Australia.
Fig. 5. Solar daily variations of the ratios of SSC amplitudes jDY=DHj and jDZ=DHj averaged over 1958±1992 at TRD, KOD, ANN and ABG
Using the Quetta data of SSC (67.0°E, 30.2°N) and at Alibag (72.9°E, 18.6°N), relationship between individual values of DY, DH and sin)1(DY/DH) were computed at
the two stations for the simultaneously available data during 1959±1968). The mass plots of DY, DH and of
the direction of disturbance vector for each event at ABG and QUE are shown in Fig. 12.
Clearly the amplitudes of the SSC(DH) were almost the same at ABG and QUE. The magnitudes of SSC(Y) at ABG seemed to be smaller than those of QUE, the ratio of DY(ABG)/DY(QUE) being about 0.7. Corre-spondingly the deviation of the disturbance vector westward from the magnetic north is slightly smaller at ABG than at QUE. The declination at Alibag is 0.8°W and at Quetta it is 1.3°E. Thus, when correction due to this eect is made, the deviation of the distur-bance vector from the geographical north may be taken as practically the same at Alibag and Quetta. Thus we may presume that the scatter of individual values of sin)1DY/DH at Alibag were primarily due to the varying
direction of the solar disturbance front with respect to the Earth's polar axis and not due to any random or experimental errors.
On the advice of the referee, I have computed the local time variation of the direction of the SSC disturbance vector during the dierent seasons of the year for each of the four Indian stations. The summer season is represented by J months (May, June, July and August), the E months consist of March, April, September and October, and D months (winter season) consist of November, December, January and February months. The resultant plots are shown in Fig. 13. The diurnal variation of disturbance vector at Alibag during summer months so clearly shows easterly de¯ection in the dawn hours and westerly de¯ection during dusk hours. It is further remarkable that during the winter months the tendency is reversed with westerly de¯ection
Fig. 6. Relationship between amplitudes in horizontal ®eld H, at TRD, KOD, ANN and ABG of daytime and nighttime SSCs
Fig. 7. Relationship between amplitudes of SSC DY and DH at the stations Annamalainagar (ANN) Trivandrum (TRD) and Alibag (ABG) of SSCs for 1958±1992
Fig. 8. Relationship between the individual amplitudes of DZ and DH due to SSC during daytime and nighttime for TRD, ANN and ABG for 1958±1992
Fig. 9. Relationship between the individual amplitudes of H due to SSC at ABG, and ANN during daytime and nighttime for 1958±1992
Fig. 10. Histograms for the direction of SSC disturbance vector sin)1
at dawn and easterly de¯ection during dusk hours. During equinoxes westerly de¯ections are evident at both pre-dawn and post sunset hours. Similar variations are seen at the other equatorial stations Annamalai-nagar and Kodaikanal. The de¯ections of vectors at Trivandrum are small and rather random. These results are a strong con®rmation of Fukushima's (1966) suggestion for the seasonal dependence of the deviation angle of SSC vector from the geomagnetic meridian around dawn and dusk hours.
Discussion
The geomagnetic sudden commencement is a clear global phenomenon with its onset almost simultaneous-ly everywhere on Earth. The source of SSCs are undoubtly the interplanetary shocks and discontinuities. Gold (1955) postulated the existence of an interplane-tary shock at the leading edge of the plasma cloud ejected from a solar ¯are. The sudden increase in the solar wind dynamic pressure at an interplanetary shock and discontinuities generate the sudden rise of the H ®eld observed at geomagnetic observatories round the world.
Rastogi and Patel (1975) showed that a sudden change in the vertical Z component of the Interplanetary Magnetic Field (Bz) is viewed as additional )v ´ Bz electric ®eld by the Earth, v being the velocity of the solar wind. This ®eld is transmitted almost instanta-neously to the ground magnetic observatories.
Because of high electrical conductivity of the equa-torial ionosphere, this sudden change of magnetopause electric ®eld causes a sudden impulse in the
magneto-Fig. 11. Mass plot of the direction of SSC disturbance vector at Annamalainagar versus that at Alibag for 1958±1992
Fig. 12. Relation between individual impulses in H, Y and distur-bance vector at Alibag and Quetta
grams and Doppler shift records at an equatorial electrojet station. A sudden change of Bz from south-ward to northsouth-ward direction would result to an increase of DH at the equatorial station. On the other hand a sudden change of Bz from northward to southward direction would produce a negative impulse in DH at ground level. Later Rastogi (1978) showed that when-ever SSC(H) in equatorial regions has a preliminary negative impulse preceding the main positive excursion, the solar plasma cloud causing the magnetospheric compression is associated with a northward turning of the IMF near the magnetopause. Later, Rastogi (1980) discussed the signatures of SSC on the magnetograms at equatorial stations Huancayo (HUA), Addis A bab (AAE) and noca (TTB) in relation to the changes in IMF obtained from satellites Explorer 33, 34 and 35.
Araki (1977) made a comprehensive study of SSCs using rapid run magnetograms from eight American zone stations. He identi®ed two components of SSC (1) a DL part caused by the compression of the magne-tosphere and (2) a DP part is caused by the ionospheric currents generated by the polar ionospheric electric ®eld. The polar electric ®eld was shown to propagate to the equatorial ionosphere as a zeroth order TM (transverse magnetic) wave guide mode (Kikuchi et al., 1978).
Thus, the eects of sudden commencement on the equatorial station consists of, ®rst, the primary source current in the magnetosphere and the inherent electric ®eld transmitted to the low latitudes from the magne-tosphere via high latitudes. During the nighttime the electric ®eld does not produce any ionospheric current
due to low conductivity of the equatorial ionosphere. During the daytime the electric ®eld from the magne-tosphere produces additional current at equatorial ionosphere modifying the signature on the magneto-grams. The latitudinal variations of these two source currents would be dierent as that in the magnetosphere is a distant and practically uniform source while that in the ionosphere is much closer with a large latitudinal variation in it.
The next step would be the electromagnetic induc-tions in the Earth's crust due to these current sources. The induction eects would include the eects due to regional anomalies of the conductivity structures of the underlying Earth crust.
Srivastava and Sankar Narayan (1967) pointed out the large value of DZ/DH due to SSC at Trivandrum. This anomaly was interpreted by Srivastava and Sankar Narayan (1970) in terms of ocean eects and electrical conductivity anomalies in the upper mantle at depths of 200±800 km. Srivastava and Abbas (1978) studied the induction arrows (Wiese vectors) for the nighttime SSCs. They found unusually large induction arrows at Trivandrum indicative of very strong induced current concentrations near and along the coast and the continental shelf and ¯ow from north to south along the east coast. These currents concentrate further as they pass through the narrow Palk Strait and the Gulf of Mannar between India and Sri Lanka on to Kanyakum-ari and the Trivandrum coasts. They turn northward along the west coast due to obstructions provided by the volcanic ridge of Lakshadweep, Minicoy and Amindini
Fig. 13. Local time variations of the direction of SSC disturbance vector during dierent seasons of the year at each of the four Indian magnetic observatories
Island lying some 300 km west of Trivandrum. A similar suggestion of the concentration of induced current in the Palk Strait was given by Takeda and Maeda (1978). A model calculation based on a thin ¯at layer in which only contrasts of conductivity due to the distribution of land and depth of sea is taken into account was shown to explain the anomalous distribution of SSCs in South Indian region during the nighttime (Takeda and Maeda, 1979). The anomalous behaviour of Z at equatorial stations in India has been interpreted by invoking the concept of currents through a conductor in the upper mantle or lower trust between India and Sri Lanka (Nityananda et al., 1977; Rajaram et al., 1979). Raja-ram et al. (1979) argued that the coastal eects or any other induction process based on the skin depth relationship cannot explain anomalous Z behaviour at Trivandrum for short period events like SSCs and long period events like Sq and Dst.
The present author feels that simple induction eects due to any kind of conductor cannot explain the observed anomalies of SSC signatures in H, Y and Z ®elds at Indian equatorial electrojet stations. Maeda et al. (1964) attributed the SC ®eld observed on the Earth's surface to the magnetic ®eld of an image dipole placed inside the intensi®ed solar wind plasma ap-proaching the Earth, assuming that the boundary of the approaching solar wind plasma is simply a ¯at plane. It would be extremely useful to study the SC disturbance vectors in relation with the solar wind plasma magnetic ®eld and pre-shock Interplanetary Magnetic Field. The data from Indian sector are probably the most useful ones because of the relative absence of local irregular-ities of the Earth's magnetic ®eld and because of the availability of new about a dozen of stations in this longitude sector for a period of about two decades.
Acknowledgements. R.G. Rastogi is also a Senior Scientist of the Indian National Science Academy, New Delhi. Thanks are due to Indian National Science Academy, New Delhi for the ®nancial help, to Gujarat University, Ahmedabad, Physical Research Laboratory, Ahmedabad and The University of Sydney, Sydney, Australia for the infrastructural and administrative facilities to the author. Thanks are also due to Profs. D.R.K. Rao, B.R. Arora, R. Rajaram, R.N. Singh and R.J. Srivastava for discussions during the course of work. The analysis has been possible only due to the excellent data set provided by the scientists from these observato-ries to the world community. The author is grateful to the referees for their suggestions and advice which has much improved the content of the study.
Topical Editor D. Alcayde thanks N. Fukushima and another referee for their help in evaluating this paper.
References
Araki, T., Global structure of geomagnetic sudden commence-ments, Planet. Space Sci., 25, 273±284, 1977.
Broun, J. A., (Ed) Trivandrum magnetic observations vol. 1, Henry, S King, London, 1874.
Chandra, H., and R. G. Rastogi, Geomagnetic storm eects on zonal and meridional equatorial electrojet currents, J. Geophys. Res., 102(A6), 11611±11617, 1997.
Chapman, S., The normality of geomagnetic disturbances at Huancayo, Geophys. Pure Appl., 14, 151±158, 1951.
Ferraro, V. C. A., and H. W. Unthank, Sudden commencements and sudden impulses in geomagnetism, Geo®s. Pure Appl., Milano, 20, 3±6, 1951.
Fukushima, N., Declination change of SC, its local-time and seasonal dependence at Kakioka, Japan, J. Geomagn. Geo-electr., 18, 99±101, 1966.
Fukushima, N., Transequatorial ®eld-aligned currents at low latitudes and their possible connection with the equatorial electrojet, Brazil. J. Geophys., 11, 291±302, 1993.
Fukushima, N., Some topics and historical episodes in geomagne-tism and ceromony, J. Geophys. Res., 99, 19113±19142, 1994. Gold, T., Gas dynamics of cosmic clouds, Eds. H Van de Hulet and
J.M.Burgers, North Holland, Amsterdam, 103 pp., 1955. Jacobs, J. A., and T. Obayashi, The average electric current system
for sudden commencements of magnetic storms, Geo®s. Pur. Appl., Milano, 34, 21±35, 1956.
Kikuchi, T., T. Araki, H. Maeda, and K. Maekawa, Transmission of polar electric ®eld to the equator, Nature, 272, 630±631, 1978. Maeda, H., and M. Yamamoto, A note on day time enhancement of
the amplitude of geomagnetic storm sudden commencements in the equatorial region, J. Geophys. Res., 65, 25±38, 1960. Maeda, R., N. Fukushima, and T. Nagata, Seasonal dependence of
SC ®eld in middle and low latitudes, J. Geomagn. Geoelectr., 16, 239±246, 1964.
Moos, N. A. F., Colaba magnetic data 846 to 1905. Part I: magnetic data and instruments: Part II: the phenomenon and its description, Bombay 1910.
Matsushita, S., Ionospheric variations associated with geomagnetic disturbances, J. Geomagn. Geoelectr., 3, 109±135, 1953. Natarajan, R., A study of sudden commencements of geomagnetic
storms at Trivandrum, Ind. J. Meteorol. Geophys., 20, 291±296, 1969.
Newton, H. W., Sudden commencement in the Greenwich magnetic records (1979-1944) and related sunspot data, Mon. Nat. R. Astr. Soc. Geophys. Suppl., 5, 159±185, 1948.
Nityananada, N., A. K. Agarwal, and B. P. Singh, Induction at short periods in the horizontal variation in the Indian Penin-sula, Phys. Earth Planet Inter., 15, p 5, 1977.
Obayashi, T., and J. A. Jacobs, Sudden commencements of magnetic storms and atmospheric dynamo action, J. Geophys. Res., 62, 589±616, 1957.
Rajaram, M., B. P. Singh, N. Nityananda, and A. K. Agarwal, Eect of the presence of a conducting channel between India and Sri Lanka Island on the feature of the equatorial electrojet, Geophys. J. R. Astronom Soc., 56, 127, 1979.
Rastogi, R. G., Solar ¯are crochet and sudden commencement in H within the electrojet region, J. Atmos. Terr. Phys., 27, 663±668 (1965).
Rastogi, R. G., Theory of preliminary negative impulse in storm sudden commencement in H at equatorial stations, Proc. Ind. Acad. Sci., 87A, 57±60, 1978.
Rastogi, R. G., Equatorial storm sudden commencements and interplanetary magnetic ®eld, Ind. J. Rad. & Space Phys. 9, 173± 181 (1980).
Rastogi, R. G., Geomagnetic disturbance eects on equatorial electrojet current, J. Geomagn. Geoelectr., 44, 317±324, 1992. Rastogi, R. G., Longitudinal variation of sudden commencement
of geomagnetic storm at equatorial stations, J. Geophys. Res., 98, 15 411±15 416, 1993.
Rastogi, R. G., Storm sudden commencements in geomagnetic H, Y and Z ®elds at the equatorial electrojet station, Annamalai-nagar, J. Atmos. Solar Terrs. Phys., 60, 1295±1302, 1998. Rastogi, R. G., and V. L. Patel, Eect of interplanetary magnetic
®eld on ionosphere over the magnetic equator, Proc. Ind. Acad. Sci. 82A, 121±141, 1975.
Rastogi, R. G., and K. N. Iyer, Quiet day variation of geomagnetic H ®eld at low latitudes, J. Geomagn. Geoelectr., 20(4), 461±479, 1976.
Rastogi, R. G., N. B. Trivedi, and N. D. Kaushika, Some relationships between the sudden commencements in H and
the equatorial electrojet, J. Atmos. Terr. Phys., 26, 771±776, 1964.
Sano, Y., Morphilogical studies on sudden commencements of magnetic storms using the rapid run magnetograms during the IGY, Mem. Kakioka Magnetic Observatory, 11(1), 1±52, 1963. Srivastava, B. J., and H. Abbas, An interpretation of Induction
arrows at Indian stations, JGG 32, 187±196, 1978.
Srivastava, B. J., and P. V. Sankar Narayan, Anomaly of geomagnetic time variations observed on Peninsular India, Proc. Symp. UMP Hyderabad, 1967, pp 165±174.
Srivastava, B. J., and P. V. Sankar Narayan, Anomolous geomag-netic variations in Peninsular India-ocean eect and upper mantle conductivity structure, Bull. NGRI, 8, 134, 1970. Srinivasamurthy, B., Sudden commencements and impulses in
Kodaikanal magnetograms±their hourly frequency, Ind. J. Meteorol. Geophys., 10, 209±212, 1959.
Sugiura, M., The solar diurnal variation in the amplitude of sudden commencements and geomagnetic storms at geomagnetic equator, J. Geophys. Res., 58, 558±559, 1953.
Sugiura, M., and S. Chapman, The average morphology of geomagnetic storms with sudden commencements, Abh. Akad. Wiss. Gottingen. Math. -Phys. K.1 Sonderh 4, 53pp, 1961. Takeda, M., and H. Maeda, Note on geomagnetic variations in the
equatorial zone, J. Geomagn. Geoelectr., 30, 121±123, 1978. Takeda, M., and H. Maeda, Eect of the coastline con®guration of
South Indian and Sri Lanka regions on the induced ®eld at short periods, J. Geophys., 45, 209±218, 1979.
Trivedi, N. B., and R. G. Rastogi, Studies of sudden changes in H and Z at equatorial stations in the Indian zone, Ann. Geophys-ical, 24, 1045±1051, 1968.
Watson, R. A., and D. H. McIntosh, Sudden commencements in geomagnetism, Nature, 165, 1018, 1950.
Wilson, C. R., and M. Sugiura, Hydromagnetic interpretation of sudden commencements of magnetic storms, J. Geophys. Res., 66, 4097±4111, 1961.