HAL Id: hal-00301121
https://hal.archives-ouvertes.fr/hal-00301121
Submitted on 16 Feb 2004HAL is a multi-disciplinary open access
archive for the deposit and dissemination of sci-entific research documents, whether they are pub-lished or not. The documents may come from teaching and research institutions in France or abroad, or from public or private research centers.
L’archive ouverte pluridisciplinaire HAL, est destinée au dépôt et à la diffusion de documents scientifiques de niveau recherche, publiés ou non, émanant des établissements d’enseignement et de recherche français ou étrangers, des laboratoires publics ou privés.
Passenger aircraft project CARIBIC 1997?2002, Part I:
the extratropical chemical tropopause
A. Zahn, C. A. M. Brenninkmeijer, P. F. J. van Velthoven
To cite this version:
A. Zahn, C. A. M. Brenninkmeijer, P. F. J. van Velthoven. Passenger aircraft project CARIBIC 1997?2002, Part I: the extratropical chemical tropopause. Atmospheric Chemistry and Physics Dis-cussions, European Geosciences Union, 2004, 4 (1), pp.1091-1117. �hal-00301121�
ACPD
4, 1091–1117, 2004CARIBIC Part I: The extratropical chemical tropopause A. Zahn et al. Title Page Abstract Introduction Conclusions References Tables Figures J I J I Back Close
Full Screen / Esc
Print Version Interactive Discussion
© EGU 2004
Atmos. Chem. Phys. Discuss., 4, 1091–1117, 2004 www.atmos-chem-phys.org/acpd/4/1091/
SRef-ID: 1680-7375/acpd/2004-4-1091 © European Geosciences Union 2004
Atmospheric Chemistry and Physics Discussions
Passenger aircraft project CARIBIC
1997–2002, Part I: the extratropical
chemical tropopause
A. Zahn1, C. A. M. Brenninkmeijer2, and P. F. J. van Velthoven3 1
Institute of Meteorology and Climate Research, Karlsruhe, Germany
2
Max-Planck-Institute for Chemistry, Mainz, Germany
3
Royal Netherlands Meteorological Institute (KNMI), De Bilt, The Netherlands
Received: 16 December 2003 – Accepted: 5 February 2004 – Published: 16 February 2004 Correspondence to: A. Zahn ([email protected])
ACPD
4, 1091–1117, 2004CARIBIC Part I: The extratropical chemical tropopause A. Zahn et al. Title Page Abstract Introduction Conclusions References Tables Figures J I J I Back Close
Full Screen / Esc
Print Version Interactive Discussion
© EGU 2004
Abstract
As part of CARIBIC (Civil Aircraft for Regular Investigation of the Atmosphere Based on an Instrument Container) ozone (O3) and carbon monoxide (CO) were measured using a Boeing 767-ER passenger aircraft during 75 intercontinental flights at 9–12 km altitude between November 1997 and April 2002. Emphasis of Part I is on a better
char-5
acterisation of the extratropical tropopause regarding chemical composition, while Part II focuses on bi-directional cross-tropopause tracer exchange, in particular its seasonal variation. Here, an empirical definition of a chemical tropopause for the extratropics is proposed. It is based upon the often abrupt change of the correlation among O3 and CO observed when passing from tropospheric air into stratospheric air and vice versa.
10
This abrupt change results from the contrasting processes that control the relationship between O3 and CO in upper tropospheric air and lowermost stratospheric air. The applicability of the chemical tropopause definition varies with latitude and longitude. Over the North Atlantic, the success rate amounted to only ∼50%, but over Eastern Europe to ∼79%. Explanations for this finding are given. Predictions about the
appli-15
cability of the new method outside the CARIBIC flight corridor cannot be made. The typical uncertainty of the determination of the chemical tropopause was ∼(150–200) m in the vertical. The chemical tropopause was found to agree well with a dynamical tropopause threshold value of ∼2 potential vorticity units (PVU). The method moreover allows for a determination of the ozone tropopause threshold value O3(TP). It showed
20
a sine seasonal variation with a maximum of ∼123 ppbv in April/May and a minimum in October/November of ∼71 ppbv. For an explanation, see Part II.
1. Introduction
In general parlance, the tropopause is a curved surface that demarcates the turbulent troposphere from the overlying stably stratified stratosphere. Although both spheres
25
surpris-ACPD
4, 1091–1117, 2004CARIBIC Part I: The extratropical chemical tropopause A. Zahn et al. Title Page Abstract Introduction Conclusions References Tables Figures J I J I Back Close
Full Screen / Esc
Print Version Interactive Discussion
© EGU 2004
ingly, there still is no physically based tropopause definition available which works re-liably under all meteorological conditions and latitudes (Wirth, 2000). This situation arises from the fact that the physical nature of the tropopause is not yet well-understood (Thuburn and Craig, 2000; Haynes et al., 2001a). Hence, all tropopause definitions in use are basically empirical. With one exception (see below), they rely on physical
pa-5
rameters that abruptly change when moving from one sphere into the other; we may name them physical or meteorological tropopause definitions. More crucial concerning the budgets of trace constituents however is to know, what the “chemical boundary” between troposphere and stratosphere looks like, and how this chemical tropopause relates to the physically defined tropopauses.
10
Tropopause definitions deployed for the tropics such as the cold-point tropopause, the hygropause (minimum in the H2O mixing ratio), or the clear-sky radiative tropopause (Haynes et al., 2001b) are not considered here. We concentrate on the extratropics where generally the thermal tropopause (WMO, 1957) and the dynami-cal tropopause (WMO, 1985) are applied. They are based on abrupt changes of the
15
vertical temperature lapse rate and the potential vorticity, respectively.
Although mostly satisfying our needs, there are several applications for which these two physical tropopauses are not suitable, namely, when a spatially highly resolved description of the tropopause is required or when the transport of trace constituents across the tropopause is to be studied. This cross-tropopause exchange of trace
con-20
stituents can strongly differ from the exchange of mass. Bi-directional cross-tropopause exchange might for instance cause a large net tracer flux without any net mass flux.
The latter processes may better be investigated with a tropopause definition that relies on an air component that is inert over the air transport time scale (at least weeks) and that is also in situ measurable with high accuracy as well as high temporal and
25
spatial resolution. Ozone fulfills these requirements, and indeed the O3 mixing ratio is utilised in the third most applied tropopause definition in the extratropics, the ozone tropopause (Bethan et al., 1996; Thouret et al., 1998; Talbot et al., 1999). It is the sole chemical tropopause presently in use. A shortcoming of the ozone tropopause
ACPD
4, 1091–1117, 2004CARIBIC Part I: The extratropical chemical tropopause A. Zahn et al. Title Page Abstract Introduction Conclusions References Tables Figures J I J I Back Close
Full Screen / Esc
Print Version Interactive Discussion
© EGU 2004
however is that the choice of the actual ozone tropopause threshold value, which may vary in space (latitude, longitude) and season, is not well-known yet. Only recently Brunner et al. (2001) applied a combination of in situ O3observations and ECMWF PV data, and indeed found evidence that ozone undergoes remarkable seasonal variation at the dynamical tropopause. In summary, with regard to trace species, the tropopause
5
is currently not well-defined.
The dilemma just described becomes particularly evident when interpreting mea-surements conducted from passenger aircraft that cruise at typically 9–12 km. Espe-cially for data collected on such a platform, an accurate and spatially highly resolved illustration of the tropopause is required. This requirement arises from the fact that the
10
extratropical tropopause is highly structured and rapidly varying and thus can repeat-edly be crossed by a passenger aircraft within one single flight.
Facing this challenge and also to better localise the tropopause with regard to a chemical boundary between tropospheric and stratospheric air, here, the definition of an improved chemical tropopause is proposed. The basic idea this definition rests on
15
is outlined in a “New Directions” letter in Atmospheric Environment (Zahn and Bren-ninkmeijer, 2003). The new definition relies on the contrasting relationships of certain longer-lived trace gases in tropospheric air and stratospheric air. Not just one trace gas is considered, as in the case of the ozone tropopause, but two, namely apart from ozone as a proxy of stratospheric air, also a proxy of tropospheric air, for which carbon
20
monoxide will be chosen. Both these trace gases can routinely be measured by aircraft with high precision, accuracy and frequency.
The O3and CO measurements analysed here were performed aboard a Boeing 767-ER flying at 9–12 km altitude (Sect. 2), project CARIBIC (Brenninkmeijer et al., 1999). During ∼83% of the flight time tropospheric air was sampled and during ∼17%
strato-25
spheric air. The tropospheric data were comprehensively discussed recently (Zahn et al., 2002), with emphasis on the O3budget of the upper troposphere. That paper also gives a list of all CARIBIC flights to the Indian Ocean and an overview of the meteo-rological conditions. The distinction between tropospheric and stratospheric data was
ACPD
4, 1091–1117, 2004CARIBIC Part I: The extratropical chemical tropopause A. Zahn et al. Title Page Abstract Introduction Conclusions References Tables Figures J I J I Back Close
Full Screen / Esc
Print Version Interactive Discussion
© EGU 2004
achieved by applying the chemical tropopause definition proposed here.
A prerequisite for understanding the nature of the chemical tropopause is a knowl-edge of the dynamical key processes that control the relationship of long-lived tracer around the extratropical tropopause (see Sect. 3). Most importantly, just above the extratropical tropopause a mixing layer is present, in which the irreversible mixing
be-5
tween “upwelling” tropospheric air and “downwelling” lower stratospheric air occurs (Bujok, 1998; Fischer et al., 2000; Hoor et al., 2002). This mixing layer is usually identified by mixing lines between long-lived tracers. The present paper demonstrates that the lower border of the tropopause mixing layer can be viewed as a chemical tropopause.
10
2. Flight overview, meteorology, and experimental details
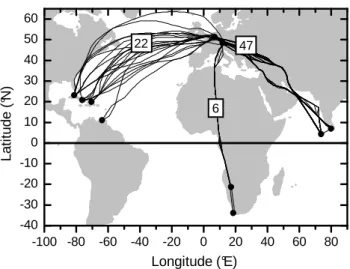
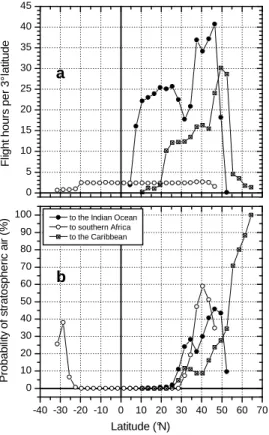
Between November 1997 and April 2002, altogether 75 single measurement flights (10–12 h each) were conducted at 9–12 km altitude from Germany to the three desti-nations Indian Ocean, southern Africa, and the Caribbean (see flight tracks in Fig. 1).
The latitudinal distributions of the number of flight hours and the frequency of
en-15
counters of stratospheric air along the three flight routes are indicated in Fig. 2. Details about the flights to the Indian Ocean (date, time, destination, list of running instruments), a description of the O3and CO instruments, and an overview of the mete-orological conditions along the CARIBIC flight track can be found in Zahn et al. (2002). Here, only an abstract is given.
20
From November 1997 to April 2001, 47 flights between Germany (Munich, 48.4◦N, 11.8◦E, or D ¨usseldorf, 51.4◦N, 6.8◦E) and the Indian Ocean (Male, 4.2◦N, 73.7◦E, Maldives, or Colombo, 6.9◦N, 80.0◦E, Sri Lanka) were carried out. Mean cross-sections between 1000 and 100 hPa (∼16 km) of diverse meteorological parameters such as potential temperature (θ), wind speed, and potential vorticity and
three-25
dimensional 5-day back-trajectories are depicted for summer and winter in Figs. 2 and 3 in Zahn et al. (2002). Crucial for the present analysis is that stratospheric air was
ACPD
4, 1091–1117, 2004CARIBIC Part I: The extratropical chemical tropopause A. Zahn et al. Title Page Abstract Introduction Conclusions References Tables Figures J I J I Back Close
Full Screen / Esc
Print Version Interactive Discussion
© EGU 2004
always intersected between the polar jetstream in the north and the subtropical jet-stream in the south (the latter marked in the month-latitude distribution of wind speed along the flight route, Zahn et al., 2002, Fig. 2). Important is also that the mid-latitude tropopause shows higher potential temperatures in summer, so that potential isentropic cross-tropopause transport occurs at θ-surfaces that are ∼(20–25) K higher in summer
5
than in winter.
Altogether six flights were conducted between Germany and southern Africa (Wind-hoek, 21.4◦S, 17.2◦E, Namibia, four flights, and Capetown, 34.0◦S, 18.6◦E, South Africa, two flights), all in the year 2000. The northern hemispheric (NH) stratosphere was reached during four of the six flights, invariably over the Mediterranean Sea and
10
Central Europe. The SH stratosphere was briefly intersected over South Africa during one flight. Another 22 flights took place between Germany and the Caribbean (Isla Margarita, Cuba, and Dominican Republic, 10–23◦N, 64–81◦W) between May 2001 and April 2002.
The potential vorticity data along the CARIBIC flight routes were extracted from
me-15
teorological data provided by the European Centre for Medium Range Weather Fore-cast (ECMWF) (6-hourly, 31 model levels, 1◦× 1◦horizontal resolution).
The modified ozone photometer (Environnement O3-41M, Paris, France) provided spot (2.2 s) measurements (covering a flight distance of ∼0.55 km) with a repetition rate of 17 s (∼4.25 km). Before each flight, the instrument was calibrated at O3mixing
20
ratios from 0 to 500 ppbv. The overall uncertainty is 4 ppbv or 4%, whichever is largest. The gas chromatograph (RGA3, Trace Analytical, Menlo Park, CA, USA) with CO de-tector (based on the reaction CO+ HgO → CO2+ Hg sensed by its light absorption) provided four spot (15 s) measurements (∼3.75 km) for each 130 s (∼32 km), sand-wiched by the analysis of two CO standards in the range of 50 and 180 ppbv
(last-25
ing another 260 s). The total uncertainty of the CO data is 3 ppbv between 30 and 200 ppbv. The instrument is calibrated relative to an absolute scale (Brenninkmeijer et al., 2001), which agrees with the revised NOAA/CMDL scale (Novelli et al., 2003).
ACPD
4, 1091–1117, 2004CARIBIC Part I: The extratropical chemical tropopause A. Zahn et al. Title Page Abstract Introduction Conclusions References Tables Figures J I J I Back Close
Full Screen / Esc
Print Version Interactive Discussion
© EGU 2004
3. The O3-CO relationship in the lowermost stratosphere
As shown next, within the LMS the O3-CO relationship primarily gives constraints on transport, in contrast to the troposphere where it primarily contains information on chemical processing.
In the boundary layer (BL), photochemistry mostly results in positive O3-CO
co-5
variations (Chin et al., 1994; Parrish et al., 1998, and references therein), because the major O3 precursors (most importantly NOx) and CO have the same major source types, namely the combustion of biomass and fossil fuel. Net O3 formation is mostly NOx-controlled and thus finishes after about one day in the BL (the local lifetime of NOx). Thereafter, a positive correlation among CO and O3 remains. Negative O3
-10
CO correlations occasionally observed especially during winter are due to O3surface deposition and extended night-time heterogeneous loss of NOx.
In the upper troposphere (UT), the latter two processes are negligible. At first glance one may assume to find any relationship between O3and CO, i.e. air masses showing positive, negative or not any co-variation between O3and CO. However, this problem
15
mainly arises from the fact that virtually all airborne sampling platforms such as aircraft or balloons gather data from many different types of air masses. As shown by Zahn et al. (2002), meaningful O3-CO correlations, i.e. those that contain information on chemical processing that have occurred in the examined air mass, can only be inferred from data that were collected (i) at almost constant pressure and (ii) in small sampling
20
areas with a horizontal extension of less than ∼500 km. Breaking this rule mostly leads to O3-CO correlations that constitute mixing lines between air masses having a different chemical composition, e.g. are due to vertical or horizontal gradients of O3and CO.
In the UT, NOx has other major in situ sources such as lightning and aviation, so that CO may loose its property as a measure of net O3 production. Hence, compact
25
positive O3-CO co-variations are mostly encountered only in relatively young pollution plumes well-distinguishable from the background atmosphere (Fishman et al., 1980; Chameides et al., 1989; Andreae et al., 1994, 2001; Lelieveld et al., 1996; Mauzerall
ACPD
4, 1091–1117, 2004CARIBIC Part I: The extratropical chemical tropopause A. Zahn et al. Title Page Abstract Introduction Conclusions References Tables Figures J I J I Back Close
Full Screen / Esc
Print Version Interactive Discussion
© EGU 2004
et al., 1998). Besides that, significant O3-CO correlation patterns only appear as av-erages over many air masses (Fishman and Seiler, 1983; Parrish et al., 1999; Zahn et al., 2002).
For the lowermost stratosphere (LMS), the O3-CO relationship is clarified using Fig. 3. It explains the cause for the well-known negative O3-CO correlation in the
5
LMS and illustrates the information that can be inferred from this correlation.
Stratospheric O3 enters the LMS from above, the (380–400) K θ-surface. In the LMS, ozone is a quasi-inert transport tracer, owing to its long local chemical lifetime on the order of 1 year (Solomon et al., 1985). Without dilution by in-flowing (O3-poor) tropospheric air, the O3 mixing ratio would thus only slightly decline from the (380–
10
400) K θ-surface (i.e. the source) towards the tropopause (i.e. the sink), as a first guess visualised by the thin line in Fig. 3c. Observed however are much lower O3 mixing ratios year-around, especially in the lower LMS, as indicated by a typical vertical O3 sounding (dots) collected near the CARIBIC flight at Athens, Greece. Therefore, as a consequence of the long lifetime of O3 in the LMS, this O3 decrease within the LMS
15
must be due to dilution by in-flowing O3-poor tropospheric air.
The situation is inverse for CO. For the tracer CO, the lower boundary of the LMS, the tropopause acts as source region. Without in-flux of (CO-rich) tropospheric air, the CO mixing ratio in the LMS would be 10–20 ppbv only (thin line in Fig. 3d). This is the background CO level (Flocke et al., 1999; Herman et al., 1999), maintained by the
20
chemical equilibrium between CO production due to weak oxidation of hydrocarbons (mainly methane) and CO loss due to its reaction with OH. Observations however show much higher CO mixing ratios (Seiler and Warneck, 1972; Hipskind et al., 1987; Herman et al., 1999; Waibel et al., 1999), especially just above the tropopause (dots). The only possible reason for this CO enhancement within the LMS is in-flow of CO-rich
25
tropospheric air, as in the case of O3.
A powerful tool to investigate this extratropical troposphere-to-stratosphere (T-S) transport is to plot the tracer mixing ratios shown as vertical profiles in Fig. 3c and d against each other, as done in Fig. 3e. Without T-S transport, a L shape tracer-tracer
ACPD
4, 1091–1117, 2004CARIBIC Part I: The extratropical chemical tropopause A. Zahn et al. Title Page Abstract Introduction Conclusions References Tables Figures J I J I Back Close
Full Screen / Esc
Print Version Interactive Discussion
© EGU 2004
relation would appear (thin line). Observations, e.g. by Fischer et al. (2000) and Hoor et al. (2002) however show a compact negative correlation (dots), removing the irregular behaviour visible in the individual vertical profiles.
A prerequisite for compact relationships between longer-lived tracers in the strato-sphere is that isentropic (quasi-horizontal) mixing is much faster than cross-isentropic
5
(diabatic) transport, and that both these processes also occur faster than changes in the tracer concentrations due to chemical processing. In that case, the tracers are in so-called slope equilibrium (Mahlmann et al., 1986; Plumb and Ko, 1992). Usually, rela-tionships among such tracers are curved. However, Waugh et al. (1997) and Plumb et al. (2000) demonstrated that mixing of different air masses (or reservoirs) causes
atyp-10
ical, linear tracer-tracer relations connecting the correspondingly different locations of the usually curved relationship. Therefore, the end points of such linear mixing lines fully characterise the composition of the two mixing reservoirs.
This technique was applied to data collected by aircraft around the mid- and high-latitude tropopause region (project STREAM) (Bujok, 1998; Fischer et al., 2000; Hoor
15
et al., 2002). Indeed, during all nine lower stratospheric flights compact, quite linear mixing lines between O3and CO were observed.
During CARIBIC, this mixing layer was monitored over a period of four consecutive years. These data inter alia provide information on seasonal variation of the mixing layer.
20
4. Definition of a chemical tropopause
As described in Sect. 3, the O3-CO relationship is controlled by different processes in the upper troposphere and lowermost stratosphere. Therefore, the O3-CO relationship may show a major discontinuity at the extratropical tropopause that can even be applied for defining a tropopause.
25
This hypothesis is confirmed in Fig. 4, where the O3-CO relationship for a typical CARIBIC flight is depicted. The tropospheric and stratospheric branches are clearly
ACPD
4, 1091–1117, 2004CARIBIC Part I: The extratropical chemical tropopause A. Zahn et al. Title Page Abstract Introduction Conclusions References Tables Figures J I J I Back Close
Full Screen / Esc
Print Version Interactive Discussion
© EGU 2004
discernable; the transition between the two is at an O3mixing ratio of ∼92 ppbv. The tropospheric branch is characterised by (i) low O3 mixing ratios, (ii) high and more variable CO values, and (iii) no- or positive co-variations of the two gases. In contrast, the lower stratospheric branch shows a compact negative O3-CO correlation.
The lower part of this negative correlation constitutes a compact linear mixing line,
5
i.e. marks a well-mixed layer between tropospheric air and stratospheric air. This layer will be named as “extratropical tropopause mixing layer”, consistent with Bujok (1998), Fischer et al. (2000), and Hoor et al. (2002). In Fig. 4, the mixing layer is estimated to span an ozone range ∆O3(LMS) of ∼300 ppbv, and the slope of the linear mixing line ∆O3(LMS)/∆CO(LMS) amounted to −6.7 ppbv/ppbv. During the 47 tropopause
10
crossings that reached sufficiently deep into the LMS, ∆O3(LMS) varied between 150 ppbv and 403 ppbv, and ∆O3(LMS)/∆CO(LMS) varied between −2.7 ppbv/ppbv and −7.0 ppbv/ppbv. As shown in Part II of this paper, these numbers are primarily a function of season, as the mixing ratios of O3 and CO undergo considerable seasonal variation in the LMS. Thus and because of the small number of samplings in the LMS,
15
it makes no sense to assess these numbers statistically.
Based on these findings, we propose to define the chemical tropopause equivalent to the definition of the thermal tropopause that is defined as the lowest level of a layer at least ∆z = 2 km thick, in which the vertical temperature lapse rate ∆T/∆z does not exceed 2 K km−1 (WMO, 1957). For that, we move from the “temperature –
alti-20
tude” space into a “tracer – tracer” space. We use, instead of∆z a certain O3range, ∆O3, and instead of∆T/∆z a certain O3-CO slope,∆O3/∆CO. We define the
chem-ical tropopause, TPchem, as the lower boundary of a layer in which O3 increases by 150 ppbv and the slope of the O3-CO regression line is less than −2 ppbv/ppbv. These numbers were valid for all three CARIBIC flight routes (Fig. 1). Importantly however,
25
the TPchem was not always as clearly discernable as in Fig. 4, and therefore was de-tected with a different rate of success and uncertainty along the different flight routes (Sect. 5.1).
ACPD
4, 1091–1117, 2004CARIBIC Part I: The extratropical chemical tropopause A. Zahn et al. Title Page Abstract Introduction Conclusions References Tables Figures J I J I Back Close
Full Screen / Esc
Print Version Interactive Discussion
© EGU 2004
first, the different slope of the O3-CO regression line in tropospheric and stratospheric air, and second, the greater compactness of the stratospheric branch compared to the upper troposphere.
The spatial uncertainty in the determination of the chemical tropopause depends on, (i) the temporal resolution and accuracy of the O3 and CO instruments used, (ii) the
5
angle the measurement platform crosses the tropopause, i.e. the rate of change of O3and CO, and (iii) the instantaneous variability of O3and CO, especially in the tropo-spheric branch as it forms the base line from which the stratotropo-spheric data branch-off. In the present case with the horizontally flying CARIBIC platform and even with the rather slow but precise CO instrument, the typical uncertainty of the chemical tropopause is
10
∼(150–200) m in the vertical and ∼(100–200) km in the horizontal.
5. Observations
5.1. Applicability of the chemical tropopause definition
For all CARIBIC flights discussed here, the chemical tropopause was inferred by visual determination of the transition point on an O3-CO correlation plot for each flight. The
15
following features emerged:
(i) Alone due to the low number of data points available or the slow measurement frequency of the CO instrument (∼2 min, Sect. 2), respectively, the tropopause defini-tion described in Sect. 4 could not be applied in ∼15% of all flights. This failure was generally due to insufficient data variability in the tropospheric air masses which made
20
it impossible to precisely determine a base line from which the negative correlation line in stratospheric air branches off.
(ii) During all flights that reached at least 1.5–2.0 km into the lowermost stratosphere, a compact, fairly linear (i.e. weakly curved) mixing line between O3and CO emerged (Fig. 4 is a typical example). During ∼15% of these flights, individual data points were
25
individ-ACPD
4, 1091–1117, 2004CARIBIC Part I: The extratropical chemical tropopause A. Zahn et al. Title Page Abstract Introduction Conclusions References Tables Figures J I J I Back Close
Full Screen / Esc
Print Version Interactive Discussion
© EGU 2004
ual air masses with elevated CO mixing ratios were encountered never higher than ∼1.0 km above the chemical tropopause. We thus attribute them to small-scale and shallow injection of tropospheric air, most likely driven by convection. The occasional occurrence of convection into the LMS accompanied with enhancements of tracer of pollution was found before, e.g. by Poulida et al. (1996) or Fischer et al. (2002). These
5
individual outliers account to less than 3% of all data points collected in the LMS and did not affect the determination of the chemical tropopause.
(iii) The sharpness of the chemical tropopause significantly varied with flight route. The tropopause could be determined during 33 (79%) of all 42 stratospheric flights along the Germany – India route, but only during 12 (50%) of all 24 stratospheric flights
10
along the Germany – Caribbean route, i.e. over the Atlantic. The reason is that over the Atlantic also upper tropospheric air often showed a negative O3-CO correlation and thus could not accurately be distinguished from the stratospheric data.
We assume that this finding can mainly be assigned to the peculiar meteorological condition prevailing along the Germany – Indian flight route. The stratospheric air was
15
mostly encountered over the Irak/Iran near low lying tropopauses, i.e. within weakly pronounced tropopause fold structures. There, high wind speeds prevail and the con-fluence of descending stratospheric air and ascending (potentially polluted) lower tro-pospheric air is likely. This claim is supported by (i) model calculations (Li et al., 2001) which predict a pronounced ozone maximum in the UT over the Middle East and (ii)
20
meteorological analysis by Stohl (2001), Wernli and Bourqui (2002), and Sprenger and Wernli (2003), who identified the UT over the Middle East as a favoured outflow area of warm conveyor belts (WCB) which often contain polluted surface air. Above the North Atlantic, the CARIBIC tropopause crossings occurred further north than along the In-dian route (Fig. 2), and (apart from summer) mainly north-west of the major outflow
25
area of the North Atlantic WCB. Stohl (2001, Fig. 1) estimates the major WCB out-flow area over the North Atlantic close to Africa and Europe, i.e. east of the tropopause crossings occurred during the Caribbean route. Only in summer, the WCB outflow area is assumed to cover also the mid North Atlantic (Stohl, 2001).
ACPD
4, 1091–1117, 2004CARIBIC Part I: The extratropical chemical tropopause A. Zahn et al. Title Page Abstract Introduction Conclusions References Tables Figures J I J I Back Close
Full Screen / Esc
Print Version Interactive Discussion
© EGU 2004
5.2. Seasonal ozone variation at the chemical tropopause
Both the proposed chemical tropopause and the ozone tropopause rely on longer-lived trace species and thus may be assumed to describe the same material surface. However, the ozone threshold value is currently not well-defined.
The chemical tropopause definition suggested here enables an in situ inference of
5
the local O3tropopause threshold value O3(TPchem). For instance, during the January 1999 flight shown in Fig. 4, O3(TPchem) amounted to 92 ppbv. Processing of the entire CARIBIC data record reveals that the O3mixing ratio at the chemical tropopause, first, undergoes considerable seasonal variation, and second, depends significantly on the particular CARIBIC flight route (Fig. 5).
10
Along the flight routes Germany – Indian Ocean (full dots) and Germany – southern Africa (stars), O3(TPchem) can be well approximated by a sine curve that maximises around 1 May (at ∼123 ppbv) and minimises 6 months later around 1 November (at ∼71 ppbv):
O3(TPchem)= 97 + 26 · sin[2π · (doy − 30)/365] (1)
15
in ppbv; doy denotes day of year. Along the route Germany – Caribbean, however, dur-ing all four (bi-directional) summer flights (25 June to 27 August) higher O3mixing ratios at the chemical tropopause were observed. Note that during summer this flight route is downwind of the US and is often impacted by polluted air masses exported from the US (see discussion above, and Stohl, 2001). Unfortunately, during the other seasons,
20
the chemical tropopause could mostly not be determined over the North Atlantic (see Sect. 5.1).
Only recently Brunner et al. (2001) found a clear seasonal O3variation at the dynami-cal tropopause, in the midlatitudes with O3mixing ratios of ∼100 ppbv in spring/summer and ∼70 ppbv in autumn/winter at the 2 PVU surface, in agreement with our findings.
25
It should be realised that the ozone tropopause threshold value O3(TPchem) of 100 ppbv used in many studies wrongly attributes in August-January stratospheric air with O3volume mixing ratios below 100 ppbv to the troposphere and for the rest of the
ACPD
4, 1091–1117, 2004CARIBIC Part I: The extratropical chemical tropopause A. Zahn et al. Title Page Abstract Introduction Conclusions References Tables Figures J I J I Back Close
Full Screen / Esc
Print Version Interactive Discussion
© EGU 2004
year tropospheric air with O3in excess of 100 ppbv to the stratosphere (Fig. 5). As a consequence, derived seasonal variations of upper tropospheric O3become strongly damped in amplitude and phase-shifted. For example, the well-known springtime O3 maximum would appear too early in the year.
5.3. Comparison between chemical and dynamical tropopause
5
Both the chemical tropopause and dynamical tropopause are material surfaces for adi-abatic frictionless flow, unlike the thermal tropopause. Thus, assuming that the two corresponding threshold values are correctly chosen, both the chemical- and dynam-ical tropopause should coincide. As the CARIBIC O3 and ECMWF-provided PV data (see Sect. 2) are available with a quite different temporal and spatial resolution (and
10
thus local uncertainty), it however makes little sense to extract individual PV values from the coarse-grain ECMWF field for each crossing of the in situ detected chemi-cal tropopause. More information can be gained by comparing averaged data, as in Fig. 6, where the mean seasonal ozone variation observed during all CARIBIC flights is depicted at PV iso-surfaces of 1.5, 2.0, and 2.5 PVU, respectively.
15
Figure 6 demonstrates that ozone undergoes a similar seasonal change at the dy-namical tropopause as at the chemical tropopause. However, the seasonal amplitude is even more pronounced and also a significant time lag is manifest, which declines with increasing PV values, relative to the chemical tropopause from ∼5.5 weeks at 1.5 PVU, ∼4 weeks at 2.0 PVU to ∼2.5 weeks at 2.5 PVU. The seasonal ozone
varia-20
tion at PV=2 PVU agrees best with the one at the chemical tropopause (Eq. 1). It can be well-approximated by
O3(2 PVU)= 90 + 30 · sin[2π · (doy − 60)/365] (2)
in ppbv; doy denotes day of year. We assume that this time lag can be mainly at-tributed to the different data treatment based on which the two ozone variations are
25
inferred. The ozone variation at the chemical tropopause are derived from data that were almost exclusively collected near the jet stream, i.e. in air masses that freshly
ACPD
4, 1091–1117, 2004CARIBIC Part I: The extratropical chemical tropopause A. Zahn et al. Title Page Abstract Introduction Conclusions References Tables Figures J I J I Back Close
Full Screen / Esc
Print Version Interactive Discussion
© EGU 2004
descended from the lower stratosphere. In contrast, the ozone variation at the dy-namical tropopause are derived simply by attributing to each selected PV iso-surface of 1.5, 2.0, and 2.5 PVU the mean O3 concentration measured during CARIBIC. As the ECMWF PV data are less reliable in distinguishing tropospheric and stratospheric air, a lot of tropospheric O3 data were inevitably considered in this procedure. In the
5
upper troposphere, it is well-known that ozone maximises in summer and not in late spring as in the lower stratosphere (Thouret et al., 1998; Logan, 1999a, b). Hence, the inferred ozone variation at the PV iso-surfaces should show a bias towards summer, which moreover decreases with higher PV values, as observed.
6. Conclusions
10
An extensive 4.5-year record of airborne O3and CO data collected onboard passenger aircraft in the UTLS is analysed. Part I focuses on a better characterisation of the tropopause from the perspective of chemical composition, while Part II concentrates on the bi-directional tracer transport across the extratropical tropopause. The major findings of both parts are derived by interpreting observed co-variations between O3
15
and CO and their seasonal variations relative to the tropopause.
The observed change in the correlation among O3and CO is often sufficiently abrupt to define a chemical tropopause equivalent to the thermal tropopause: the chemical tropopause, TPchem, is defined as the lower boundary of a layer in which O3increases by 150 ppbv and the slope of the O3-CO regression line is less than −2 ppbv/ppbv.
20
The success rate of this method depends on the instantaneous meteorological condi-tions. Moreover, for applying this method the measurement platform has to immerse at least 1.0 km into the lowermost stratosphere . The mean success rate during CARIBIC 1997–2002 was ∼60% (at an altitude of 9–12 km and 47 tropopause crossings), and varied significantly with season and flight route. Predictions about the general
appli-25
cability in the UTLS, i.e. outside the CARIBIC flight corridors and at other altitudes, cannot be made.
ACPD
4, 1091–1117, 2004CARIBIC Part I: The extratropical chemical tropopause A. Zahn et al. Title Page Abstract Introduction Conclusions References Tables Figures J I J I Back Close
Full Screen / Esc
Print Version Interactive Discussion
© EGU 2004
Main strength of this new definition is the ability (i) to detect in situ and quite ac-curately the tropopause from flying platforms (aircraft), (ii) to better characterise the tropopause from the perspective of chemical composition, and thus (iii) to compare the bi-directional transport of chemical constituents (tracers) across the tropopause with the transport of mass.
5
The method for instance allows for a determination of the ozone tropopause thresh-old value O3(TP). Along the three CARIBIC flight tracks, O3(TP) underwent strong sine seasonal variation showing a maximum of ∼123 ppbv in April/May and a minimum of ∼71 ppbv six months later in October/November. This finding demonstrates that a annually fixed O3 threshold value is inadequate for defining the tropopause. For an
10
explanation for this seasonality, see Part II.
Both the chemical tropopause and the dynamical tropopause are material surfaces (unlike the thermal tropopause) and thus are assumed to fall together. Indeed, during CARIBIC 1997–2002 the in situ detected chemical tropopause showed a constant PV value of ∼2 PVU (derived from ECMWF data) throughout the year.
15
The CARIBIC Boeing 767 of LTU Airlines was decommissioned in May 2002. Cur-rently, an Airbus A340-600 of Lufthansa Airlines is adapted for deploying a new mea-surement container with many new instrument as of May 2004.
Acknowledgements. The CARIBIC project is supported by the European Union (grant
ENV4-CT95-0006 and EVK2-2001-00007), and the German Ministry for Education and Research
20
(BMBF, AFO 2000), Ford Research, and Ruhrgas AG. We thank LTU-International Airways (D ¨usseldorf) for their support.
References
Andreae, M. O., Anderson, B. F., Blake, D. R., Bradshaw, J. D., Collins, J. E., Gregory, G. L., Sachse, G. W., and Shipham, M. C.: Influence of plumes of biomass burning on chemistry
25
over the equatorial and tropical South Atlantic during CITE 3, J. Geophys. Res., 99, 12 793– 12 808, 1994.
ACPD
4, 1091–1117, 2004CARIBIC Part I: The extratropical chemical tropopause A. Zahn et al. Title Page Abstract Introduction Conclusions References Tables Figures J I J I Back Close
Full Screen / Esc
Print Version Interactive Discussion
© EGU 2004
Andreae, M. O., Artaxo, P., Fischer, H., et al.: Transport of biomass burning smoke to the upper troposphere by deep convection in the equatorial region, Geophys. Res. Lett., 28, 951–954, 2001.
Appenzeller, C., Holton, J. R., and Rosenlof, K. H.: Seasonal variation of mass transport across the tropopause, J. Geophys. Res., 101, 15 071–15 078, 1996.
5
Assmann, R.: ¨Uber die Existenz eines w ¨armeren Luftstroms in der H ¨ohe von 10 bis 15 km, Sitzber. K ¨onigl. Preuss. Akad. Wiss. Berlin, 16, 87–98, 1902.
Bethan, S., Vaughan, G., and Reid, S. J.: A comparison of ozone and thermal tropopause heights and the impact of tropopause definitions on quantifying the ozone content of the troposphere, Q.J.R. Meteorol. Soc., 122, 929–944, 1996.
10
Brenninkmeijer, C. A. M., Crutzen, P. J., Fischer, H., et al.: CARIBIC – civil aircraft for global measurement of trace gases and aerosols in the tropopause region, rm J. Atmos. Ocean. Tech., 16, 1373–1383, 1999.
Brenninkmeijer, C. A. M., Koeppel, C., R ¨ockmann, T., Scharffe, D. S., Br¨aunlich, M., and Gros, V.: Absolute measurement of the abundance of atmospheric carbon monoxide, J. Geophys.
15
Res., 106, 10 003–10 010, 2001.
Brunner, D., Staehelin, J., Jeker, D., Wernli, H., and Schumann, U.: Nitrogen oxides and ozone in the tropopause region of the Northern Hemisphere: Measurements from commercial air-craft in 1995/1996 and 1997, J. Geophys. Res., 106, 27 673–27 699, 2001.
Bujok, O.: In-situ-Messung langlebiger Spurengase in der untersten Stratosph ¨are:
Entwick-20
lung und Anwendung einer flugzeuggest ¨utzten gaschromatographischen Nachweismethode, PhD thesis (in German), Forschungszentrum J ¨ulich, Institute of chemistry and dynamics of the geosphere, Rep. J ¨ul-3517, 1–202, 1998.
Chameides, W. L., Davis, D. D., Gregory, G. L., Sachse, G., and Torres, A. L.: Ozone precursors and ozone photochemistry over Eastern North Pacific during the spring of 1984 based on
25
the NASA GTE/CITE 1 airborne observations, J. Geophys. Res., 94, 9799–9808, 1989. Chin, M., Jacob, D. J., Munger, J. W., Parrish, D. D., and Doddrigde, B. G.: Relationship of
ozone and carbon monoxide over North America, J. Geophys. Res., 99, 14 565–14 573, 1994.
Fischer, H., Wienhold, F. G., Hoor, P., Bujok, O., Schiller, C., Siegmund, P., Ambaum, M.,
30
Scheeren, H. A., and Lelieveld, J.: Tracer correlations in the northern high latitude lowermost stratosphere: Influence of cross-tropopause mass exchange, Geophys. Res. Lett., 27, 97– 100, 2000.
ACPD
4, 1091–1117, 2004CARIBIC Part I: The extratropical chemical tropopause A. Zahn et al. Title Page Abstract Introduction Conclusions References Tables Figures J I J I Back Close
Full Screen / Esc
Print Version Interactive Discussion
© EGU 2004
Fischer, H., de Reus, M., Traub, M., et al.: Deep convective injection of boundary layer air into the lowermost stratosphere at midlatitudes, Atmospheric Chemistry and Physics, 2, 2003– 2019, 2002.
Fishman, J. and Seiler, W.: Correlative nature of ozone and carbon monoxide in the tropo-sphere: Implications for the tropospheric ozone budget, J. Geophys. Res., 88, 3662–3670,
5
1983.
Fishman, J., Seiler, W., and Haagenson, P.: Simultaneous presence of O3and CO bands in the troposphere, Tellus, 32, 456–463, 1980.
Flocke, F., Herman, R. L., Salawitch, R. J., et al.: An examination of chemistry and transport processes in the tropical lower stratosphere using observations of long-lived and short-lived
10
compounds obtained during STRAT and POLARIS, J. Geophys. Res., 104, 26 625–26 642, 1999.
Haynes, P., Scinocca, J., and Greenslade, M.: Formation and maintenance of the extratropical tropopause by baroclinic eddies, Geophys. Res. Lett., 28, 4179–4182, 2001a.
Haynes, P., Shepard, T., and Wirth, V.: Report on the SPARC tropopause workshop, Bad T ¨olz,
15
Germany, 17–21 April 2001, SPARC newsletter No 17, 3–10, 2001b.
Herman, R. L., Webster, C. R., May, R. D., et al.: Measurements of CO in the upper troposphere and lower stratosphere, Chemosphere, Global Change Science, 1, 173–183, 1999.
Hipskind, R. S., Gregory, G. L., Sachse, G. W., Hill, G. F., and Danielsen, E. F.: Correlations between ozone and carbon monoxide in the lower stratosphere, folded tropopause, and
20
maritime troposphere, J. Geophys. Res., 92, 2121–2130, 1987.
Hoor, P., Fischer, H., Lange, L., Lelieveld, J., and Brunner, D.: Seasonal variations of a mixing layer in the tropopause region as identified by the CO-O3 correlation from in-situ measure-ments, J. Geophys. Res., 107, doi:10.1029/2000JD000289, 2002.
Lelieveld, J., Crutzen. P. J., Jacob D. J., and Thompson, A. M.: Modeling of biomass burning on
25
tropospheric ozone, in “Fire in southern African savanna: Ecological and atmospheric per-spectives”, edited by Lindesay, J. A., Andreae, M. O., Tyson, P. D., and Wilgen, B., University of Witwatersrand Press, 1996.
Li, Q. B., Jacob, D. J., Logan, J. A., et al.: A tropospheric ozone maximum over the Middle East, Geophys. Res. Lett., 28, 3235–3238, 2001.
30
Logan, J. A.: An analysis of ozonesonde data for the troposphere: Recommendations for testing 3-D models and development of a gridded climatology for tropospheric ozone, J. Geophys. Res., 104, 16 115–16 149, 1999a.
ACPD
4, 1091–1117, 2004CARIBIC Part I: The extratropical chemical tropopause A. Zahn et al. Title Page Abstract Introduction Conclusions References Tables Figures J I J I Back Close
Full Screen / Esc
Print Version Interactive Discussion
© EGU 2004
Logan, J.A.: An analysis of ozonesonde data for the lower stratosphere: Recommendations for testing models J. Geophys. Res., 104, 16 151–16 170, 1999b.
Mahlmann, J. D., Levy II, H., and Moxim, W.: Three-dimensional simulations of stratospheric N2O: Predictions for other trace gases constituents, J. Geophys. Res., 91, 2687–2707, 1986.
5
Mauzerall, D. L., Logan, J. A., Jacob, D. J., et al.: Photochemistry in biomass burning plumes and implications for tropospheric ozone over the tropical south Atlantic, J. Geophys. Res., 103, 8401–8423, 1998.
Menzies, R. T. and Tratt, D. M.: Evidence of seasonally dependent stratosphere-troposphere exchange and purging of the lower stratospheric aerosol from a multiyear lidar data set, J.
10
Geophys. Res., 105, 3139–3148, 1995.
Novelli, P. C., Masarie, K. A., Lang, P. M., Hall, B. D., Myers, R. C., and Elkins, J. W.: Reanalysis of tropospheric CO trends: Effects of the 1997–1998 wildfires, J. Geophys. Res., 108, D15, 4464, doi:10.1029/2002JD003031, 2003.
Parrish, D. D., Trainer, M., Holloway, J. S., Yee, J. E., Warshawsky, M. S., Fehsenfeld, F. C.,
15
Forbes, G. L., and Moody, J. L.: Relationships between ozone and carbon monoxide at surface sites in the North Atlantic region, J. Geophys. Res., 103, 13 357–13 376, 1998. Parrish, D. D., Ryerson, T. B., Holloway, J. S., Trainer, M., and Fehsenfeld, F. C.: New directions:
Does pollution increase or decrease tropospheric ozone in winter/spring?, Atmos. Environ., 33, 5147–5149, 1999.
20
Plumb, R. A., and Ko, M. K. W.: Interrelationships between mixing ratios of long-lived strato-spheric constituents, J. Geophys. Res., 97, 10 145–10 156, 1992.
Plumb, R. A., Waugh, D. W., and Chipperfield, M.: The effects of mixing on tracer relationships in the polar vortices, J. Geophys. Res., 105, 10 047–10 062, 2000.
Poulida, O., Dickerson, R. R., and Heymsfield, A.: Stratosphere-troposphere exchange in a
25
midlatitude mesoscale convective complex: 1. Observations, J. Geophys. Res., 101, 6823– 6863, 1996.
Seiler, W. and Warneck, P.: Decrease of carbon monoxide mixing ratio at the tropopause, J. Geophys. Res., 77, 3204–3214, 1972.
Solomon, S., Garcia, R. R., and Stordal, F.: Transport processes and ozone perturbations, J.
30
Geophys. Res., 90, 12 981–12 989, 1985.
Sprenger, M. and Wernli, H.: A northern hemispheric climatology of cross-tropopause ex-change for the ERA15 time period (1979–1993) J. Geophys. Res., 108, D12, 8521,
ACPD
4, 1091–1117, 2004CARIBIC Part I: The extratropical chemical tropopause A. Zahn et al. Title Page Abstract Introduction Conclusions References Tables Figures J I J I Back Close
Full Screen / Esc
Print Version Interactive Discussion
© EGU 2004
doi:10.1029/2002JD002636, 2003.
Stohl, A.: A one-year Lagrangian “climatology” of airstreams in the northern hemisphere tropo-sphere and lowermost stratotropo-sphere, J. Geophys. Res., 106, 7263–7279, 2001.
Talbot, R. W., Dibb, J. E., Scheuer, E. M., et al.: Reactive nitrogen budget during the NASA SONEX mission, Geophys. Res. Lett., 26, 3057–3060, 1999.
5
Teisserenc de Bort, L.: Variations de la Temp ´erature de l’air libre dans la zone comprise entre 8 km et 13 km d’altitude, Compt. Rend. S ´eances Acad. Sci. Paris, 134, 987–989, 1902. Thouret, V., Marenco, A., N ´ed ´elec, P., and Grouhel, C.: Ozone climatologies at 9–12 km altitude
as seen by the MOZAIC airborne program between September 1994 and August 1996, J. Geophys. Res., 103, 25 653–25 679, 1998.
10
Thuburn, J. and Craig, G. C.: Stratospheric influence on tropopause heights: The radiative constraint, J. Atmos. Sci., 57, 17–28, 2000.
Waibel, A. E., Fischer, H., Wienhold, F. G., Siegmund, P. C., Lee, B., Str ¨om, J., Lelieveld, J., and Crutzen, P. J.: Highly elevated carbon monoxide concentrations in the upper troposphere and lowermost stratosphere at northern midlatitudes during the STREAM II summer campaign,
15
Chemosphere, Global Change Science, 1, 233–248, 1999.
Waugh, D. W., Plumb, R. A., Elkins, J. W., et al.: Mixing of polar vortex air into middle latitudes as revealed by tracer-tracer scatter plots, J. Geophys. Res., 102, 13 119–13 134, 1997. Wernli, H. and Bourqui, M.: A Lagrangian “1-year climatology” of (deep) cross-tropopause
exchange in the extratropical Northern hemisphere, J. Geophys. Res., 107, D2,
20
doi:10.1029/2002JD000812, 2002.
Wirth, V.: Thermal versus dynamical tropopause in upper-tropospheric balanced flow anoma-lies, Q.J.R. Meteorol. Soc., 126, 299–317, 2000.
World Meteorological Organization (WMO): Meteorology – A three-dimensional science, WMO Bull., 6, (Oct), 134–138, 1957.
25
World Meteorological Organization (WMO): Atmospheric ozone 1985, Rep. 16, Global Ozone Res. and Monit. Proj., Geneva, 152, 1985.
Zahn, A., Brenninkmeijer, C. A. M., Crutzen, P. J., Heinrich, G., Fischer, H., Cuijpers, J. W. M., and van Velthoven, P. F. J.: Distributions and relationships of O3 and CO in the upper troposphere: The CARIBIC aircraft results 1997–2001, J. Geophys. Res., 107, D17, 4337,
30
doi:10.1029/2001JD001529, 2002.
Zahn, A. and Brenninkmeijer, C. A. M.: New Directions: A chemical tropopause defined, Atmos. Environ., 37, 3, 439–440, 2003.
ACPD
4, 1091–1117, 2004CARIBIC Part I: The extratropical chemical tropopause A. Zahn et al. Title Page Abstract Introduction Conclusions References Tables Figures J I J I Back Close
Full Screen / Esc
Print Version Interactive Discussion © EGU 2004 -100 -80 -60 -40 -20 0 20 40 60 80 -40 -30 -20 -10 0 10 20 30 40 50 60 6 22 47 Longitude (°E) L a ti tu d e ( °N )
Fig. 1. CARIBIC flight tracks between November 1997 and April 2002 at 9–12 km altitude.
ACPD
4, 1091–1117, 2004CARIBIC Part I: The extratropical chemical tropopause A. Zahn et al. Title Page Abstract Introduction Conclusions References Tables Figures J I J I Back Close
Full Screen / Esc
Print Version Interactive Discussion © EGU 2004 -40 -30 -20 -10 0 10 20 30 40 50 60 70 0 10 20 30 40 50 60 70 80 90 100 0 5 10 15 20 25 30 35 40 45 b P ro b a b ili ty o f s tr a to s p h e ri c a ir ( % ) Latitude (°N)
to the Indian Ocean to southern Africa to the Caribbean a F lig h t h o u rs p e r 3 ° l a tit u d e
Fig. 2. Flight statistics along the three CARIBIC flight routes. I: Germany – Indian Ocean: black
dots, II: Germany – Africa: light dots, and III: Germany – Caribbean: squares. (a) flight hours
per 3◦ latitude bin. The total number of flight hours at 9–12 km altitude is 392 h along I, 58 h along II, and 206 h along III.(b) Frequency of the encounter of stratospheric air in per cent.
No clear and statistically significant seasonal variation was observed. Multiplication of the two numbers in (a) and (b) gives the flight hours spent in stratospheric air (as during almost 100% of the flight time O3data were recorded).
ACPD
4, 1091–1117, 2004CARIBIC Part I: The extratropical chemical tropopause A. Zahn et al. Title Page Abstract Introduction Conclusions References Tables Figures J I J I Back Close
Full Screen / Esc
Print Version Interactive Discussion © EGU 2004 0 20 40 60 80 100 120 0 100 200 300 400 500 600 700 0 10 20 30 40 50 60 70 80 90 5 10 15 20 b J PJ summer A lt itu d e ( k m ) Latitude (°N) 5 10 15 20 a vortex PJ J winter A lt itu d e ( k m ) 480 460 440 420 400 360 340 320 460 440 420 400 360 340 320 300 -2 0 2 4 6 100 1000 c measured ∆H (km) no isentropic trop-to-strat transport τozone = 1 yr O3 (ppbv) -2 0 2 4 6 0 20 40 60 80 100 120 d ∆H (km) no isentropic trop-to-strat transport derived CO (ppbv) e ∆ ∆∆ ∆H ~ 0 km ∆ ∆∆ ∆H ~ 1.9 km ∆ ∆∆ ∆H ~ 3.2 km mixing line no isentropic trop-to-strat transport O3 (ppbv) CO (ppbv) Fig. 3.
ACPD
4, 1091–1117, 2004CARIBIC Part I: The extratropical chemical tropopause A. Zahn et al. Title Page Abstract Introduction Conclusions References Tables Figures J I J I Back Close
Full Screen / Esc
Print Version Interactive Discussion
© EGU 2004
Fig. 3. Illustration of the processes that determine the O3-CO relationship in the lowermost stratosphere (LMS).(a) LMS in winter (dashed area) with potential temperature surfaces (thin
lines, adopted from the U.S. standard atmosphere), the approximate location of the subtropical jetstream (J) and the polar jetstream (PJ), the mean border of the stratospheric polar vortex (grey bar), some arrows indicating the Brewer-Dobson circulation, and the latitude range where the CARIBIC aircraft typically sampled stratospheric air (horizontal black bar). (b) as (a), but
for summer. Note the much smaller volume of the LMS compared to winter. (c) vertical O3
sounding over Athens (38◦N, 24◦E, Greece) on 24 April 1992 (dots) versus the vertical dis-tance to the thermal tropopause. Thin line: imaginary vertical O3profile in the LMS, which is valid if no injection of tropospheric air would exist and a chemical lifetime of O3 of 1 year is assumed (explanation, see text). Grey area: circa vertical extension of the tropopause tran-sition layer (mixing layer). (d) as (c), but for CO. The profile is inferred from the O3 profile under the assumption of a reasonable linear relationship of O3and CO in the mixing layer at that time of the year having an O3-CO slope of 6.4 ppbv/ppbv. Thin line: imaginary vertical CO
profile in the LMS, determined by the local chemical equilibrium between CO production and loss. This profile is valid if no injection of (CO-rich) tropospheric air would exist. (e) O3-CO correlation plot of the vertical O3 and CO profiles shown in the graphs c and d (dots). Thin line: imaginary L-shape relationship that is valid if no mixing with tropospheric air would exist. Within the mixing layer (grey area in graph c and d), here spanning an O3range between ∼100 and ∼480 ppbv, a compact quasi-linear relationship between O3and CO connecting the tropo-spheric and stratotropo-spheric reservoir (light squares with line) exists. The area above is assumed to be much weaker influenced from the injection of tropospheric air.
ACPD
4, 1091–1117, 2004CARIBIC Part I: The extratropical chemical tropopause A. Zahn et al. Title Page Abstract Introduction Conclusions References Tables Figures J I J I Back Close
Full Screen / Esc
Print Version Interactive Discussion © EGU 2004 40 60 80 100 120 0 100 200 300 400 500 TPchemical Unperturbed Lowermost Stratosphere Troposphere O z o n e ( p p b v) Carbon Monoxide (ppbv) 0.0 0.5 1.0 1.5 2.0 2.5 3.0 Mixing Layer C irc a A ltit u d e a b o ve T P c h e m ic a l (k m )
Fig. 4. Definition of a chemical tropopause based on the O3-CO relationship. Dots: CARIBIC data collected during a flight from the Maldives to Germany at 10–11 km altitude on 19 Jan-uary 2000. The transition from no correlation between O3 and CO in upper tropospheric air
(dashed area) to a compact negative correlation in lower stratospheric air marks the chemi-cal tropopause TPchem(arrow). For this flight, it shows an O3mixing ratios of 92 ppbv with an uncertainty of ∼20 ppbv or ∼150 m in the vertical (see right y-axis, that is inferred from compar-isons with vertical O3soundings). Just above the tropopause, a mixing layer is present in which inflowing tropospheric air mixes with unperturbed lower stratospheric air. The corresponding linear mixing line is indicated as sloped dashed line.
ACPD
4, 1091–1117, 2004CARIBIC Part I: The extratropical chemical tropopause A. Zahn et al. Title Page Abstract Introduction Conclusions References Tables Figures J I J I Back Close
Full Screen / Esc
Print Version Interactive Discussion © EGU 2004 0.8 1.0 1.2 1.4 1.6 60 80 100 120 140 160 O 3 a t C h e m ic a l T ro p o p a u s e ( p p b v ) Month Indian Ocean Southern Africa Caribbean S e a s o n a lit y
Fig. 5. Seasonal O3 variation at the chemical tropopause, left y-axis as mixing ratio, and right y-axis as relative variation with respect to the annual mean of 97 ppbv, along the three CARIBIC flight routes (Fig. 1): Germany – Indian Ocean: full dots, Germany – Caribbean: open dots, Germany – southern Africa: stars. Because of the mostly small difference, for each outward and return flight only one data point is indicated. For flights along which no sharp chemical tropopause could be inferred, no data point is shown. The tropopause crossings mostly occurred between 35 and 50◦N. Sine line: seasonal variation that approximates the data along the Indian and African flight route best (identical with Eq. 1) with 1-σ scatter range (grey area). Horizontal line: mostly applied O3tropopause threshold value of 100 ppbv.
ACPD
4, 1091–1117, 2004CARIBIC Part I: The extratropical chemical tropopause A. Zahn et al. Title Page Abstract Introduction Conclusions References Tables Figures J I J I Back Close
Full Screen / Esc
Print Version Interactive Discussion © EGU 2004 40 60 80 100 120 140 160 O3 a t D y n a m ic a l T ro p o p a u s e ( p p b v ) Month at 1.5 PVU at 2.0 PVU at 2.5 PVU
Fig. 6. Measured mean ozone mixing ratio at potential vorticity (PV) iso-surfaces of 1.5 (full
dots), 2.0 (open dots), and 2.5 PVU (stars), and at the chemical tropopause (thick sine line, identical with Eq. 1). PV data are extracted from ECMWF analysis along the CARIBIC flight tracks (Sect. 2). Dashed line: sine seasonal variation that describes the O3 variation at the 2 PVU iso-surface best (identical with Eq. 2).


![[PDF] Formation Algorithmique et programmation Pascal | Cours informatique](data:image/gif;base64,R0lGODlhAQABAIAAAP///wAAACH5BAEAAAAALAAAAAABAAEAAAICRAEAOw==)