The Developmental Potential of iPSCs Is Greatly
Influenced by Reprogramming Factor Selection
The MIT Faculty has made this article openly available.
Please share
how this access benefits you. Your story matters.
Citation
Buganim, Yosef, Styliani Markoulaki, Niek van Wietmarschen,
Heather Hoke, Tao Wu, Kibibi Ganz, Batool Akhtar-Zaidi, et al.
“The Developmental Potential of iPSCs Is Greatly Influenced
by Reprogramming Factor Selection.” Cell Stem Cell 15, no. 3
(September 2014): 295–309. © 2014 Elsevier Inc.
As Published
http://dx.doi.org/10.1016/j.stem.2014.07.003
Publisher
Elsevier
Version
Author's final manuscript
Citable link
http://hdl.handle.net/1721.1/109508
Terms of Use
Creative Commons Attribution-NonCommercial-NoDerivs License
The Developmental Potential of iPSCs Is Greatly Influenced by
Reprogramming Factor Selection
Yosef Buganim2,8,*, Styliani Markoulaki1,8, Niek van Wietmarschen3, Heather Hoke1,4, Tao
Wu5, Kibibi Ganz1, Batool Akhtar-Zaidi1, Yupeng He6, Brian J. Abraham1, David Porubsky3,
Elisabeth Kulenkampff1, Dina A. Faddah1,4, Linyu Shi1, Qing Gao1, Sovan Sarkar1, Malkiel
Cohen1, Johanna Goldmann1, Joseph R. Nery6, Matthew D. Schultz6, Joseph R. Ecker6,
Andrew Xiao5, Richard A. Young1,4,7, Peter M. Lansdorp3,7, and Rudolf Jaenisch1,4,7,*
1Whitehead Institute for Biomedical Research, Cambridge, MA 02142, USA 2Department of
Developmental Biology and Cancer Research, Institute for Medical Research Israel-Canada, Hebrew University-Hadassah Medical School, Jerusalem 91120, Israel 3European Research
Institute for the Biology of Ageing, University Medical Center Groningen, University of Groningen, Antonius Deusinglaan 1, AV Groningen 9713, the Netherlands 4Department of Biology,
Massachusetts Institute of Technology, Cambridge, MA 02139, USA 5Yale Stem Cell Center,
Yale University, New Haven, CT 06520, USA 6Genomic Analysis Laboratory, Howard Hughes
Medical Institute, Salk Institute for Biological Studies, La Jolla, CA 92037, USA 7Skolkovo
Institute of Science and Technology (Skoltech), Novaya strazha 100, Skolkovo Moscow Region 143025, Russia
Summary
Induced pluripotent stem cells (iPSCs) are commonly generated by transduction of Oct4, Sox2, Klf4, and Myc (OSKM) into cells. Although iPSCs are pluripotent, they frequently exhibit high variation in terms of quality, as measured in mice by chimera contribution and tetraploid complementation. Reliably high-quality iPSCs will be needed for future therapeutic applications.
© 2014 Elsevier Inc.
*Correspondence: [email protected] (Y.B.), [email protected] (R.J.). 8Co-first author
Accession Numbers: The accession number for the data resulting from whole-genome bisulfite sequencing as discussed in the text is GSE59696; for Mediator ChIP Sequencing, GSE59569; for whole-transcriptome analysis, GSE45173; and for H2A.X ChIP sequencing, GSE55731.
Supplemental Information: Supplemental Information includes Supplemental Experimental Procedures, five figures, and two tables and can be found with this article online at http://dx.doi.org/10.1016/j.stem.2014.07.003.
Author Contributions: Y.B. and R.J. conceived the study. Y.B., S.M., and R.J. wrote the manuscript and prepared the figures. Y.B. designed the experiments and performed cloning of the various factors, MEF infection, iPSC line isolation from the various combinations of factors, embryo C-section, FACS for apoptotic cells, realtime PCR for pluripotency markers, teratoma assay, and immunostaining for pluripotency markers. S.M. performed iPSC injections, tetraploid complementation assay, determination of chimeric contributions, C-sections, and SSLP PCR. N.V.W., D.P., and P.M.L. performed and analyzed the SCE and Trisomy 8 experiments. H.H., B.J.A., and R.A. performed and analyzed the superenhancer activation experiments. T.W. and A.X. performed and analyzed the H2A.X deposition experiments. K.G. and L.S. performed part of the tetraploid complementation experiments. B.A.Z and Y.H. analyzed the mRNA microarray. E.K. and M.C. performed part of the C-sections and isolated several iPSC colonies. D.A.F. performed and analyzed the sm-mRNA-FISH experiments. Q.G. analyzed the teratoma experiments. S.S. performed the
gamma-NIH Public Access
Author Manuscript
Cell Stem Cell. Author manuscript; available in PMC 2015 September 04. Published in final edited form as:
Cell Stem Cell. 2014 September 4; 15(3): 295–309. doi:10.1016/j.stem.2014.07.003.
NIH-PA Author Manuscript
NIH-PA Author Manuscript
Here, we show that one major determinant of iPSC quality is the combination of reprogramming factors used. Based on tetraploid complementation, we found that ectopic expression of Sall4, Nanog, Esrrb, and Lin28 (SNEL) in mouse embryonic fibroblasts (MEFs) generated high-quality iPSCs more efficiently than other combinations of factors including OSKM. Although
differentially methylated regions, transcript number of master regulators, establishment of specific superenhancers, and global aneuploidy were comparable between high- and low-quality lines, aberrant gene expression, trisomy of chromosome 8, and abnormal H2A.X deposition were distinguishing features that could potentially also be applicable to human.
Introduction
Recent reports indicate that the majority of OSKM-derived iPSCs may have reduced differentiation potential as compared to embryonic stem cells (ESCs) derived by somatic cell nuclear transfer (SCNT), which are equivalent in their developmental potential to ESCs derived from the fertilized egg (Boland et al., 2009; Brambrink et al., 2006; Jiang et al., 2011, 2013; Kang et al., 2009; Kim et al., 2010; Pera, 2011; Polo et al., 2010; Zhao et al., 2009). In addition, it has been suggested that OSKM-derived iPSCs exhibit genetic and epigenetic aberrations throughout the genome that are distinct from ESCs (Bar-Nur et al., 2011; Chin et al., 2009; Doi et al., 2009; Gore et al., 2011; Hussein et al., 2011; Kim et al., 2010, 2011; Laurent et al., 2011; Lister et al., 2011; Mayshar et al., 2010; Ohi et al., 2011; Phanstiel et al., 2011; Polo et al., 2010). These data are consistent with the prevailing current reprogramming method affecting the quality of the resulting pluripotent cells. Several parameters have been shown to affect the quality of iPSCs, such as factor stoichiometry (Carey et al., 2011), culture condition, and supplements used to derive the cells (Chen et al., 2011). For example, by comparing two genetically defined transgenic systems to identify parameters affecting reprogramming, it has been shown that high levels of Oct4 and Klf4, together with low levels of Sox2 and Myc, are favorable with respect to the quality of the iPSCs even though a much lower reprogramming efficiency was observed when compared to high levels of Sox2 and Myc and low levels of Oct4 and Klf4 (Carey et al., 2011). Also, derivation of iPSCs in the absence of serum but in the presence of vitamin C improved the quality of the cells and generated tetraploid complementation-competent iPSCs even when a sub-optimal factor stoichiometry was used to induce pluripotency (Esteban and Pei, 2012; Stadtfeld et al., 2012). In summary, the available data suggest that factor stoichiometry, as well as specific culture conditions, affect the quality of iPSCs. Here, we show that the quality of iPSCs is dramatically affected by the specific choice of reprogramming factors. Reprogramming by Sall4, Nanog, Esrrb, and Lin28 (SNEL) generated a very low number of iPSC colonies, the majority of which were of high quality as defined by their capacity to produce healthy “all-iPSC” mice, as determined by 4n complementation, the most stringent test for pluripotency. In stark contrast, OSKM produced a large number of iPSC colonies, the majority of which, using the same assay, exhibited low developmental potential. Removing Myc from the cocktail (OSK) yielded a higher number of high-quality iPSCs, indicating that the present of Myc in the reprogramming factors combination has a negative effect on iPSC quality. Surprisingly, a combination of Oct4, Sox2, Sall4, Nanog, and Esrrb (OSSNE), although lacking potent oncogenes like Myc and Lin28, yielded the highest number of poor quality iPSCs, suggesting that the interplay between the reprogramming
NIH-PA Author Manuscript
NIH-PA Author Manuscript
factors plays a critical role in the reprogramming process as well. To shed light on the elements that dictate successful reprogramming events, we performed a large number of genomic and epigenomic analyses. While whole genome transcriptional profile, methylome analysis, establishment of superenhancers, or single-cell analysis of key master regulator transcript number and global aneuploidy did not distinguish between poor- and high-quality iPSCs, aberrant expression of 1,765 genes, trisomy of chromosome 8, and abnormal H2A.X deposition were frequently observed in poor-quality iPSCs that were derived by OSKM or OSK. Our results demonstrate that the selection of the reprogramming factor combination is an important determinant for retaining genomic integrity, appropriate transcriptional resetting, and functional pluripotency of iPSCs.
Results
Ectopic Expression of Sall4, Nanog, Esrrb, and Lin28 Activates the Endogenous Pluripotency Circuitry
Recently, using two complementary single-cell technologies, we have demonstrated that the reprogramming process involves a late hierarchical/deterministic phase that starts with the activation of the Sox2 locus and continues with a series of gene activation events that lead to a stable and transgene-independent pluripotency state (Figure 1A) (Buganim et al., 2012, 2013; Klemm et al., 2014; Pan and Pei, 2012). We reasoned that a combination of key factors derived from this later phase would reprogram cells in a more controlled manner and potentially would then uniformly yield iPSCs of high quality. We focused mainly on one specific combination of factors, Sall4, Nanog, Esrrb, and Lin28 (SNEL), because we wished to avoid ectopic expression of the key master regulators Oct4 and Sox2. We hypothesized that exogenous expression of strong key master regulators such as Oct4 and Sox2, without their endogenous regulators present in ESCs or during nuclear transfer-mediated
reprogramming in the oocyte, might yield aberrant activation of various loci in the somatic cell genome that interfere with normal reprogramming events as is apparent in partially reprogrammed cells (Buganim et al., 2012, 2013). Sall4 and Esrrb were chosen based on a Bayesian network analysis prediction that they could activate the endogenous Oct4 and Sox2 genes, respectively. We selected Lin28 because it has been shown to act as a global mRNA regulator (Cho et al., 2012) and to activate the de novo DNA methyltransferase, Dnmt3b, and Nanog that was predicted to have a separate role during reprogramming (Figure 1A). Nanog-GFP or Oct4-GFP mouse embryonic fibroblasts (MEFs) were introduced with doxycycline (dox)-inducible lentiviruses encoding for the SNEL reprogramming factors and cultured until the formation of iPSC colonies. The efficiency of the reprogramming process was very low, producing one to five colonies per 1 × 10⁵ plated cells with a latency that ranged between 14–60 days. In total, we isolated ten SNEL-iPSC colonies (six from Nanog-GFP and four from Oct4-Nanog-GFP MEFs). The resulting iPSC colonies expressed a bright Nanog-GFP signal from both the Oct4 and the Nanog locus and showed upregulation of key pluripotency markers such as Sox2, endogenous Sall4, Utf1, and endogenous Esrrb, as assessed by immunostaining (Figure 1B). A comparable mRNA level to OSKM-iPSCs and several ESC lines of Dppa2, Dppa3, endogenous Lin28, and Rex1 was noted as well by quantitative real-time PCR (qRT-PCR) (Figure 1C). When injected into NOD/SCID mice, the cells formed
NIH-PA Author Manuscript
NIH-PA Author Manuscript
well-differentiated teratomas with structures from all three germ layers (representative images can be seen in Figure 1D).
SNEL-iPSCs Contribute to High-Grade Chimeras and Frequently Produce “All-iPSC” Mice
The potential of SNEL-iPSCs to generate chimeras was tested by injecting cells from all ten clones into host blastocysts that were subsequently transferred into pseudopregnant recipient females. All lines gave rise to chimeras, with 8/10 (80%) generating high-grade chimeras (50%–95%) as assessed by coat color (Figures S1A and S1B available online). Germline transmission was noted in all five tested lines (Figures S1A and S1C). Chimeric mice from one of the iPSC clones (Oct4-GFP SNEL#2) suffered from an eye problem and one adult mouse developed a tumor. However, these isolated events might be explained by leaky expression of Esrrb and Lin28, which have been linked to similar phenotypes (Audo et al., 2012; Viswanathan et al., 2009; West et al., 2009). All other chimeras generated from independent clones grew to old age without any obvious evidence of tumorigenicity (Figure S1C). To stringently compare the developmental potential of SNEL and OSKM-derived iPSCs, we performed 4n complementation assay. Utilizing identical infection and culture conditions as used for the derivation of the SNEL-iPSCs, ten iPSC lines were derived by infection of MEFs with OSKM lentiviruses all of which expressed high levels of GFP and pluripotency markers (6/10 of the colonies are presented in Figure 1C). Cells from the ten SNEL-iPSC and ten OSKM-iPSC lines were injected into 4n blastocysts and transferred into pseudopregnant recipient females. The SNEL-iPSCs produced approximately five times as many live 4n pups with the majority surviving postnatally (p = 3.46 × 10⁻¹² by χ2 test) (Figures 2A and 2B; Table S1) as compared to OKSM-iPSCs. Out of a total of 1,495 OSKM-iPSC-injected blastocysts, only 21 (1.4%) were delivered, 11 (0.7%) of which sustained normal breathing and were foster nursed. In contrast, out of 2,138 blastocysts injected with SNEL iPSCs, 149 (7%) survived to birth, 109 (5%) of which were breathing normally and were fostered nursed (Table S1). In total, ∼40% of the OSKM-iPSC lines gave rise to live pups, compared to 80% of the SNEL-iPSC lines. In general, the adult “all-SNEL-iPSC” mice were healthy and fertile (Figures 2B and S2C), although some mice exhibited some phenotypes that are purely related to leaky expression of Lin28, such as long tail and ears and flattened nose as described in (Zhu et al., 2010, 2011), and several
individuals died prematurely after 1 year. To exploit the maximum potential of the cells and determine whether the developmental differences between these two types of iPSCs would be further exacerbated, we cultured the 20 iPSC lines in 2i medium (LIF, GSK3β, and Mek 1/2 inhibitors containing medium) for two passages and then injected each line into 60 4n blastocysts. The percentage of live-born pups in the SNEL combination was significantly higher, reaching 23%–25% in some SNEL-iPSC lines (Table 1 and Figures S2A and S2B). From a total of 600 OSKM-iPSC-injected blastocysts only 13 (2.1%) were delivered, eight (1.7%) of which sustained normal breathing and were foster nursed. In contrast, out of 600 blastocysts injected with SNEL-iPSCs, 64 (10.7%) survived to birth, 51 (8.5%) of which were breathing normally and were fostered nursed (Table 1). Germline transmission was noted in all examined lines. Simple sequence length polymorphism (SSLP) analysis for ten randomly selected 4n embryos (PCR-based assay for two loci) confirmed that the embryos were solely derived from the injected iPSCs (Figure 2C). Our data suggest that
reprogramming with SNEL, in contrast to reprogramming using OSKM under the same
NIH-PA Author Manuscript
NIH-PA Author Manuscript
conditions, produces high-quality iPSCs at high rates as assessed by the most stringent test of 4n complementation.
Myc is a potent oncogene that affects genomic integrity when deregulated (Barlow et al., 2013) and enhances the transcription at all active promoters when overexpressed (Lin et al., 2012; Nie et al., 2012). To determine whether overexpression of Myc is the cause for the high number of poor quality OSKM-iPSC colonies, we derived ten OSK-iPSC colonies under identical conditions and assessed their quality by 4n complementation. Indeed, a larger number of colonies (8/10 in OSK-iPSC colonies compared to 4/10 in OSKM-iPSC colonies) passed the 4n complementation test. However, a significantly lower number of pups were delivered per line (30 live pups, 5%) in colonies derived from OSK compared to colonies derived from SNEL (64 live pups, 10.7%). These results indicate that Myc is partially responsible for the high number of poor quality colonies in the OSKM combination but suggest that other parameters influence the quality, as well. We then sought to determine whether potent oncogenes are the main reason for the generation of poor quality iPSCs. To test this hypothesis, we isolated 6 colonies, generated by ectopic expression of Oct4, Sox2, Sall4, Nanog, and Esrrb (OSSNE) but without the potent oncogenes Myc and Lin28. Surprisingly, OSSNE combination yielded the highest number of poor quality iPSCs (five live pups, 1.3%), suggesting that the interplay between the reprogramming factors is a crucial element during the reprogramming process.
Comparative Transcriptome Profiling of Poor- and High-Quality iPSCs Reveals a Distinct Signature of 1,765 Genes that Robustly Distinguish Lines by 4n Proficiency
To reveal a gene expression signature associated with developmental competence, we selected the following groups of iPSC lines for microarray analysis: (1) “poor quality” iPSCs: this group included the three OSKM-iPSC lines Nanog-GFP OSKM#2, Oct4-GFP OSKM#2, and KH2 OSKM (Stadtfeld et al., 2010), that either did not produce fully developed pups or produced very low number of pups; (2) “good quality” iPSCs: this group included BC_2 OSKM (Carey et al., 2011) and Nanog-GFP SNEL#3, both of which gave rise to live, normal pups that survived only a few hours; (3) “high quality” iPSCs consisting of Nanog-GFP SNEL#2 and Oct4-GFP SNEL#1, both of which generated live pups that survived postnatally (representative pups from each iPSC group are shown in Figure S3A). We used Nanog-GFP, Oct4-GFP, and KH2 (Beard et al., 2006) ESCs as controls.
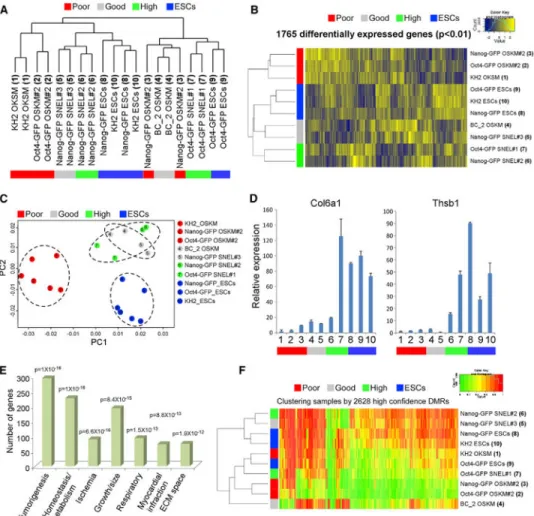
Whole genome transcriptional analysis did not distinguish between the groups as assessed by hierarchical clustering and principle component analysis (PCA), consistent with their common identities as pluripotent cells (Figures 3A and S3B). In contrast, unbiased hierarchical clustering and PCA analysis of differentially expressed genes between all groups (F test, p < 0.01, Table S2) revealed a list of 1,765 genes that separated perfectly the different groups and clustered the “poor quality” group away from the other three groups (Figures 3B and 3C). qRT-PCR for two representative differentially expressed genes,
Col6a1 and Thsb1, from the 1,765 gene signature demonstrated a trend of expression that is
highly correlated with 4n competency (Figure 3D).
Gene ontologies and pathways (GeneDecks) (Stelzer et al., 2009) for the 1,765 differentially expressed genes revealed enrichment not only for categories associated with the control of
NIH-PA Author Manuscript
NIH-PA Author Manuscript
cellular growth and division, but also for more refined and specific developmental pathways and phenotypes: respiratory, immune, musculature, and aortic integrity phenotypes; hypoxia, myocardial infarction, and pulmonary disease; abnormal limb/digit/tail morphology; genes involved in extracellular matrix composition and TGFβ signaling; and defective
embryogenesis (the p value and number of genes of representatives categories are presented in Figure 3E). Standard motif enrichment analysis on the 1,765 gene promoters revealed a strong enrichment for transcription factors vital for early embryonic development and ESC self-renewal (Hanna et al., 2002; Liu and Labosky, 2008; Shah et al., 2012; Weinhold et al., 2000) such as Foxd3, HMG-I/Y, and Srf (Figure S3C), lending support to the role of the 1,765 genes in development and ESC maintenance.
Differentially Methylated Regions and the Establishment of ESC-Specific Superenhancers Cannot Distinguish between Poor- and High-Quality iPSCs
To assess whether this gene expression pattern may be associated with epigenetic alterations, we profiled the methylomes of these samples by whole genome bisulfite sequencing. Although over 2,500 differentially methylated regions (DMRs) were identified, these were largely specific to individual iPSC lines (i.e., Nanog-GFP versus Oct4-GFP lines, Figure 3F). Thus, the exclusively intronic and intergenic genomic distribution of DMRs precluded accurate assessment of any contribution of DNA methylation to the observed gene expression pattern.
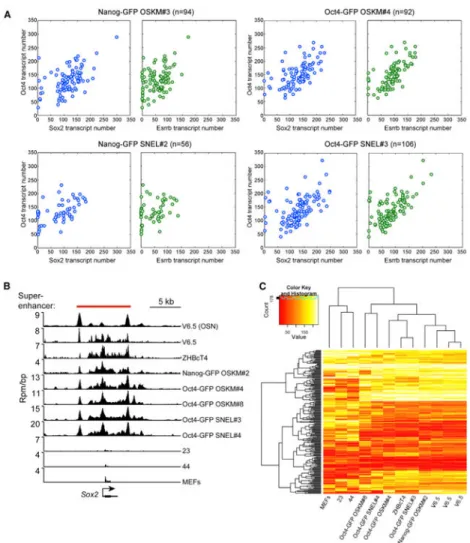
To test whether variations in the transcript levels of ESC key master regulators could explain the differences in the gene expression pattern between poor- and high-quality iPSCs, we employed the single-molecule-mRNA fluorescent in situ hybridization (sm-mRNA-FISH) technique, which allows the quantification of mRNA transcripts of up to three genes in individual cells (Raj et al., 2010). The transcript number of three ESC key master regulators, Oct4, Sox2, and Esrrb, was quantified in two poor quality OSKM-iPSC lines, Nanog-GFP OSKM#3 and Oct4-GFP OSKM#4, and two high-quality SNEL-iPSC lines, Nanog-GFP SNEL#2 and Oct4-GFP SNEL#3. As depicted in Figures 4A and S4A, the transcript count of all three factors was comparable between the different lines. It should be noted that the transcript count of Esrrb was lower in the Nanog-GFP lines as compared to Oct4-GFP lines (Figures 4A and S4B). This result is consistent with the previous
observation that Esrrb is a direct target of Nanog (Festuccia et al., 2012), as in our system GFP was introduced into the Nanog locus by replacing the coding region of the endogenous
Nanog gene, thereby creating a mutant allele which reduces the total level of endogenous
Nanog protein.
Superenhancers are regulatory elements that are associated with genes that determine cell identity (Hnisz et al., 2013). Therefore, the establishment of ESC-specific superenhancers during the reprogramming process is crucial to allow proper transcription and function. It has been shown that the binding of key master regulators, H3K27ac and the Mediator complex rigorously mark superenhancers (Whyte et al., 2013). To test whether poor quality iPSCs acquire aberrant establishment of superenhancers during the reprogramming process, we measured the enrichment of the Mediator complex on ESC-specific superenhancers by chromatin immunoprecipitation sequencing (ChIP-seq) in several lines. ChIP-seq for Med1,
NIH-PA Author Manuscript
NIH-PA Author Manuscript
a component of the Mediator complex, was performed on two ESC lines, V6.5 and ZHBcT4, as positive controls, the parental MEFs and two previously described partially reprogrammed lines (i.e., cells that initiated the reprogramming process but never gave rise to stable iPSCs, 23 and 44) as negative controls (Buganim et al., 2012), three poor quality iPSC lines, Nanog-GFP OSKM#2, Oct4-GFP OSKM#4, and Oct4-GFP OSKM#8, and two high-quality iPSC lines, Oct4-GFP SNEL#3 and Oct4-GFP SNEL#4. The distribution of the Mediator complex throughout the genome was compared to the distribution of the binding of Oct4, Sox2, and Nanog (OSN), three ESC key master regulators. The recruitment of Med1 protein throughout the genome was comparable in all iPSC lines tested but was absent in the negative control cells as can be seen in three representative ESC-specific superenhancers for Sox2, Nanog, and miR290-295, (Figures 4B and S4C) and following hierarchical clustering analysis of Med1 densities in all superenhancers from all lines (Figure 4C). The results so far indicate that both poor- and high-quality iPSCs reach a complete activation of the endogenous pluripotency circuitry as measured by transcript count of ESC key master regulators and by establishment of ESC-specific superenhancers.
Trisomy of Chromosome 8 Is a Frequent Genomic Aberration in OSKM/OSK-iPSC Lines
It has been demonstrated that oncogenic stress induced by Myc leads to DNA damage that promotes genomic instability and tumor progression (Vafa et al., 2002). To test whether OSKM elicit stronger DNA damage than SNEL when overexpressed, we infected MEFs with either OSKM, SNEL, or an empty vector as control and measured the levels of a well-known DNA damage sensor, γ-H2A.X phosphorylation (Bonner et al., 2008) 7 days postdox exposure. Consistent with Myc being a very potent oncogene (González et al., 2013; Marión et al., 2009; Müller et al., 2012), we observed a significant increase in γ-H2A.X
phosphorylation level in OSKM-infected MEFs as compared to MEFs that were infected with empty vector or SNEL (Figure 5A). Consistent with that, a large fraction of propidium iodide-positive cells (10.9%) was observed in OSKM-infected MEFs, but not in SNEL or empty vector-infected MEFs, suggesting that OSKM expression leads to severe DNA damage that induces cell death (Figure 5B). This result led us to investigate whether OSKM-iPSCs acquire genomic aberrations throughout the reprogramming process, which might explain the premature death observed in 4n embryos produced by the poor quality OSKM-iPSCs. DNA rearrangements such as sister chromatid exchanges (SCEs) are sensitive indicators of genomic stress and instability, thus, we mapped SCEs using Strand-seq (Falconer et al., 2012). It has been shown that, at most, three ESCs eventually contribute to the formation of a 2n or 4n embryo out of 8–12 injected cells (Wang and Jaenisch, 2004). Thus, an iPSC clone that contains even only a few cells with genomic aberrations might still exhibit poor developmental potential. To overcome the heterogeneity observed within an iPSC colony, we measured SCEs at the single-cell level as opposed to the majority of the studies in the field that measured genomic instability of iPSCs by employing population-based analyses. Single cell sequencing libraries were made from MEFs, ESCs, two poor quality iPSC lines, Oct4-GFP OSKM#4 and Oct4-GFP OSKM#8, and two high-quality iPSC lines, Oct4-GFP SNEL#3 and Oct4-GFP SNEL#4, and SCE frequency was examined. As shown in Figures 5C, S5A, and S5B, both SNEL lines fall between the two OSKM lines, revealing no difference in SCE counts between the OSKM- and SNEL-iPSCs. We then hypothesized that long transient genomic instability during reprogramming could generate
NIH-PA Author Manuscript
NIH-PA Author Manuscript
cells with higher susceptibility to acquire chromosomal aberrations. To that end, we also examined the chromosome content by single cell sequencing. Interestingly, as observed previously for poor quality ESCs, trisomy of chromosome 8 was detected in the majority of the Oct4-GFP OSKM#8 iPSCs. To test whether trisomy 8 is a common aberration in iPSC lines, single cell sequencing libraries were made from 22 cell lines (one ESC line, eight OSKM lines, six OSK lines, and seven SNEL lines) that were cultured for only five passages. For each colony, single cells were sorted and sequenced. Out of the eight OSKM lines analyzed, three showed cells with trisomy 8: 6% of the Nanog-GFP OSKM#3 cells, 91% of the Nanog-GFP OSKM#2, and 95% of the Oct4-GFP OSKM#8 (Figure 5D). Out of the six OSK lines, four showed cells with trisomy 8: 4% of the Oct4-GFP OSK#8 cells, 8% of Oct4-GFP OSK#7, 8% of Oct4-GFP OSK#10, and 95% of Oct4-GFP OSK#9. No trisomy of chromosome 8 was detected in any of the other lines tested (Figures 5D, S5C, and S5D). On average, 21% of the OSKM cells and 19% of the OSK cells had a trisomy 8, versus 0% in the SNEL cells and the ESCs (p = 0.002 and p = 0.005, respectively). We also examined whether we could detect any clear difference in the frequency of aneuploidy between the lines once trisomy 8 was excluded from the analysis. On average, OSKM lines attained a 10% frequency of aneuploidy compared with 13% for the OSK lines, 9% for the SNEL lines, and 9% for the ESC line (differences are not significant). These results suggest that trisomy 8 is a common aberration in iPSCs-derived from a combination of factors that includes the key factors, Oct4, Sox2, and Klf4.
High-Quality SNEL-iPSCs Are Correlated with Faithful H2A.X Deposition Patterns
Defective H2A.X deposition frequently occurs in iPSC clones generated by OSKM factors that failed to support “all-iPS” mice development in tetraploid complementation
experiments (Wu et al., 2014). In addition, our results suggest that ectopic expression of OSKM in MEFs induces a strong DNA damage response that leads to the accumulation of
γ-H2A.X phosphorylation (Figure 5A). We therefore hypothesized that the genome-wide
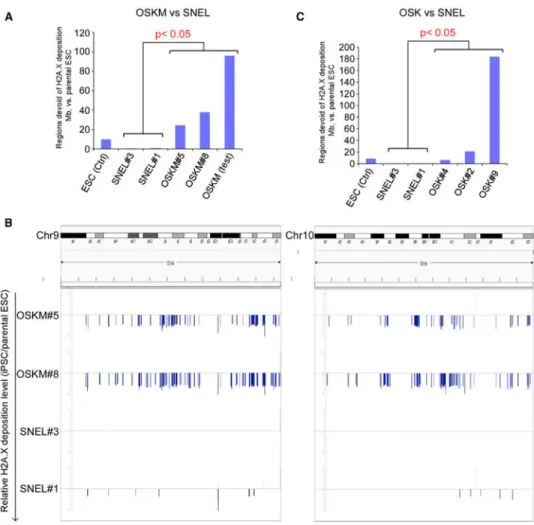
H2A.X deposition patterns might be intact in high-quality SNEL-iPSCs, while abnormal in poor quality OSKM-iPSCs and OSK-iPSCs. To test this hypothesis, we performed ChIP-seq for H2A.X on two poor quality OSKM-iPSC lines, Oct4-GFP OSKM#5 and Oct4-GFP OSKM#8, two high-quality SNEL-iPSC lines, Oct4-GFP SNEL#1 and Oct4-GFP SNEL#3, two high-quality OSK-iPSC lines, Oct4-GFP OSK#4 and Oct4-GFP OSK#2, and one poor quality OSK-iPSC line, Oct4-GFP OSK#9, and compared them to the parental Oct4-GFP ESCs. We used an established Hidden-Markov-Model (HMM) algorithm (Song and Smith, 2011) to inspect the differential H2A.X deposition regions in these cells (Wu et al., 2014). H2A.X deposition patterns in the high-quality Oct4-GFP SNEL#1 and SNEL#3 iPSC lines, were almost identical to the parental Oct4-GFP ESC line. Moreover, the number of H2A.X devoid regions was significantly lower in SNEL-iPSCs even compared to the control ESC line; devoid regions that mark the natural variations between ESC (e.g., the parental Oct4-GFP ESC versus 129SVj/c57 ESC control line) (Figures 6A and 6C). In contrast, H2A.X deposition patterns were greatly different in poor quality lines, GFP OSKM#5, Oct4-GFP OSKM#8, and another iPSC cell line (OSKM_test) generated by the secondary inducible system that failed tetraploid complementation assays (Stadtfeld et al., 2010); these clones had significantly more differential H2A.X deposition regions than the high-quality SNEL-iPSC clones in terms of the genome coverage (100- to 400-fold, p value < 0.05,
NIH-PA Author Manuscript
NIH-PA Author Manuscript
Wilcoxon test, Figures 6A and 6B). The same trend was observed in the OSK-iPSC lines. H2A.X deposition patterns were also greatly different in the poor quality line (p value < 0.05, Wilcoxon test, Figure 6C) and comparable to control ESCs in the high-quality OSK-iPSC lines. However, the differences between the high-quality OSK-OSK-iPSC lines and the parental Oct4-GFP ESC line were still greater than those between SNEL-iPSCs and the same parental ESCs. These results demonstrate a strong correlation between the capability to produce “all-iPSC” mice and the capability to faithfully recapitulate an intact H2A.X deposition. These data raise the possibility that SNEL reprogramming factors can generate frequently high-quality iPSCs by retaining intact H2A.X deposition throughout the genome.
Discussion
Tetraploid complementation is considered to be the most stringent assay for pluripotency and is frequently used to assess the quality of iPSCs. Even though iPSCs have been shown by several laboratories to be 4n competent, only a small fraction of the tested lines passed this most stringent test (Boland et al., 2009; Jiang et al., 2011, 2013; Kang et al., 2009; Pera, 2011; Zhao et al., 2009). Our experiments show that the rate of high-quality iPSCs as assessed by 4n competence is significantly influenced by the choice of factors used to induce reprogramming. We demonstrate that the SNEL factors, which are downstream targets of the late pluripotency factor Sox2 (Buganim et al., 2012), produce iPSCs that have a considerably higher competence to generate “all-iPSC” mice by 4n complementation than iPSCs produced by the conventional OSKM factors or other combinations such as OSK or OSSNE. The various iPSC lines that were produced throughout this study were generated, isolated and tested under identical conditions to rule out effects caused by variations in cell culture, method of factor delivery, the passage number of the lines, or blastocyst injections. While reprogramming by OSKM produced many colonies with shorter latency but with variable quality, reprogramming by SNEL yielded significantly fewer iPSCs the majority of which, however, were of high quality. This is reminiscent of previous studies in which similar transgenic OSKM systems producing iPSCs with different efficiencies resulted in different quality iPSCs, with the more efficient system (Stadtfeld et al., 2010) producing iPSCs of lower quality—as assessed by 4n complementation—than the less efficient system (Carey et al., 2011). These two studies suggest that high reprogramming efficiency may result in a low fraction of high-quality iPSCs.
To define molecular signature of 4n competency, we compared the transcriptional profile of poor, good and high-quality iPSCs. Genes involved in “Respiratory,” “Ischemia,” and “Myocardial infarction” separated high, good, and poor quality iPSCs consistent with the observation that poor quality iPSC lines produced “all-iPSC” pups that were either retarded in development or died in utero. Importantly, neither DNA methylation patterns, as revealed by whole genome bisulfite sequencing, nor the transcript level of key master regulators such as Oct4, Sox2, and Esrrb and the establishment of ESC-specific superenhancers could explain the difference in the transcriptional profile between the groups or could separate the groups by 4n proficiency. Instead, we demonstrated that a large number of OSKM/OSK-iPSCs acquire a unique genomic aberration at least in some fraction of cells. While the overall incidence of aneuploidy between MEFs, ESCs, and poor- and high-quality iPSC colonies was comparable, trisomy of chromosome 8 was solely observed in iPSCs that were
NIH-PA Author Manuscript
NIH-PA Author Manuscript
produced with a combination of factors that includes Oct4, Sox2, and Klf4. As shown previously, trisomy 8 ESCs have a proliferative advantage but poor developmental potential (Liu et al., 1997). Consistent with the notion that expression of OSKM or OSK leads to genome instability, we and others (González et al., 2013) demonstrated that expression of OSKM induces DNA damage as assessed by the accumulation of γ-H2A.X phosphorylation. This DNA damage led to cell death in ∼17% (a sum of an early and late apoptotic cells) of the OSKM-infected cells, showing that intense and, in some cases, irreversible DNA damage is caused by this combination of factors. In accordance with the accumulation of γ-H2A.X phosphorylation, the deposition of γ-H2A.X throughout the genome was abnormal in poor quality OSKM and OSK-iPSCs, as well. More importantly, high-quality SNEL-iPSC lines exhibited a significantly lower number of regions devoid of H2A.X deposition as compared to control ESC line or high-quality OSK-iPSC lines. Because histones regulate transcription, it is tempting to speculate that the aberrant deposition of H2A.X in poor quality iPSC lines might explain the mild difference in the gene expression between poor-and high-quality iPSCs.
In summary, our study provides a proof of principle that different combinations of reprogramming factors do not equally affect the biological characteristics of iPSCs, with some combinations consistently resulting in high-quality cells, whereas others generate cells of variable quality. While genomic instability and the deposition of H2A.X partially explain why poor quality iPSCs fail in the 4n complementation test, the reason why most colonies from other combinations of factors, that lack potent oncogenes such as OSSNE failed in this test, requires further investigation. Our results indicate that the interplay between the reprogramming factors is a crucial determinant for reprogramming efficiency and quality. This is consistent with the observation that conversion of cells into other cell types depends on the composition of reprogramming factors (Graf and Enver, 2009). Attempts to
reprogram human cells to pluripotency using SNEL reprogramming factors have so far failed (data not shown), suggesting that the activation of the core pluripotency circuitry of human cells might be different than that of the mouse or that the reprogramming efficiency of SNEL in human cells is drastically low so that one needs to infect a large number of fibroblasts in order to achieve reprogramming. Based on these results it will be important to define the most optimal factor combinations for reprogramming and to assess how different factor combinations might affect the quality of human iPSCs as a step forward toward transplantation therapy.
Experimental Procedures
Cell Culture and MiceMouse embryonic fibroblasts (MEFs) were grown in DMEM supplemented with 10% fetal bovine serum, 2 mM L-glutamine, and antibiotics. ESCs and iPSCs and were grown in DMEM supplemented with 15% fetal bovine serum, 1% nonessential amino acids, 2 mM L-glutamine, 2 × 10⁶ units mouse leukemia inhibitory factor (mLif), 0.1 mM
β-mercaptoethanol (Sigma), and antibiotics or in 2i medium. 2i medium (500 ml) was generated by including: 230 ml DMEM/F12 (Invitrogen; 11320), 230 ml Neurobasal medium (Invitrogen; 21103), 5 ml N2 supplement (Invitrogen; 17502048), 10 ml B27
NIH-PA Author Manuscript
NIH-PA Author Manuscript
supplement (Invitrogen; 17504044), 10 ml (2%) fetal bovine serum, 2 × 10⁶ units mLif, 1 mM glutamine (Invitrogen), 1% nonessential amino acids (Invitrogen), 0.1 mM β-mercaptoethanol (Sigma), penicillin-streptomycin (Invitrogen), 5 μg/ml BSA (Sigma), PD0325901 (PD, 1 μM), and CHIR99021 (CH, 3 μM). All the cells were maintained in a humidified incubator at 37°C and 5% CO2. For the primary infection, MEFs were isolated
from mice heterozygous for the reverse tetracycline-dependent transactivator (M2rtTA) that resides in the ubiquitously expressed Gt(ROSA)26Sor locus (Beard et al., 2006) and either with GFP that was knocked-in the Nanog or the Oct4 locus. All infections were performed on MEFs (passage 0) that were seeded at 70% confluence 2 days before the first infection. Animal care was in accordance with institutional guidelines and was approved by the Committee on Animal Care, Department of Comparative Medicine, Massachusetts Institute of Technology.
Tetraploid Embryo Complementation and Chimera Formation
Blastocyst injections were performed using (C57/Bl6×DBA) B6D2F2 host embryos. All
injected iPSC lines were derived from crosses of 129Sv/Jae to C57/Bl6 mice and could be
identified by agouti coat color. Embryos were obtained 24 hr (1 cell stage) or 40 hr (2 cell stage) posthuman chorionic gonadotropin (hCG) hormone priming. To obtain tetraploid (4n) blastocysts, electrofusion was performed at ∼44–47 hr post-hCG using a BEX LF-101 or LF-301 cell fusion apparatus (Protech International). Both fused and diploid embryos were cultured in EmbryoMax KSOM (Millipore) or Evolve KSOMaa (Zenith Biotech) until they formed blastocysts (94–98 hr after hCG injection) at which point they were placed in a drop of Evolve w/HEPES KSOMaa (Zenith) medium under mineral oil. A flat tip microinjection pipette with an internal diameter of 16 μm (Origio) was used for iPSC injections. Each blastocyst received 10–12 iPSCs. Shortly after injection, blastocysts were transferred to day 2.5 recipient CD1 females (20 blastocysts per female). Pups, when not born naturally, were recovered at day 19.5 by cesarean section and fostered to lactating Balb/c mothers.
SSLP Assay
PCR reactions were set up as previously described (Stadtfeld et al., 2012) using genomic DNA from the 4n pups and primers reported to detect polymorphisms in the genome of inbred mouse strains (D8Mit94-F: GTTGGG GCTCTGCTCTCTC; D8Mit94-R:
CACATATGCATAC ATATACATACACGT; D2Mit102-F: TTCCCTGTCACTCCTCCC; D2Mit102-R: TGTCTTT ATGCTCA GACATACACA). As controls, genomic DNA was analyzed from cultured iPSCs used for injections and adult mice (B6D2F1) that served as
hosts for the blastocysts. The reactions were performed with 100 ng DNA for 30 cycles of 30 s at 94°C, 30 s at 60°C, and 60 s at 72°C. The products were analyzed on a 3% agarose gel.
Gene Expression Microarrays
Two micrograms of RNA extracted using the RNeasy kit (QIAGEN) from each iPSC and ESC were tested by Agilent BioAnalyzer assays to ensure sample integrity. Technical duplicates of each sample were run on Agilent SurePrint G3 8×60K microarrays per
NIH-PA Author Manuscript
NIH-PA Author Manuscript
manufacturer's instructions. Raw expression values were quantile normalized and binary log values of technical duplicate averages used for downstream analyses.
Gene Expression Analyses
Standardized scoring was used to normalize microarray expression values. To generate heatmaps, expression values were used as input to perform clustering by samples in R, using the heatmap.2 function of the gplots library package with the default Euclidean distance parameter. In parallel, normalized expression values were used to group samples by principle component analysis using the R princomp function. Gene ontology analysis was performed using the publicly available GeneDecks V3 software suite available at http:// www.genecards.org/.
Whole-Genome Bisulfite Library Preparation and Sequencing
Bisulfite treatment and sequencing library preparation were performed as previously described (Lister et al., 2011). Briefly, genomic DNA from each iPSC and ESC was fragmented by sonication prior to ligation of methylated sequencing adaptors. Fragments were size-selected by gel electrophoresis and purification, treated with sodium-bisulfite and amplified with four cycles of PCR to generate libraries that were sequenced on the Illumina HiSeq platform. Fastq output files were aligned using bowtie (Langmead et al., 2009).
Illumina Sequencing
Libraries were pooled for sequencing and 200 to 400 bp size range fragments were purified using a 2% E-Gel Agarose Gel (Invitrogen). DNA quality was assessed and quantified on a High Sensitivity dsDNA kit (Agilent) on the Agilent 2100 Bio-Analyzer and on the Qubit 2.0 Fluorometer (Life Technologies). For sequencing, clusters were generated on the CBot (HiSeq2500), and single-end 50 bp reads were generated using the HiSeq2500 sequencing platform (Illumina).
Bioinformatic Analysis
Demultiplexed fastq files were aligned to the mouse reference genome assembly (GRCm38/ mm10) using short read aligner Bowtie2 (version 2.0.5) (Langmead and Salzberg, 2012) with default settings. Sorted and indexed bam files were processed as previously described (Falconer et al., 2012) using the BAIT software package (Hills et al., 2013). Briefly, diploid and aneuploid chromosomes were identified by calculating the average numbers of
reads/Mb for each chromosome in the library. Monosomies and trisomies were classified when chromosomes had an average read count 0.66× lower or 1.33× higher, respectively than the average reads per Mb for diploid chromosomes in the library.
Statistics
The average frequency of trisomy 8 and aneuploidy per cell type was determined and p values were calculated using binomial distribution models.
NIH-PA Author Manuscript
NIH-PA Author Manuscript
Chromatin Immunoprecipitation for Med1 Distribution
Cells were crosslinked for 10 min at room temperature by the addition of one-tenth of the volume of 11% formaldehyde solution (11% formaldehyde, 50 mM HEPES [pH7.3], 100 mM NaCl, 1 mM EDTA [pH 8.0], 0.5 mM EGTA [pH 8.0]) to the growth media. Cells were washed twice with PBS, then the supernatant was aspirated and the cell pellet was flash frozen in liquid nitrogen. Frozen crosslinked cells were stored at −80°C. Dynal magnetic beads (100 μl) (Sigma) were blocked with 0.5% BSA (w/v) in PBS. Magnetic beads were bound with 10 μg of the indicated antibody. For Med1 (CRSP1/TRAP220) occupied genomic regions, we performed ChIP-seq experiments using a Bethyl Laboratories antibody (A300-793A, lot A300-783A-2) or a Santa Cruz Biotechnology antibody (SC-5334X, lot A1112).
Crosslinked cells were lysed with lysis buffer 1 (50 mM HEPES [pH 7.3], 140 mM NaCl, 1 mM EDTA, 10% glycerol, 0.5% NP-40, and 0.25% Triton X-100) and resuspended and sonicated in sonication buffer (20 mM Tris-HCl [pH 8.0], 150 mM NaCl, 2 mM EDTA [pH 8.0], 0.1% SDS, and 1% Triton X-100). Cells were sonicated for ten cycles at 30 s each on ice (18–21 W) with 60 s on ice between cycles. Sonicated lysates were cleared and incubated overnight at 4°C with magnetic beads bound with antibody to enrich for DNA fragments bound by the indicated factor. Beads were washed two times with sonication buffer, one time with sonication buffer with 500 mM NaCl, one time with LiCl wash buffer (10 mM Tris [pH 8.0], 1 mM EDTA, 250 mM LiCl, 1% NP-40), and one time with TE with 50 mM NaCl. DNA was eluted in elution buffer (50 mM Tris-HCL [pH 8.0], 10 mM EDTA, 1% SDS). Crosslinks were reversed overnight. RNA and protein were digested using RNase A and Proteinase K, respectively, and DNA was purified with phenol chloroform extraction and ethanol precipitation.
Illumina Sequencing and Library Generation
Purified ChIP DNA was used to prepare Illumina multiplexed sequencing libraries. Libraries for Illumina sequencing were prepared following the Illumina TruSeq DNA Sample
Preparation v2 kit protocol with the following exceptions. After end-repair and A-tailing, immunoprecipitated DNA (∼10–50 ng) or Whole Cell Extract DNA (50 ng) was ligated to a 1:50 dilution of Illumina Adaptor Oligo Mix assigning one of 24 unique indexes in the kit to each sample. Following ligation, libraries were amplified by 18 cycles of PCR using the HiFi NGS Library Amplification kit from KAPA Biosystems. Amplified libraries were then size-selected using a 2% gel cassette in the Pippin Prep system from Sage Science set to capture fragments between 200 and 400 bp. Libraries were quantified by qPCR using the KAPA Biosystems Illumina Library Quantification kit according to kit protocols. Libraries with distinct TruSeq indexes were multiplexed by mixing at equimolar ratios and running together in a lane on the Illumina HiSeq 2000 for 40 bases in single read mode.
ChIP-seq Analysis
Mouse ESC superenhancers were downloaded from Whyte et al. (2013). Briefly, these superenhancers were identified by (1) intersecting regions enriched in Oct4, Sox2, and Nanog ChIP-seq to locate constituent enhancers, (2) stitching proximal enhancers into domains, and (3) separating superenhancers from typical enhancers by signal of Med1.
NIH-PA Author Manuscript
NIH-PA Author Manuscript
ChIP-seq reads for Med1 in all cell types were aligned to the mouse mm9 reference genome using bowtie (Langmead et al., 2009) with command-line parameters -k 1 -m 1−best -n 2. Duplicate (multiple reads per position) reads were removed. Reads were artificially
extended 200 bp downstream and their reads-per-million normalized density was calculated in mES superenhancers as described in (Lin et al., 2012). These densities were then hierarchically clustered in two dimensions using heatmap.2.
Supplementary Material
Refer to Web version on PubMed Central for supplementary material.
Acknowledgments
We thank Biology and Research Computing (BaRC), especially Prathapan Thiru at the Whitehead Institute's Center for Microarray Technology, for computational and technical assistance. Y.B. was supported by an NIH Kirschstein National Research Service Award (1 F32GM099153-01A1). D.A.F. is a Vertex Scholar and was supported by a National Science Foundation (NSF) Graduate Research Fellowship and Jerome and Florence Brill Graduate Student Fellowship. R.J. is an adviser to Stemgent and a cofounder of Fate Therapeutics. J.R.E. is an investigator of the Howard Hughes Medical Institute. This research project was supported by NIH grants HD 045022 and
R37CA084198 to R.J., the Gordon and Betty Moore Foundation (GMBF3034) and Chapman Foundation grants to J.R.E., and the Israeli Centers of Research Excellence (I-CORE) program (Center No. 41/11) grant to Y.B.
References
Audo I, Bujakowska KM, Léveillard T, Mohand-Saïd S, Lancelot ME, Germain A, Antonio A, Michiels C, Saraiva JP, Letexier M, et al. Development and application of a next-generation-sequencing (NGS) approach to detect known and novel gene defects underlying retinal diseases. Orphanet J Rare Dis. 2012; 7:8. [PubMed: 22277662]
Bar-Nur O, Russ HA, Efrat S, Benvenisty N. Epigenetic memory and preferential lineage-specific differentiation in induced pluripotent stem cells derived from human pancreatic islet beta cells. Cell Stem Cell. 2011; 9:17–23. [PubMed: 21726830]
Barlow JH, Faryabi RB, Callén E, Wong N, Malhowski A, Chen HT, Gutierrez-Cruz G, Sun HW, McKinnon P, Wright G, et al. Identification of early replicating fragile sites that contribute to genome instability. Cell. 2013; 152:620–632. [PubMed: 23352430]
Beard C, Hochedlinger K, Plath K, Wutz A, Jaenisch R. Efficient method to generate single-copy transgenic mice by site-specific integration in embryonic stem cells. Genesis. 2006; 44:23–28. [PubMed: 16400644]
Boland MJ, Hazen JL, Nazor KL, Rodriguez AR, Gifford W, Martin G, Kupriyanov S, Baldwin KK. Adult mice generated from induced pluripotent stem cells. Nature. 2009; 461:91–94. [PubMed: 19672243]
Bonner WM, Redon CE, Dickey JS, Nakamura AJ, Sedelnikova OA, Solier S, Pommier Y. GammaH2AX and cancer. Nat Rev Cancer. 2008; 8:957–967. [PubMed: 19005492] Brambrink T, Hochedlinger K, Bell G, Jaenisch R. ES cells derived from cloned and fertilized
blastocysts are transcriptionally and functionally indistinguishable. Proc Natl Acad Sci USA. 2006; 103:933–938. [PubMed: 16418286]
Buganim Y, Faddah DA, Cheng AW, Itskovich E, Markoulaki S, Ganz K, Klemm SL, van
Oudenaarden A, Jaenisch R. Single-cell expression analyses during cellular reprogramming reveal an early stochastic and a late hierarchic phase. Cell. 2012; 150:1209–1222. [PubMed: 22980981] Buganim Y, Faddah DA, Jaenisch R. Mechanisms and models of somatic cell reprogramming. Nat
Rev Genet. 2013; 14:427–439. [PubMed: 23681063]
Carey BW, Markoulaki S, Hanna JH, Faddah DA, Buganim Y, Kim J, Ganz K, Steine EJ, Cassady JP, Creyghton MP, et al. Reprogramming factor stoichiometry influences the epigenetic state and biological properties of induced pluripotent stem cells. Cell Stem Cell. 2011; 9:588–598. [PubMed: 22136932]
NIH-PA Author Manuscript
NIH-PA Author Manuscript
Chen J, Liu J, Chen Y, Yang J, Chen J, Liu H, Zhao X, Mo K, Song H, Guo L, et al. Rational optimization of reprogramming culture conditions for the generation of induced pluripotent stem cells with ultra-high efficiency and fast kinetics. Cell Res. 2011; 21:884–894. [PubMed: 21445094]
Chin MH, Mason MJ, Xie W, Volinia S, Singer M, Peterson C, Ambartsumyan G, Aimiuwu O, Richter L, Zhang J, et al. Induced pluripotent stem cells and embryonic stem cells are distinguished by gene expression signatures. Cell Stem Cell. 2009; 5:111–123. [PubMed: 19570518]
Cho J, Chang H, Kwon SC, Kim B, Kim Y, Choe J, Ha M, Kim YK, Kim VN. LIN28A is a suppressor of ER-associated translation in embryonic stem cells. Cell. 2012; 151:765–777. [PubMed: 23102813]
Doi A, Park IH, Wen B, Murakami P, Aryee MJ, Irizarry R, Herb B, Ladd-Acosta C, Rho J, Loewer S, et al. Differential methylation of tissue- and cancer-specific CpG island shores distinguishes human induced pluripotent stem cells, embryonic stem cells and fibroblasts. Nat Genet. 2009; 41:1350–1353. [PubMed: 19881528]
Esteban MA, Pei D. Vitamin C improves the quality of somatic cell reprogramming. Nat Genet. 2012; 44:366–367. [PubMed: 22456737]
Falconer E, Hills M, Naumann U, Poon SS, Chavez EA, Sanders AD, Zhao Y, Hirst M, Lansdorp PM. DNA template strand sequencing of single-cells maps genomic rearrangements at high resolution. Nat Methods. 2012; 9:1107–1112. [PubMed: 23042453]
Festuccia N, Osorno R, Halbritter F, Karwacki-Neisius V, Navarro P, Colby D, Wong F, Yates A, Tomlinson SR, Chambers I. Esrrb is a direct Nanog target gene that can substitute for Nanog function in pluripotent cells. Cell Stem Cell. 2012; 11:477–490. [PubMed: 23040477] González F, Georgieva D, Vanoli F, Shi ZD, Stadtfeld M, Ludwig T, Jasin M, Huangfu D.
Homologous recombination DNA repair genes play a critical role in reprogramming to a pluripotent state. Cell Reports. 2013; 3:651–660. [PubMed: 23478019]
Gore A, Li Z, Fung HL, Young JE, Agarwal S, Antosiewicz-Bourget J, Canto I, Giorgetti A, Israel MA, Kiskinis E, et al. Somatic coding mutations in human induced pluripotent stem cells. Nature. 2011; 471:63–67. [PubMed: 21368825]
Graf T, Enver T. Forcing cells to change lineages. Nature. 2009; 462:587–594. [PubMed: 19956253] Hanna LA, Foreman RK, Tarasenko IA, Kessler DS, Labosky PA. Requirement for Foxd3 in
maintaining pluripotent cells of the early mouse embryo. Genes Dev. 2002; 16:2650–2661. [PubMed: 12381664]
Hills M, O'Neill K, Falconer E, Brinkman R, Lansdorp PM. BAIT: organizing genomes and mapping rearrangements in single cells. Genome Med. 2013; 5:82. [PubMed: 24028793]
Hnisz D, Abraham BJ, Lee TI, Lau A, Saint-André V, Sigova AA, Hoke HA, Young RA. Super-enhancers in the control of cell identity and disease. Cell. 2013; 155:934–947. [PubMed: 24119843]
Hussein SM, Batada NN, Vuoristo S, Ching RW, Autio R, Närvä E, Ng S, Sourour M, Hämäläinen R, Olsson C, et al. Copy number variation and selection during reprogramming to pluripotency. Nature. 2011; 471:58–62. [PubMed: 21368824]
Jiang J, Ding G, Lin J, Zhang M, Shi L, Lv W, Yang H, Xiao H, Pei G, Li Y, et al. Different
developmental potential of pluripotent stem cells generated by different reprogramming strategies. J Mol Cell Biol. 2011; 3:197–199. [PubMed: 21624975]
Jiang J, Lv W, Ye X, Wang L, Zhang M, Yang H, Okuka M, Zhou C, Zhang X, Liu L, et al. Zscan4 promotes genomic stability during reprogramming and dramatically improves the quality of iPS cells as demonstrated by tetraploid complementation. Cell Res. 2013; 23(1):92–106. [PubMed: 23147797]
Kang L, Wang J, Zhang Y, Kou Z, Gao S. iPS cells can support full-term development of tetraploid blastocyst-complemented embryos. Cell Stem Cell. 2009; 5:135–138. [PubMed: 19631602] Kim K, Doi A, Wen B, Ng K, Zhao R, Cahan P, Kim J, Aryee MJ, Ji H, Ehrlich LI, et al. Epigenetic
memory in induced pluripotent stem cells. Nature. 2010; 467:285–290. [PubMed: 20644535]
NIH-PA Author Manuscript
NIH-PA Author Manuscript
Kim K, Zhao R, Doi A, Ng K, Unternaehrer J, Cahan P, Huo H, Loh YH, Aryee MJ, Lensch MW, et al. Donor cell type can influence the epigenome and differentiation potential of human induced pluripotent stem cells. Nat Biotechnol. 2011; 29:1117–1119. [PubMed: 22119740]
Klemm S, Semrau S, Wiebrands K, Mooijman D, Faddah DA, Jaenisch R, van Oudenaarden A. Transcriptional profiling of cells sorted by RNA abundance. Nat Methods. 2014; 11:549–551. [PubMed: 24681693]
Langmead B, Salzberg SL. Fast gapped-read alignment with Bowtie 2. Nat Methods. 2012; 9:357–359. [PubMed: 22388286]
Langmead B, Trapnell C, Pop M, Salzberg SL. Ultrafast and memory-efficient alignment of short DNA sequences to the human genome. Genome Biol. 2009; 10:R25. [PubMed: 19261174] Laurent LC, Ulitsky I, Slavin I, Tran H, Schork A, Morey R, Lynch C, Harness JV, Lee S, Barrero MJ,
et al. Dynamic changes in the copy number of pluripotency and cell proliferation genes in human ESCs and iPSCs during reprogramming and time in culture. Cell Stem Cell. 2011; 8:106–118. [PubMed: 21211785]
Lin CY, Lovén J, Rahl PB, Paranal RM, Burge CB, Bradner JE, Lee TI, Young RA. Transcriptional amplification in tumor cells with elevated c-Myc. Cell. 2012; 151:56–67. [PubMed: 23021215] Lister R, Pelizzola M, Kida YS, Hawkins RD, Nery JR, Hon G, Antosiewicz-Bourget J, O'Malley R,
Castanon R, Klugman S, et al. Hotspots of aberrant epigenomic reprogramming in human induced pluripotent stem cells. Nature. 2011; 471:68–73. [PubMed: 21289626]
Liu Y, Labosky PA. Regulation of embryonic stem cell self-renewal and pluripotency by Foxd3. Stem Cells. 2008; 26:2475–2484. [PubMed: 18653770]
Liu X, Wu H, Loring J, Hormuzdi S, Disteche CM, Bornstein P, Jaenisch R. Trisomy eight in ES cells is a common potential problem in gene targeting and interferes with germ line transmission. Dev Dyn. 1997; 209:85–91. [PubMed: 9142498]
Marión RM, Strati K, Li H, Murga M, Blanco R, Ortega S, Fernandez-Capetillo O, Serrano M, Blasco MA. A p53-mediated DNA damage response limits reprogramming to ensure iPS cell genomic integrity. Nature. 2009; 460:1149–1153. [PubMed: 19668189]
Mayshar Y, Ben-David U, Lavon N, Biancotti JC, Yakir B, Clark AT, Plath K, Lowry WE, Benvenisty N. Identification and classification of chromosomal aberrations in human induced pluripotent stem cells. Cell Stem Cell. 2010; 7:521–531. [PubMed: 20887957]
Müller LU, Milsom MD, Harris CE, Vyas R, Brumme KM, Parmar K, Moreau LA, Schambach A, Park IH, London WB, et al. Overcoming reprogramming resistance of Fanconi anemia cells. Blood. 2012; 119:5449–5457. [PubMed: 22371882]
Nie Z, Hu G, Wei G, Cui K, Yamane A, Resch W, Wang R, Green DR, Tessarollo L, Casellas R, et al. c-Myc is a universal amplifier of expressed genes in lymphocytes and embryonic stem cells. Cell. 2012; 151:68–79. [PubMed: 23021216]
Ohi Y, Qin H, Hong C, Blouin L, Polo JM, Guo T, Qi Z, Downey SL, Manos PD, Rossi DJ, et al. Incomplete DNA methylation underlies a transcriptional memory of somatic cells in human iPS cells. Nat Cell Biol. 2011; 13:541–549. [PubMed: 21499256]
Pan G, Pei D. Order from chaos: single cell reprogramming in two phases. Cell Stem Cell. 2012; 11:445–447. [PubMed: 23040472]
Pera MF. Stem cells: The dark side of induced pluripotency. Nature. 2011; 471:46–47. [PubMed: 21368819]
Phanstiel DH, Brumbaugh J, Wenger CD, Tian S, Probasco MD, Bailey DJ, Swaney DL, Tervo MA, Bolin JM, Ruotti V, et al. Proteomic and phosphoproteomic comparison of human ES and iPS cells. Nat Methods. 2011; 8:821–827. [PubMed: 21983960]
Polo JM, Liu S, Figueroa ME, Kulalert W, Eminli S, Tan KY, Apostolou E, Stadtfeld M, Li Y, Shioda T, et al. Cell type of origin influences the molecular and functional properties of mouse induced pluripotent stem cells. Nat Biotechnol. 2010; 28:848–855. [PubMed: 20644536]
Raj A, Rifkin SA, Andersen E, van Oudenaarden A. Variability in gene expression underlies incomplete penetrance. Nature. 2010; 463:913–918. [PubMed: 20164922]
Shah SN, Kerr C, Cope L, Zambidis E, Liu C, Hillion J, Belton A, Huso DL, Resar LM. HMGA1 reprograms somatic cells into pluripotent stem cells by inducing stem cell transcriptional networks. PLoS ONE. 2012; 7:e48533. [PubMed: 23166588]
NIH-PA Author Manuscript
NIH-PA Author Manuscript
Song Q, Smith AD. Identifying dispersed epigenomic domains from ChIP-Seq data. Bioinformatics. 2011; 27:870–871. [PubMed: 21325299]
Stadtfeld M, Apostolou E, Akutsu H, Fukuda A, Follett P, Natesan S, Kono T, Shioda T, Hochedlinger K. Aberrant silencing of imprinted genes on chromosome 12qF1 in mouse induced pluripotent stem cells. Nature. 2010; 465:175–181. [PubMed: 20418860]
Stadtfeld M, Apostolou E, Ferrari F, Choi J, Walsh RM, Chen T, Ooi SS, Kim SY, Bestor TH, Shioda T, et al. Ascorbic acid prevents loss of Dlk1-Dio3 imprinting and facilitates generation of all-iPS cell mice from terminally differentiated B cells. Nat Genet. 2012; 44:398–405. S1–S2. [PubMed: 22387999]
Stelzer G, Inger A, Olender T, Iny-Stein T, Dalah I, Harel A, Safran M, Lancet D. GeneDecks: paralog hunting and gene-set distillation with GeneCards annotation. OMICS. 2009; 13:477–487.
[PubMed: 20001862]
Vafa O, Wade M, Kern S, Beeche M, Pandita TK, Hampton GM, Wahl GM. c-Myc can induce DNA damage, increase reactive oxygen species, and mitigate p53 function: a mechanism for oncogene-induced genetic instability. Mol Cell. 2002; 9:1031–1044. [PubMed: 12049739]
Viswanathan SR, Powers JT, Einhorn W, Hoshida Y, Ng TL, Toffanin S, O'Sullivan M, Lu J, Phillips LA, Lockhart VL, et al. Lin28 promotes transformation and is associated with advanced human malignancies. Nat Genet. 2009; 41:843–848. [PubMed: 19483683]
Wang Z, Jaenisch R. At most three ES cells contribute to the somatic lineages of chimeric mice and of mice produced by ES-tetraploid complementation. Dev Biol. 2004; 275:192–201. [PubMed: 15464582]
Weinhold B, Schratt G, Arsenian S, Berger J, Kamino K, Schwarz H, Rüther U, Nordheim A. Srf(-/-) ES cells display non-cell-autonomous impairment in mesodermal differentiation. EMBO J. 2000; 19:5835–5844. [PubMed: 11060034]
West JA, Viswanathan SR, Yabuuchi A, Cunniff K, Takeuchi A, Park IH, Sero JE, Zhu H, Perez-Atayde A, Frazier AL, et al. A role for Lin28 in primordial germ-cell development and germ-cell malignancy. Nature. 2009; 460:909–913. [PubMed: 19578360]
Whyte WA, Orlando DA, Hnisz D, Abraham BJ, Lin CY, Kagey MH, Rahl PB, Lee TI, Young RA. Master transcription factors and mediator establish super-enhancers at key cell identity genes. Cell. 2013; 153:307–319. [PubMed: 23582322]
Wu T, Liu Y, Wen D, Tseng Z, Tahmasian M, Zhong M, Rafii S, Stadtfeld M, Hochedlinger K, Xiao A. Histone Variant H2A.X Deposition Pattern Serves as a Functional Epigenetic Mark for Distinguishing the Developmental Potentials of iPSCs. Cell Stem Cell. 2014; 15:281–294. this issue. [PubMed: 25192463]
Zhao XY, Li W, Lv Z, Liu L, Tong M, Hai T, Hao J, Guo CL, Ma QW, Wang L, et al. iPS cells produce viable mice through tetraploid complementation. Nature. 2009; 461:86–90. [PubMed: 19672241]
Zhu H, Shah S, Shyh-Chang N, Shinoda G, Einhorn WS, Viswanathan SR, Takeuchi A, Grasemann C, Rinn JL, Lopez MF, et al. Lin28a transgenic mice manifest size and puberty phenotypes identified in human genetic association studies. Nat Genet. 2010; 42:626–630. [PubMed: 20512147] Zhu H, Shyh-Chang N, Segrè AV, Shinoda G, Shah SP, Einhorn WS, Takeuchi A, Engreitz JM, Hagan
JP, Kharas MG, et al. The Lin28/let-7 axis regulates glucose metabolism. Cell. 2011; 147:81–94. [PubMed: 21962509]
NIH-PA Author Manuscript
NIH-PA Author Manuscript
Figure 1. Characterization of SNEL-iPSC Lines
(A) Schematic presentation of Bayesian network demonstrates the hierarchy of a subset of pluripotent genes that leads to a stable and transgene independent pluripotency state (Buganim et al., 2012). Sall4, Nanog, Esrrb, and Nanog (SNEL) are marked by a red circle. (B) Representative images of two stable dox-independent, GFP-positive colonies (Nanog-GFP SNEL#1 and Oct4-(Nanog-GFP SNEL#3) and immunostaining for Sall4, Sox2, Utf1, and Esrrb.
(C) Heatmap demonstrating the relative expression levels of Dppa3, Dppa2, Zfp42 (Rex1), and Lin28 normalized to the Hprt housekeeping control gene in the indicated samples. (D) Hematoxylin and eosin staining of teratoma sections generated from Oct4-GFP SNEL#1 showing structures from all three layers.
See also Figure S1.
NIH-PA Author Manuscript
NIH-PA Author Manuscript
Figure 2. SNEL-iPSCs Produce “All-iPSC” Mice with High Success Rates as Compared to OSKM
(A) Percent of injected blastocysts surviving to birth are plotted for OSKM and SNEL lines, with the number of blastocysts noted on the x axis. Blue represents the number of pups that merely survived delivery, red the number of pups additionally foster-nursed. Percentages were compared by χ2 test to compute significance.
(B) Representative images of 4n adult mice produced from GFP SNEL#1 and Oct4-GFP SNEL#4 lines and their F1 generation.
(C) Confirmation of origin of “all-iPSC” mice by PCR for strain-specific polymorphisms. Two different simple sequence polymorphism (SSLP) markers were tested using genomic DNA isolated from tissues of “all-iPSC” mice. Genomic DNA from the parental iPSCs (donor cells), a 129 Sv/Jae mouse (donor strain), and a B6D2F1 mouse (host blastocyst strain) served as controls.
See also Figure S2.
NIH-PA Author Manuscript
NIH-PA Author Manuscript
Figure 3. Unbiased Comparative Transcriptome Analyses Distinguish iPSCs According to Their 4n Proficiency
(A) Hierarchical clustering of global gene expression profiles for two microarray technical replicates for every iPSC and ESC (reference) line. Replicate pairs were assigned a shared numerical value.
(B) Hierarchical clustering of all genes (n = 1,765) exhibiting significant variation (p < 0.01 by F test) across all ESC and iPSC samples.
(C) Principle component analysis for genes from (B). Each of the iPSC and ESC groups is marked by specific color and is surrounded by a circle. The numbers inside the circles correspond to the numbers in (A).
(D) qRT-PCR of the Col6a1 and Thsb1 normalized to the Hprt housekeeping control gene in the indicated samples. Error bars are presented as a mean ± SD of two duplicate runs from a typical experiment. The numbers on the x axis correspond to the numbers in (A).
(E) Gene ontology analysis using the GeneDecks (Stelzer et al., 2009) algorithm of genes from (A).
(F) Hierarchical clustering of 2,628 differentially methylated regions (DMRs) derived from whole genome bisulfite sequencing does not segregate samples by either reprogramming factor combinations or ESC versus iPSC status. Each group (poor, good, high, and ESCs) is marked by a different color. Sample numbers correspond to the numbers in (A).
See also Figure S3.
NIH-PA Author Manuscript
NIH-PA Author Manuscript
Figure 4. The Transcript Number of Key Master Regulators and the Establishment of ESC-Specific Superenhancers Are Comparable between Poor- and High-Quality iPSCs
(A) sm-mRNA-FISH experiments depict the transcript number of Oct4 versus Sox2 and Oct4 versus Esrrb in single cells from the indicated iPSC lines. n, represents the number of single cells analyzed.
(B) ChIP-seq binding profiles for Oct4, Sox2, and Nanog (merged, OSN) in V6.5 mESCs and Med1 for the indicated cell lines at the Sox2 locus. Location of the superenhancer, as defined in V6.5 mESCs (Whyte et al., 2013), is indicated by the red bar. Rpm/bp, reads per million per base pair.
(C) Hierarchical clustering of Med1 densities in superenhancers recapitulates phylogeny of cell types. ChIP-seq read densities for Med1 were calculated in mES superenhancers. Clustering these densities indicates that cell types of similar origin have similar signal of Med1 in superenhancers. All ChIP-seq was performed with a Bethyl Laboratories antibody (A300-793A, lot A300-783A), except for the farthest right V6.5 ChIP, which was performed with a Santa Cruz Biotechnology antibody (SC-5334X, lot A1112).
See also Figure S4.
NIH-PA Author Manuscript
NIH-PA Author Manuscript
Figure 5. Trisomy of Chromosome 8 Is a Frequent Genomic Aberration in Poor-Quality OSK/ OSKM-iPSCs
(A) Western blot analysis for the DNA damage sensor, γ-H2A.X phosphorylation, and the housekeeping control protein Gapdh, 7 days postdox exposure in MEFs infected with the indicated dox-inducible reprogramming factors.
(B) FACS analyses demonstrating the percentage of cells from (A) that initiated the apoptotic process as assessed by PI and Annexin V.
(C) Graph summarizing the average number of sister chromatid exchanges (SCEs) occurring at the single cell level in the indicated lines using the Strand-seq technique. n, represents the number of single cells tested. Error bars are presented as a mean ± SD of the indicated “n” examined single cells.
(D) Graph summarizing the frequency of trisomy 8 observed in the indicated colonies. See also Figure S5.
NIH-PA Author Manuscript
NIH-PA Author Manuscript
Figure 6. H2A.X Deposition Pattern Can Distinguish SNEL and OSK or OSKM iPSC Lines
(A) The bar chart illustrates that the genome coverage of defective H2A.X deposition regions in OSKM-iPSC lines (n = 3) are significantly higher than those in 4N+ SNEL-iPSC lines (n = 2) or the ESC control line (p value < 0.05, Wilcoxon rank sum test).
(B) Comparative H2A.X depositions in SNEL iPSC and OSKM iPSC at two chromosomes (left: Chr9; right: Chr10). y axis: relative H2A.X deposition level (RSEG score, as compared to the ESC parental line, see Experimental Procedures). Positive value: regions enriched for H2A.X deposition over control (gray bars); negative values: regions devoid of H2A.X deposition over control (blue bars).
(C) The bar chart illustrates that the genome coverage of H2A.X defective deposition regions in OSK-iPSC lines are significantly higher than those in SNEL-iPSC lines (n = 2) (p value < 0.05, Wilcoxon rank sum test).
NIH-PA Author Manuscript
NIH-PA Author Manuscript
NIH-PA Author Manuscript
NIH-PA Author Manuscript
NIH-PA Author Manuscript
Table 1
Generation of “All-iPSC” Mice Produced by Various Combinations of Reprogramming Factors
Cell Line
Injected Embryos
Recipient Females
Implantation Sites
Dead Fetuses and Pups
a (%)
Pups Born Alive
b (%) Fostered Pups c (%) Oct4-GFP SNEL#1 60 3 6 1 (1.6) 2 (3.3) 1 (1.6) Oct4-GFP SNEL#2 60 3 9 3 (5.0) 9 (15.0) 8 (13.3) Oct4-GFP SNEL#3 60 3 9 2 (3.3) 14 (23.3) 13 (21.6) Oct4-GFP SNEL#4 60 3 15 3 (5.0) 11 (18.3) d 6 (10.0) Nanog-GFP SNEL#1 60 3 18 1 (1.6) 9 (15.0) 8 (13.3) Nanog-GFP SNEL#2 60 3 12 0 (0.0) 15 (25.0) 14 (23.3) Nanog-GFP SNEL#3 60 3 22 2 (3.3) 2 (3.3) 1 (1.6) Nanog-GFP SNEL#4 60 3 3 0 (0.0) 0 (0.0) 0 (0.0) Nanog-GFP SNEL#5 60 3 7 0 (0.0) 0 (0.0) 0 (0.0) Nanog-GFP SNEL#6 60 3 22 1 (1.6) 2 (3.3) 0 (0.0) Total (Average) 60 3 13.3 1.3 (2.1) 6.4 (10.7) 5.1 (8.5) Oct4-GFP OSKM#2 60 3 18 0 (0.0) 4 (6.6) d 2 (3.3) Oct4-GFP OSKM#3 60 3 16 0 (0.0) 5 (8.3) e 3 (5.0) Oct4-GFP OSKM#4 60 3 37 1 (1.6) 0 (0.0) 0 (0.0) Oct4-GFP OSKM#5 60 3 12 0 (0.0) 0 (0.0) 0 (0.0) Oct4-GFP OSKM#6 60 3 29 1 (1.6) 1 (1.6) 1 (1.6) Oct4-GFP OSKM#7 60 3 25 1 (1.6) 3 (5.0) 2 (3.3) Oct4-GFP OSKM#8 60 3 16 0 (0.0) 0 (0.0) 0 (0.0) Nanog-GFP OSKM#1 60 3 12 0 (0.0) 0 (0.0) 0 (0.0) Nanog-GFP OSKM#2 60 3 24 0 (0.0) 0 (0.0) 0 (0.0) Nanog-GFP OSKM#3 60 3 11 0 (0.0) 0 (0.0) 0 (0.0) Total (average) 60 3 20 0.3 (0.48) 1.3 (2.1) 0.8 (1.7) Oct4-GFP OSK#1 60 3 14 0 (0.0) 3 (5.0) 3 (5.0) Oct4-GFP OSK#2 60 3 18 2 (3.3) 2 (3.3) 2 (3.3) Oct4-GFP OSK#3 60 3 13 0 (0.0) 2 (3.3) 2 (3.3) Oct4-GFP OSK#4 60 3 3 2 (3.3) 13 (21.6) 13 (21.6)
NIH-PA Author Manuscript
NIH-PA Author Manuscript
NIH-PA Author Manuscript
Cell Line
Injected Embryos
Recipient Females
Implantation Sites
Dead Fetuses and Pups
a (%)
Pups Born Alive
b (%) Fostered Pups c (%) Oct4-GFP OSK#5 60 3 0 5 (8.3) 5 (8.3) d 4 (6.6) Oct4-GFP OSK#6 60 3 6 0 (0.0) 1 (1.6) 1 (1.6) Oct4-GFP OSK#7 60 3 10 0 (0.0) 1 (1.6) 1 (1.6) Oct4-GFP OSK#8 60 3 3 0 (0.0) 3 (5.0) 3 (5.0) Oct4-GFP OSK#9 60 3 14 0 (0.0) 0 (0.0) 0 (0.0) Oct4-GFP OSK#10 60 3 28 0 (0.0) 0 (0.0) 0 (0.0) Total (Average) 60 3 11 0.9 (1.49) 3 (5.0) 2.9 (4.8) Oct4-GFP OSSNE#1 60 3 31 0 (0.0) 0 (0.0) 0 (0.0) Oct4-GFP OSSNE#2 60 3 4 0 (0.0) 2 (3.3) 2 (3.3) Oct4-GFP OSSNE#3 60 3 5 0 (0.0) 3 (5.0) 0 (0.0) Oct4-GFP OSSNE#4 60 3 23 0 (0.0) 0 (0.0) 0 (0.0) Oct4-GFP OSSNE#5 60 3 11 0 (0.0) 0 (0.0) 0 (0.0) Oct4-GFP OSSNE#6 60 3 27 0 (0.0) 0 (0.0) 0 (0.0) Total (Average) 60 3 13 0 (0.0) 0.8 (1.3) 0.3 (0.6) Nanog-GFP ESCs 60 3 9 1 (1.6) 3 (5.0) 3 (5.0) Oct4-GFP ESCs 60 3 20 0 (0.0) 7 (11.6) 5 (8.3) KH2 ESCs 60 3 21 1 (1.6) 6 (10.0) 5 (8.3) Total (Average) 60 3 13 0.6 (1.0) 5.3 (8.8) 4.3 (7.2)