HAL Id: hal-01630496
https://hal.archives-ouvertes.fr/hal-01630496
Submitted on 7 Nov 2017
HAL is a multi-disciplinary open access
archive for the deposit and dissemination of
sci-entific research documents, whether they are
pub-lished or not. The documents may come from
teaching and research institutions in France or
abroad, or from public or private research centers.
L’archive ouverte pluridisciplinaire HAL, est
destinée au dépôt et à la diffusion de documents
scientifiques de niveau recherche, publiés ou non,
émanant des établissements d’enseignement et de
recherche français ou étrangers, des laboratoires
publics ou privés.
An Energy Detector Based on Negative Energy
Fluctuations Coupled with Sub-band Decomposition as
a Robust Micro-embolus Detection System
Maroun Geryes, Sébastien Ménigot, Jamal Charara, Jean-Marc Girault
To cite this version:
Maroun Geryes, Sébastien Ménigot, Jamal Charara, Jean-Marc Girault. An Energy Detector Based on
Negative Energy Fluctuations Coupled with Sub-band Decomposition as a Robust Micro-embolus
De-tection System. IEEE International Ultrasonic Symposium 2017, Sep 2017, Washington, DC, United
States. �10.1109/ULTSYM.2017.8091688�. �hal-01630496�
An Energy Detector Based on Negative Energy
Fluctuations Coupled with Sub-band Decomposition
as a Robust Micro-embolus Detection System
Maroun Geryes¹, Sébastien Ménigot
2,3, Jamal Charara¹ and Jean-Marc Girault
2,31
Department of Physics and Electronics, Faculty of Sciences I, Lebanese University, Beirut, Lebanon
2
Université François-Rabelais de Tours, Inserm, Imagerie et Cerveau UMR U930, Tours, France
3
Université François-Rabelais de Tours, CNRS, CEA, INSA-CVL, GREMAN UMR7347, Tours, France
Abstract—Robust detection of the smallest circulating cerebral micro-emboli is an efficient way of preventing Cerebrovascular Accidents. Transcranial Doppler ultrasound is widely considered as the most convenient system for the detection of micro-emboli. Commercially realized standard detection is achieved through the whole Doppler energy spectrum where constant empirical thresholds are implemented. In this study, we propose a new type of micro-embolic detectors composed of N detectors associated to N Doppler frequency sub-bands. Moreover, we couple this sub-band decomposition with an original detection method. The N sub-band energy detectors are built from negative fluctuations of energy.
From a training phase, we find that 4 sub-band decomposition allows obtaining the best results considering both the detection rate and the false alarm rate.
The new sub-band detection coupled with energy detectors based from negative energy fluctuations allow increasing the detection rate up to 93% and the micro-embolus relative intensity increase from up to 23 dB. Moreover, the false alarm rate is reduced to around only 6%.
Keywords— transcranial Doppler ultrasound; micro-emboli; energy detector; sub-band decomposition; negative energy fluctuations.
I. INTRODUCTION
Emboli entering the cerebral circulation can have devastating consequences ranging from loss of brain functions to fatal Cerebrovascular Accidents (CVAs). CVAs are the second cause of mortality worldwide. Cerebral emboli are mostly gas bubbles, fat particles, or blood clots carried by blood flow. Previous studies have shown that emboli contribute up to 14% of Cerebrovascular Accidents [1].
Therefore, embolic CVAs are considered as a worldwide death issue. Various studies and researches have been proposed to find methods for the early diagnosis, treatment and avoidance of CVAs. The ideal objective of the latter research activities has been the sensitive detection of the smallest micro-emboli, precursors of subsequent coming large embolic signals accounting for a large burden of CVAs. To date, Transcranial Doppler (TCD) ultrasound has been one of the principle tools to detect spontaneous micro-embolic signals (MES) within the relevant cerebral arteries [2]. The common hindering drawback of the various previously proposed methods, is the detection of small
micro-emboli having amplitudes much lower than that of the blood Doppler signal. Commercially, current detection methods implemented in TCD systems, include searching for the transient micro-embolic events in a short-time Fourier transform (STFT) of the backscattered signal. Moreover these detection methods employ constant thresholds of detection. These thresholds, empirically set by the user over the entire examination, have never been robustly fit for the detection of small micro-emboli. Truly, in many cases, the clinician or the human expert detects, in an audible or visual manner, the transit passage of micro-emboli while the automatic constant threshold-based detector remains mute. From all the above, we state that the performance of automatic detectors have never been able to match that of the human system when evaluated for the detection of micro-emboli.
In this paper, we aim to detect low intensity micro-embolic signals in a robust manner. We propose an authentic approach based on the joint use of several separate hypotheses. The first hypothesis is based on the fact that reducing the frequency band in which detection is applied would provide better detectability of the micro-embolus signature in the background signal. This process can be achieved through sub-band decomposition which refers to decomposing the whole Doppler spectral band into several bands. Through this decomposition, we reduce the bandwidth in which detection is applied. This in turn allows reducing the background Red Blood Cells in the inspected bandwidth. Consequently, decomposing the whole Doppler frequency band will amplify the contrast between the micro-embolic signature and the background signal in each decomposed channel. This sub-band was proved as a tool for enhanced micro-embolus detection in a paper we already published [3]. However, as the Doppler energy signal is heterosckedastic [4], the sub-band decomposition is not sufficient to detect smaller microembolus. Therefore, the sub-band detection is coupled with another hypothesis which suggests using in each sub-band a time-varying threshold constructed and applied from negative energy fluctuations rather than standard constant thresholds of detection. This time varying threshold was introduced in [5].
In this study, we aim to prove our detectors’ high capability for micro-embolus detection and thus presents it as a serious candidate to initialize a complete methodological task for the early prevention of Cerebrovascular Accidents. This study also outperforms a recent study we have introduced, where we used
This work was supported by Region Centre Val de Loire (Project Brainmut, convention 2014 00091557).
high order statistics to detect micro-emboli [6]. In [5] we pointed out that the probability density function was even for Doppler signal free of embolic signature. This also means that the probability density function is no more symmetric when micro-emboli are present in the artery. Therefore in [6] we quantified the symmetry properties to improve the detection rate of micro-embolic signatures and we applied the detection on the whole band Doppler spectrum rather than in decomposed bands.
II. MATERIALS AND METHODS A. Micro-Embolic Energy Based Detection
To implement the micro-embolic detection, energy of the backscattered Doppler signal is used. Ultrasonic scattering from blood is mainly caused by the RBCs. The backscattered wave emanates from two main contributors; RBCs and traveling emboli when present. We can also refer to these contributors as ''Rayleigh scatterers'' as they are tiny reflectors whose size is much smaller than the wavelength of the ultrasound radiation [7]. By the Rayleigh Scattering theory we affirm that the energy of the backscattered Doppler signal is proportional to the size of the scatterer to the power of 6 [8]. While the embolus is always larger than RBCs or even aggregate RBCs, the backscattered energy would be the suitable indicator from which the presence of embolic and micro-embolic signatures could be detected.
We calculate the instantaneous energy from Short Time Fourier Transform (STFT). The STFT has been implemented by almost all approaches and commercial TCD systems to process the Doppler signal. STFT provides the time-frequency representation (spectrogram), from which visual detection is performed. The STFT in this study is performed using a 64 point Hamming window with an overlap of 65%. These parameters were chosen based on a preliminary experimental phase introduced in [9]. Moreover, calculations of the STFT are carried out repetitively on 10-second segments extracted from the Doppler signal.
The energy is calculated from STFT estimators by the following equation
,
)
(
*
)
(
)
(
t
y
w
t
e
2d
2df
E
j ft
(1) where y(t) is the analyzed Doppler signal and the calculation is carried out using a sliding window w(t), and * stands for complex conjugation.B. Sub-band Detection
In sub-band detection the spectral band is divided into several narrow sub-bands and the detection is operated independently in each sub-band document. Sub-band decomposition is then applied to decompose the STFT whole band into n ideal sub-bands through a bank of n ideal rectangular frequency filters. The decomposition through rectangular filters is defined by the following equation:
B kB f B rect f S /2 , (2)
where B is the bandwidth, k is the sub-band number, S(f) is the power spectrum, rectB(f) is the rectangular function.
The sub-band decomposition can be viewed in details in our previously published work on standard sub-band detection [3].
C. Threshold Choice
The choice of the threshold is a critically decisive step in the whole detection process, since detecting emboli relies on finding their signatures exceeding this threshold. In standard detection methods, constant thresholds are mainly implemented. The most popular threshold, is an empirical one that can be fixed empirically by the practitioner for the entire examination [3, 5, and 10].
At our end, we have recently come up with an innovative method to implement the detection threshold. We introduced an instantaneous time-varying threshold capable of detecting very small micro-embolic signatures. The idea is based on the fact that emboli appear only in the positive part of the energy signal fluctuations. After removing the low frequency component of the blood energy Doppler signal, energy fluctuations are obtained. At that point, we prove that the negative and positive energy fluctuations are symmetric except when High Intensity Transient Signals (HITS) are present. Next, the time-varying threshold is constructed from the negative energy fluctuations, and then applied on the positive fluctuations where detection takes place. Knowing that the Doppler signal is cyclostationary, the quasi-periodically time varying threshold
(t
)
is proposed as an envelope calculated from the Hilbert transform of the negative energy fluctuations:)
(
.
)
(
)
(
t
t
m
t
(3)where µ(t) is the "instantaneous" mean and σ(t) the "instantaneous" standard deviation. The empirical parameter m results from an optimization training process that increases the detection rate and reduces the false alarm rate.
Micro-emboli are counted as events exceeding the time-varying threshold. The detailed procedure and methods have been introduced in [5].
D. Coupling of Sub-band Detection with the use of Time-Varying Threshold
The novel approach introduced is to combine the sub-band decomposition with the use of the time-varying threshold. The latter threshold is applied in each sub-band to detect and count the micro-emboli in each sub-band. In this stage and before counting the final detections, merging of the detections in each sub-band is achieved. An important point here is to accompany the merging with a test that continuously verifies that the micro-embolic signature detected in sub-band n is not detected in the same time interval in all other sub-bands. In other terms, the latter test assures that the same embolus detected in more than one sub-band is counted only once in the final detection [9]. The time interval we apply ranges ±0.025s around the detected micro-embolus peak. This is because the positions of micro-emboli detected in different
sub-bands are not always exactly the same and may slightly vary from one sub-band to another. After an experimental procedure we applied on same emboli detected in more than one sub-band the maximum difference in sub-band positions is 0.025 seconds [9].
III. HOLTERMONITORINGANDDATACOLLECTION The Transcranial Holter is an advanced generation of the conventional Transcranial Doppler system. It has been implemented by Atys Medical (Soucieu en Jarrest, France) to offer improved options and characteristics such as the use of a robot probe that helps find the best TCD signal and tracks it automatically during the whole recording. The Holter system is shown in Fig.1. The Holter recordings were carried out at the hospital of Lille (Centre Hospitalier Régional Universitaire de Lille, 2 Avenue Oscar Lambret, 59000 Lille, France). Patients with carotid stenosis were chosen for monitoring. The Doppler were recorded in a non-interventional practice and analyzed without interference with patient care. The Holter transducer emits an ultrasound wave with a 1.5 MHz frequency to the middle cerebral artery of the patients. A pulse repetition frequency (PRF) of 6.4 kHz is used with an ultrasound power of 50 2
/cm
mW . After the clinical exam, the Holter recordings are converted into audio-wave files (quantification over 16 bits and sampling frequency of 4 kHz). In the following post-treatment phase, the audio files are analyzed and manipulated with our developed algorithms in the numerical calculation software Matlab® (Mathworks, Natick, Massachusetts, United States of America).
IV. RESULTS
Our dataset is composed of 17 signals. 8 out of these 17 signals were excluded and used in a purpose to determine the optimal number of sub-bands. This phase is referred to as training phase. The other 9 signals were used in a testing phase were the different detectors' are evaluated.
The detection rate and the false alarm rate are used to compare the different implemented detectors and are defined as follows:
Detection Rate (DR): refers to detecting an embolus which is recorded in the gold standard.
False Alarm Rate (FAR) = Number of False Alarms (NFA) / total Number of Detections (ND). NFA is the instance of detecting an embolus where in reality no embolus crossed. ND is the total number of detections.
Fig. 1: Holter Transcranial Doppler System, TCD-X, Atys Medical, Soucieu en Jarrest, France (http://www.atysmedical.com/en/pages/products/tcd-xtranscranialholter.php)
Another comparison tool that has been used to assess our detectors’ results is the embolus Relative Intensity Increase (RII), a widely used parameter in embolic signal detection [10]. It indicates how strong an embolic signal is, relative to the background Doppler signal. It is calculated as the ratio of the energy backscattered from the embolus to that of the moving blood surrounding it
.
A. Training Phase
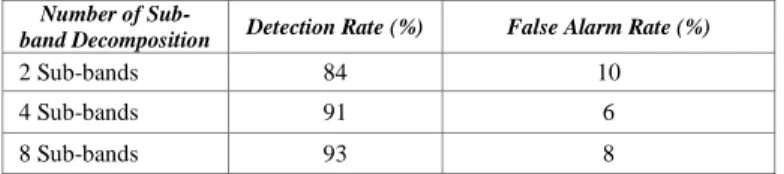
In the training phase we use the first category of our dataset (8 signals) to determine the most suitable number of sub-bands to be used for the sub-band detector coupled with the time-varying threshold. The objective is to find the best trade-off between the total number of channels and the detection rate as well as the false alarm rate obtained. 2, 4 and 8 sub-bands are tested. The results are shown in Table I.
Through Table I, we deduce that the best detection procedure is obtained for number of sub-bands
N
sb
4
. Compared to 2 sub-bands, 4 sub-bands allows a better detection rate and a lower FAR. Compared to 8 sub-bands, 4 sub-bands allows a close detection rate with a much lower FAR.The training phase for the sub-band method with constant thresholds used is demonstrated in [3]. The best detection procedure was also obtained for number of sub-bands
4
sb
N
. B. Testing PhaseIn this phase we use the second category of our dataset (9 signals) to determine the results of the 4 sub-band detectors with time-varying threshold. The results of the 4 sub-band detectors with constant threshold are derived from [3] while those for the whole band detector with time varying threshold built from negative energy fluctuations are derived from the same methods presented in [9]. We compare the performance of each of the 3 detectors. The results are presented in Table II.
TABLE I. RESULTS (DETECTION RATE AND FAR) FOR 2,4 AND 8 SUB
The results show several improvements for the new detector using sub-bands coupled with time-varying threshold. Improvements include a very high detection rate reaching up to 93% while that achieved by standard sub-band methods is 79% and that achieved by whole band detector with time-varying threshold is 87%. In addition, the false alarm rate is reduced from around 37% for standard sub-band methods and 15% for whole band detectors to around 6%. Furthermore, the relative intensity increase is increased from 15 dB and 18 dB for standard sub-band and whole band detectors respectively to 23 dB.
V. DISCUSSION AND CONCLUSION
Improving the performance of a micro-embolus detection system is assumed to be majorly evaluated through the detection rate achieved, the false alarm rate and the embolus relative intensity increase. Sub-band decomposition is a relatively strong tool to improve micro-embolus detection. In a number of cases in which the energy relative intensity increase associated with the micro-embolic signal cannot be clearly distinguished from the background energy by whole band detection, it can be distinguished through sub-band filtering. Moreover, by coupling sub-band detection with a time-varying threshold constructed from negative energy fluctuations we previously introduced [5], rather than using a constant threshold, an extremely high performing detection system is obtained. This coupling is able to detect nearly all micro-emboli that may occur during the cardiac cycle.
When tested offline on a set of real signals, sub-band coupled with a time-varying threshold offers significant improvements. Consequently, we confirm that a detection based on the coupling of sub-band with a time-varying threshold constructed from negative energy fluctuations, would be very reliable, robust and adequately suitable for the accurate detection of the smallest micro-emboli.
In its current form, the detection algorithm could already be used as a critical step for reliable automatic embolus detection. The detection of embolus is a very difficult problem, and the algorithm presented here gives a refined and robust solution. Additionally, with its high detection rates, the low false alarm rates and the ability in detecting emboli with low relative intensity increase, the algorithm is destined to boost the prevention of strokes, enhance patient safety and treatment, and help provide reliable embolus clinical reports. On another hand, although the method seems to be implementable online, it is not the goal of this study. Therefore, the main next step of the overall process is to implement such detector in a commercial TCD system and develop automatic artefact rejection techniques.
TABLE II. COMPARISON OF THE DETECTION RATE,FAR, AND RII
RESULTS FOR SUB-BAND DETECTORS WITH CONSTANT THRESHOLD,WHOLE BAND DETECTOR WITH TIME-VARYING THRESHOLD AND SUB-BAND
DETECTORS WITH TIME-VARYING THRESHOLDS
REFERENCES
[1] B. Murtagh and R. W. Smalling, “Cardioembolic stroke,” Current atherosclerosis reports, vol. 8, no. 4, pp. 310–316, 2006.
[2] I. S. Jacobs V. Vukovi´c-Cvetkovi´c, “Microembolus detection by transcranial Doppler sonography: review of the literature,” Stroke research
and treatment, vol. 2012, 2011.
[3] M. Geryes, S. Ménigot, W. Hassan, A. Mcheick, M. Almar, B. Guibert, C. Gautier, J. Charara, and J.-M. Girault, “A micro-embolic energy detector based on sub-band decomposition,” in 2016 3rd Middle East Conference on Biomedical Engineering (MECBME), IEEE, 2016, pp.54-58
[4] Girault, J.-M., Ménigot, S., and Deibine, L. (2010). Automatic detection of micro-emboli by means of a generalized autoregressive conditional heteroskedasticity model. The Journal of the Acoustical Society of America, 128(4):2304–2304.
[5] M. Geryes, S. Ménigot, W. Hassan, M. Almar, B. Guibert, C. Gautier, J. Charara, and J.-M. Girault, “A new energy detector of micro-emboli using a time-varying threshold,” in 2015 International Conference on Advances in Biomedical Engineering (ICABME). IEEE, 2015, pp. 89–92.
[6] M. Geryes, S. Ménigot, W. Hassan, A. Mcheick, J. Charara, and J.-M. Girault, “Detection of doppler microembolic signals using high order statistics,” Computational and Mathematical Methods in Medicine, vol. 2016, 2016.
[7] P. M. Morse and K. U. Ingard, Theoretical acoustics. Princeton university press, 1968.
[8] M. A. Moehring and J. R. Klepper, “Pulse doppler ultrasound detection, characterization and size estimation of emboli in flowing blood,” IEEE Transactions on Biomedical Engineering, vol. 41, no. 1, pp. 35–44, 1994. [9] M. Geryes, “Development of signal processing algorithms for the detection of micro-emboli using a new tcd system,” Ph.D. dissertation, 2016. [10] E. B. Ringelstein, D. W. Droste, V. L. Babikian, D. H. Evans, D. G. Grosset, M. Kaps, H. S. Markus, D. Russell, M. Siebler et al., “Consensus on microembolus detection by tcd,” Stroke, vol. 29, no. 3, pp. 725–729, 1998.
Number of
Sub-band Decomposition Detection Rate (%) False Alarm Rate (%)
2 Sub-bands 84 10 4 Sub-bands 91 6 8 Sub-bands 93 8 Number of Sub-band Decomposition Detection Rate (%) FAR (%) Relative Intensity Increase (dB)
4 Sub-band detector with
constant threshold 79 37 15
Whole band detector with
time-varying threshold 87 15 18
4 Sub-band detector with