HAL Id: hal-00814717
https://hal-iogs.archives-ouvertes.fr/hal-00814717
Submitted on 26 May 2021
HAL is a multi-disciplinary open access archive for the deposit and dissemination of sci-entific research documents, whether they are pub-lished or not. The documents may come from teaching and research institutions in France or abroad, or from public or private research centers.
L’archive ouverte pluridisciplinaire HAL, est destinée au dépôt et à la diffusion de documents scientifiques de niveau recherche, publiés ou non, émanant des établissements d’enseignement et de recherche français ou étrangers, des laboratoires publics ou privés.
Distributed under a Creative Commons Attribution| 4.0 International License
of hybridization and melting on standard format
microarrays
Yann Marcy, Pierre-Yves Cousin, Maxime Rattier, Gordana Cerovic, Guilhem
Escalier, Gilles Bena, Maurice Guéron, Lorcan Mcdonagh, Françoise Le
Boulaire, Henri Benisty, et al.
To cite this version:
Yann Marcy, Pierre-Yves Cousin, Maxime Rattier, Gordana Cerovic, Guilhem Escalier, et al.. Inno-vative integrated system for real-time measurement of hybridization and melting on standard format microarrays. Biotechniques, Eaton Publishing, 2008, 44, pp.913-920. �10.2144/000112758�. �hal-00814717�
INTRODUCTION
DNA microarray technology, with its ability to simultaneously detect and measure thousands of distinct DNA sequences immobilized on a small surface area, has been widely recognized as a valuable tool for high-throughput, quantitative, systematic, and detailed studies for a wide panel of applications (1,2). So far, this technology relies on end point measurement of hybridization events. This is a serious limitation in terms of both performance and cost. The ability to monitor these hybrid-ization events simultaneously in real time and under adjustable temperature would lead to two major improve-ments. First, it would give access to the measurement of the thermody-namic and kinetic parameters [e.g., the melting temperature (Tm)] that control
the hybridization of surface-bound probes. It is indeed commonly reported that there is no reliable predictor of on-chip hybridization efficiency, because solution-based hybridization predic-tions are not relevant for solid-phase hybridizations (3,4). Therefore, design and optimization of DNA microarrays remain a chief obstacle, and their reliability with regard to sensitivity and specificity constitutes a major challenge for users to transform them into robust tools (5). Second, real-time monitoring of hybridization would enable a quick and cost-effective optimization of experimental conditions by offering the possibility to test several hybridization temperatures and buffer compositions within a single experiment.
Although other groups have reported real-time hybridization and thermal denaturation measurements (6–14), a
complete stand-alone system compatible with standard microarray slides is still lacking. We have addressed this problem by developing an innovative biochip tool that integrates a real-time fluorescence reader to a hybridization/ washing station equipped with highly efficient mixing and precise temperature controls. This integrated live hybrid-ization machine (LHM), which will soon be commercially available, allows real-time measurement of the hybrid-ization and melting of target DNA to thousands of probes simultaneously.
Here we describe the performance of the LHM with a set of oligonucle-otide probes aimed at discriminating polymorphisms in the symbiotic sister species Sinorhizobium meliloti and
Sinorhizobium medicae. Our results show that the LHM provides excellent levels of detection and superior
Innovative integrated system for real-time
measurement of hybridization and melting on
standard format microarrays
Yann Marcy
1, Pierre-Yves Cousin
1, Maxime Rattier
1, Gordana Cerovic
1, Guilhem Escalier
1,
Gilles Béna
2, Maurice Guéron
1, Lorcan McDonagh
1, Françoise le Boulaire
1, Henri Bénisty
3,
Claude Weisbuch
4, and Jean-Christophe Avarre
1BioTechniques 44:913-920 (June 2008)
doi 10.2144/000112758
Despite the great popularity and potential of microarrays, their use for research and clinical applications is still hampered by lengthy and costly design and optimization processes, mainly because the technology relies on the end point measurement of hy-bridization. Thus, the ability to monitor many hybridization events on a standard microarray slide in real time would greatly expand the use and benefit of this technology, as it would give access to better prediction of probe performance and improved optimiza-tion of hybridizaoptimiza-tion parameters. Although real-time hybridizaoptimiza-tion and thermal denaturaoptimiza-tion measurements have been reported, a complete walk-away system compatible with the standard format of microarrays is still unavailable. To address this issue, we have designed a biochip tool that combines a hybridization station with active mixing capability and temperature control together with a fluorescence reader in a single compact benchtop instrument. This integrated live hybridization machine (LHM) allows measuring in real time the hybridization of target DNA to thousands of probes simultaneously and provides excellent levels of detection and superior sequence discrimination. Here we show on an environmental single nucleotide polymorphism (SNP) model system that the LHM enables a variety of experiments unachievable with conventional biochip tools.
1Genewave, Ecole Polytechnique Campus, Palaiseau, 2Laboratoire des Symbioses Tropicale et Méditerranéennes,
Campus International de Baillarguet, Montpellier, 3Institut d’Optique Graduate School, Ecole Polytechnique Campus,
Palaiseau, and 4Laboratoire de Physique de la Matière Condensée, Centre National de la Recherche Scientifique
sequence discrimination and illustrates the promising potential and capabilities of the LHM to improve microarray technology.
MATERIALS AND METHODS Instrument
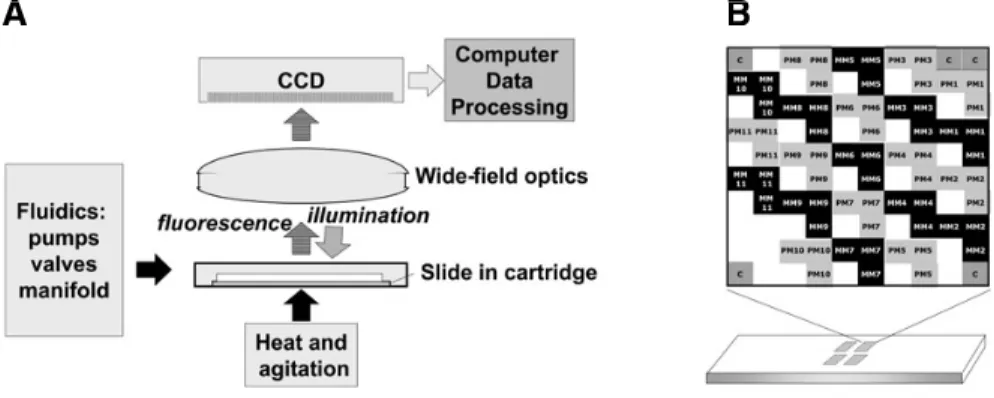
The LHM was designed to (i) meet the major requirements of a standard hybridization station for laboratory use (i.e., compactness, robustness, multiwash options, easy handling of waste, friendly software) and (ii) increase the benefits of real-time measurement through highly efficient mixing and adjustable temperature. The LHM is presented schematically in Figure 1A and is described in more details below.
Fluidics
The DNA-printed slide forms the bottom compartment of a chamber (volume of ∼70 μL) with walls formed by a gasket and a cover made from a milled polymeric slide, which includes an optical quality window and two channels for circulation of fluids. The three components are fitted into a holder. After manual injection of the hybrid-ization solution, the cartridge is placed in the machine such that the bottom of the slide is positioned in direct contact with the mixing module. Once in the apparatus, the cartridge cover abuts and connects to the fluidic circuitry atop. Up to four different solutions can be selected by a manifold and pumped through the cartridge for various washing steps.
Optics
Wide-field optics generates an image of the full chip area (15.4 × 10.2 mm) onto a charge-coupled device (CCD) with a resolution of 10 μm. For the present study, the optics were optimized for fluorescence around 670–690 nm (typically Cy5) upon excitation at 635 nm. Images were acquired during the various steps of the process at 1 frame/ min except for the melting measurement, in which case the rate was 3 frames/min.
The exposure time varied from 1 to 15 s, depending on the experiment.
Active Mixing
The bottom of the slides is in contact through a coupling liquid (AdvaSon; Advalytix, Olympus Life Science Research Europa GmbH, Munich, Germany) with a custom-made surface
acoustic wave generator (Advalytix). The acoustic waves create chaotic convective streams in the chamber, thus providing thorough agitation.
Thermal Control
The cartridge temperature can be adjusted to values ranging from 25° to 70°C using a proportional integral
Figure 1. Representation of the (A) live hybridization machine (LHM) and (B) spotting design on one block among four identical ones.
Table 1. Oligonucleotide Sequences and Characteristics Probe
Name Sequence Length (nt) GC (%%) (T°°C)ma NameTarget b
PM1 5′-GCTCGCCTGAAGGTAGCCG-3′ 19 68.4 75.7 cPM1 MM1 5′-GCTCGCCTGAGGGTAGCCG-3′ 19 73.7 77.9 PM2 5′-GCTTGGGTCTGTTCACACTAATCC-3′ 24 50.0 74.3 cPM2 MM2 5′-GCTTGGGTCTGCTCACACTAATCC-3′ 24 54.2 76.6 PM3 5′-TTGGGTCTGTTCACACTAATCC-3′ 22 45.5 69.3 cPM3 MM3 5′-TTGGGTCTGCTCACACTAATCC-3′ 22 50.0 71.8 PM4 5′-TGCTCACACTAATCCTCCCACCA-3′ 23 52.2 76.7 cPM4 MM4 5′-TGCTCACACTAGTCCTCCCACCA-3′ 23 56.5 76.8 PM5 5′-GGACCGAAATCCGCTGAAGG-3′ 20 60.0 76.6 cPM5 MM5 5′-GGACCAAAATCCGCTGAAGG-3′ 20 55.0 74.4 PM6 5′-CAGCGCGGACTATAATGAAGG-3′ 21 52.4 72.7 cPM6 MM6 5′-CCAGCGCGG-CTATAATGAAGG-3′ 21 57.1 77.1 PM7 5′-GCTGGACAGGATCCGGTAGA-3′ 20 60.0 72.3 cPM7 MM7 5′-GCTGGACAGGGTCCGGTAGA-3′ 20 65.0 74.7 PM8 5′-CCAAGATCCTCGGGACCCTAGT-3′ 22 59.1 75.8 cPM8 MM8 5′-CAAGACCCTCGGGACCCTAGT-3′ 21 61.9 74.4 PM9 5′-ATTCCTGCTATGCGGGTATCC-3′ 21 52.4 73.2 cPM9 MM9 5′-ATTCCTGCTCTGCGGGTATCC-3′ 21 57.1 75.4 PM10 5′-CTCCTGCGACCCATCCAATAC-3′ 21 57.1 74.3 cPM10 MM10 5′-CTCCTGCGATCCATCCAATAC-3′ 21 52.4 72.0 PM11 5′-ACGGTTCGTAATCAATATCGAGG-3′ 23 43.5 72.7 cPM11 MM11 5′-ACGGTTCGTAACCAATATCGAGG-3′ 23 47.8 74.7 aMelting temperature (T
m) provided by Operon Biotechnologies GmbH. bc stands for complementary.
Sequence mutations are bolded and underlined. nt, nucleotides; PM, perfect matched; MM, mismatched.
A
differential (PID) control. For melting curve measurements, a ramp of 2°C/min is applied.
Software
The LHM components for image acquisition, fluidics, agitation, and temperature are controlled by dedicated software written in LabVIEW (Austin TX, USA). Once the hybridization solution is manually introduced into the cartridge and the cartridge is placed in the machine, the process is fully automated for a walk-away experiment including hybridization, washing steps, and melting curve determination.
Experimental Model
To illustrate the performance of the system, we focused on single
nucle-otide polymorphism (SNP) detection using a previously investigated environ-mental model. This model consists of three polymorphic chromosomal and plasmidic loci of the two symbiotic bacteria S. meliloti and S. medicae, for which many sequences have been obtained. The oligonucleotide probes were the same as described by Bailly et al. (15). They were designed to cover most of the polymorphisms that were found on the three loci in natural populations of the two sister species
S. meliloti and S. medicae. Of the 30 oligonucleotides previously designed, only the pairs differing by one single nucleotide were used in the present study (see Table 1) (i.e., 22 oligonucle-otides). Their length varied from 19 to 24 bases, and they were synthesized without any modification. Control oligonucleotides consisted of 50-mers
designed from the mouse gaba gene labeled with a Cy5 dye at their 3′ extremity and harboring a C6-NH2 modification at their 5′ extremity (see Table 1). All the oligonucleotides were synthesized by Operon Biotechnologies GmbH (Cologne, Germany).
Microarray Preparation
The slides used in this study were reflective slides (AmpliSlides; Genewave, Palaiseau, France) designed for optimal photon collection, providing a signal-to-noise enhancement by a factor of 4 to 5 (16). These slides are coated with an epoxysilane layer for covalent attachment. Probes were resus-pended in a spotting buffer (Genewave) at 20 μM and spotted with a split needle (150 μm diameter) under 60% humidity with a MicroGrid II spotter (BioRobotics, Cambridge, UK). For control purposes, probes were spotted in triplicate on four identical blocks in the center of the microarray (see Figure 1B). Positive controls were also spotted in five replicates on each block. Slides were then mounted in cartridges as described in the Fluidics section.
Target Preparation
For LHM validation, we used oligo-nucleotide-oligonucleotide hybridiza-tions. The targets consisted of the 11 reverse complement sequences of the so-called perfect matched (PM) oligo-nucleotides of each probe pair (Table 1) with a Cy5 label at their 5′ terminus. For hybridization of PCR products, each locus was first amplified as described in Bailly et al. (15), then purified with the QIAquick PCR Purification kit (Qiagen, Valencia, CA, USA) and quantified with the NanoDrop 1000 spectrophotometer (NanoDrop Technologies, Wilmington, DE, USA). For labeling purposes, a second amplification was carried out on 5 ng each product, using one oligo-nucleotide probe as the forward primer and one Cy5-labeled oligonucleotide target as the reverse primer. PCR condi-tions were the same as those of the first amplification round, and the program consisted of a standard touchdown reaction composed of 20 cycles, with an annealing temperature decreasing from 60° to 50°C, followed by 25 cycles with
Figure 2. Real-time monitoring of oligonucleotide-oligonucleotide hybridization. (A–D) False color
(see color bar) images recorded (A) before hybridization, (B) after 1 min, (C) after 30 min, and (D) after washing. (E) Background-subtracted fluorescence (F-B) for all probes. Each trace corresponds to the median over all replicas. Spotting control probes can be visualized on panel A. The color scheme is the same for the four images. fu, fluorescence units.
Figure 3. Detection threshold of probe PM8 hybridized with its matching oligonucleotide and PCR product. Decreasing concentrations of target were hybridized for 30 min, and the signal-to-noise ratio
±sd from the last picture after the second wash was calculated. The image acquisition time was 15 s.
A
B
C
D
E
A
annealing at 50°C. PCR products were subsequently purified with the QIAquick PCR Purification kit and eluted in sterile distilled water. DNA was quantified with the NanoDrop 1000 spectrophotometer and kept frozen until use.
Hybridizations
Slides were prehybridized for 5 min at 42°C in a buffer containing 25% formamide, 2.5× saline sodium citrate (SSC; 375 mM NaCl, 37.5 mM Na citrate), 0.5% sodium dodecyl sulfate (SDS), and 1× Denhardt’s solution, and supplemented with 200 μg/mL denatured salmon sperm DNA (Invitrogen, Carlsbad, CA, USA) for PCR products. Unless otherwise specified, target oligonucleotides were resuspended at a concentration of 1 nM in a hybridization buffer containing 25% formamide, 2.5× SSC, 0.5% SDS, and 1× Denhardt’s solution. For PCR products, 1 to 25 ng of each product were resuspended in the same hybrid-ization buffer and denatured at 95°C for 5 min. Hybridizations were carried out for 30 min (oligonucleotides) to
1 h (PCR products) at 42°C and were followed by two washes of 3 min each at 42°C with 0.5× SSC, 0.5% SDS, and 0.2× SSC, 0.5% SDS, respectively. All these steps were carried out in the LHM, and the fluorescence images were recorded at the same time.
Data Analysis
Hybridizations were followed on-screen as a visual control, and the results were analyzed after completion of the experiment. For accurate segmen-tation and due to the high number of images (typically over a hundred per experiment), a new software tool was developed to automatically perform measurements on all the recorded images. A fixed segmentation based on the image obtained after washing was used for all images. In most cases, the spot quantity used for analysis was the background-subtracted median fluorescence (F-B). The background is the fluorescence measured in a circular area surrounding the segmented spot. The probe quantities used here were the median (F-B) across all the replicas.
Hybridization signals were considered significant only if the median signal-to-noise ratio [SNR; defined as (F-B)/ stdv(B)] was ≥3.
Melting Curve Measurement
After completion of the hybrid-ization and washing steps, the micro-arrays were rinsed with 2.5× SSC, and a temperature ramp was applied with active mixing still on. Images were acquired at 3 frames/min, corresponding to one measurement per 0.6°C increase. The images were analyzed as described in the previous section. To compensate for the temperature variation of the quantum efficiency of Cy5 (17), we normalized the data according to the spotted labeled oligonucleotide controls. For comparison purposes, we also referenced each probe signal to its value at the beginning of the ramp (see Equation 1).
�
[Eq. 1] where Σi is the normalized F-B for the probe i, Si is the F-B value for the probe i, G is the F-B value for the reference oligonucleotide, T is the temperature, TT is the temperature, and TTT00 is the starting temperature (i.e.,
the hybridization temperature). Each species’ behavior was then fitted based on Equation 2 using the two usual thermodynamic parameters ΔHΔHΔ and HH and ΔS.
�
[Eq. 2] where ΔG = ΔG = Δ ΔH – TΔH – TΔH – TH – T SΔΔΔSΔ .
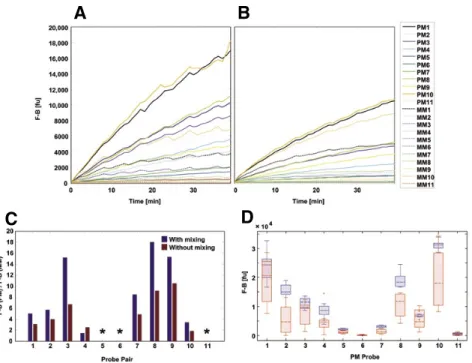
Figure 4. Effect of mixing on hybridization kinetics and discrimination ratios. (A–B) Median across
the replicas of the background-subtracted fluorescence (F-B) (A) with and (B) without agitation for the 11 cPM targets. (C) Ratio of perfect matched (PM) probe signal to mismatched (MM) probe signal for the cPM targets with and without agitation. The ratio was not considered when the signal-to-noise ratio (SNR) for the PM probe was <3 (*). (D) Boxplot of the replica statistics with (blue) and without (red) agitation. The box has lines at the lower quartile, median, and upper quartile values. The whiskers are lines extending from each end of the box to show the extent of the rest of the data. Outliers (+) are data with values beyond the ends of the whiskers. fu, fluorescence units.
A
B
RESULTS
Real-time Monitoring of Hybridization
The performance of the 22 oligo-nucleotide probes used in this study had already been assessed by hybridizing PCR products radioactively labeled with
32P (15). The first step in the present
study consisted in testing the behavior of each probe in our system by hybridizing each Cy5-labeled reverse complement oligonucleotide target individually. These individual hybridizations were followed by hybridizations of an equimolar mixture of the 11 targets (1 nM each). Hybridizations were carried out for 30 min at 42°C, as described in the Materials and Methods section, and an image was recorded every minute, with an acquisition time of 2 s. The probes could thus be simultaneously monitored during the whole procedure, as illustrated in Figure 2. The complete movie of the hybridization is available online as Supplementary Movie S1 at www.BioTechniques.com. For most probes, maximum hybridization yields,
expressed as signal F-B, were reached between 10 and 20 min. Although the background due to fluorescence of the solution was relatively high during hybridization (∼6000 fluorescence units), the signals of all probes could be clearly visualized due to the distinct differential amplification occurring at the surface of the AmpliSlides (16). Subsequently, typical washing steps were applied to the microarray. As expected, the washes reduced the background to nearly its initial level, indicating that all the nonhybridized labeled targets were flushed away, which resulted in an increase of the F-B value. Measurement of the F signal revealed that the first wash removed most of the nonspecific binding, while the second, more stringent, had a weaker effect (data not shown). It also showed that the flush is instantaneous. Altogether, this hybridization exper-iment lasted <40 min.
Sensitivity of the System
We assessed sensitivity by hybrid-izing the microarrays with decreasing
concentrations of targets and plotting the SNR according to the target concen-tration. Detection thresholds were deter-mined for oligonucleotides that yielded the highest hybridization signals (i.e., targets cPM8 and cPM10) and for the PCR product target that matched the oligonucleotide PM8. As mentioned in the Materials and Methods section, only signals with SNR ≥3 were considered. For oligonucleotides, the lowest concentration detected after 30 min was 1 pM for target 8 (Figure 3A) and 500 fM for target 10 (SNR = 3, not shown). The detection threshold was slightly higher for PCR products, as the lowest concentration detected after 30 min was 20 pg, equivalent to 3 pM of a 287-bp single-strand DNA (Figure 3B).
Effect of Mixing
The ability of the LHM to accurately discriminate SNPs, thanks to its mixing module, was first assessed with the PCR product specific to probe PM8 at a concentration of 150 pM, corre-sponding to approximately 1 ng of a single-strand 287-nucleotide PCR product. Mixing accelerated hybrid-ization and increased the perfect match/ mismatch (PM/MM) F-B ratio from 12 to 48.5 (data not shown). In a second experiment, an equimolar mixture of all the oligonucleotide targets at 100 pM each (in order to avoid saturation) was hybridized to the arrays in the presence or in the absence of mixing (Figure 4, A and B). As for PCR products, mixing clearly accelerated hybridization. It also improved sequence discrimination: the PM/MM F-B ratio increased from 5.3 to 9.1 on average without and with mixing, respectively (Figure 4C). The mixing also enhanced the hybridization yields by a factor of 1.8 on average for PM probes. Moreover, the homogeneity across replicates was improved, as the replica distribution for PM probes was broader without mixing (Figure 4D).
On-chip Melting Curve Determination
To measure the melting profile of each target with its PM and MM probe, we hybridized an equimolar mixture of the 11 oligonucleotide targets (1 nM
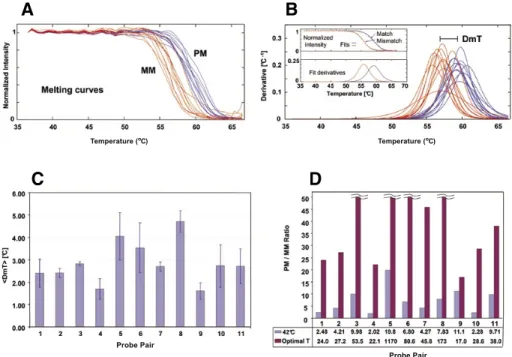
Figure 5. Melting curve measurement, melting temperature (Tm) determination, and effect of
temperature on sequence discrimination. (A) Normalized melting profile for the 22 probes
hybrid-ized to their oligonucleotide targets. The perfect matched (PM) probes are in blue, and the mismatched (MM) probes are in red. (B) First derivative of the fit. Inset: typical fitting of a probe couple. Measured data points are represented by a star, and the corresponding fit are represented as a solid line. (C) Tm difference between PM and MM probe (DmT). The error bars represent the standard deviations over three independent experiments. (D) Improved sequence discrimination at increasing temperatures after hybridization at 42°C. The PM/MM ratio is given for each probe set at the optimal temperature.
Temperature (oC) Temperature (oC)
Probe Pair
Probe Pair
A
B
each) onto AmpliSlides spotted with the 22 oligonucleotides, corresponding to the PM and MM probes. After a 30-min hybridization followed by the two usual washes at 42°C, the slides were rinsed for 5 min at 42°C with 2.5× SSC, and the temperature was raised to 70°C. Signals on each spot were quantified for every image and plotted against temperature. Melting profiles were simultaneously determined for the 11 pairs of homoduplexes and for the 11 pairs of heteroduplexes (Figure 5A). The Tm of each oligonucleotide duplex
was calculated from these melting curves, and the Tm difference for each
oligonucleotide pair is displayed in Figure 5C. In all cases, Tm of the PM
duplex was higher than that of its MM counterpart, with Tmmm differences ranging differences ranging
from 1.5°C to almost 5°C. To assess the reproducibility of these measurements, the same experiment was repeated three times independently using the same conditions. Standard errors on Tm were
0.75°C on average between the three experiments. Comparable analyses were also successfully carried out on PCR products with 25 ng material (data not shown).
DISCUSSION
Optimization of hybridization conditions and better prediction of probe performances, in terms of sensi-tivity, specificity, and reliability, are the two most challenging issues for the further improvement and expansion of microarray technology (18). The devel-opment of a live hybridization machine allowed us to address these two issues.
Real-time monitoring of DNA capture by probes provides for fast and easy optimization of microarray experi-ments. The first step is to determine the minimal duration required for the desired hybridization level. In the present case, we found that 30–60 min of hybridization, depending on the kind of target (oligonucleotide or PCR product), provided high but nonsaturating signal intensities. The second step is to optimize the condi-tions for hybridization and washing. In our previous study, using the same set of probes, this had required a dozen of distinct hybridizations, each one
addressing a single parameter at a time: hybridization temperature, compo-sition of hybridization buffer, washing stringency, and temperature—with each hybridization being carried out overnight (15). In the present study, the LHM enabled us to test the influence of several of these parameters on hybrid-ization yield and specificity within one single experiment. Thus, the use of the LHM reduces time and cost for microarray optimization, so that several weeks of experimental setup can be reduced to several days or even several hours.
High sensitivity and specificity are critical for most microarray applica-tions. Even though various detection techniques based on electrochem-istry, surface plasmon resonance, ellipsometry, microcantilevers, or magnetic beads have been imple-mented as biosensors in the microarray format, fluorescence is by far the most commonly used technique. While recent developments of these alter-native biosensors have driven detection limits into the low picomolar range (19,20) and even into the femtomolar range (21), the best detection level of fluorescence-based microarrays is in the range of 5 pM with 25-mer probes (for illustration, see www.affymetrix. com/support/technical/whitepapers/ hugene_perf_whitepaper.pdf) and 2 pM with 50-mer oligonucleotides (22). Our results show that we can routinely obtain comparable sensitivity (Figure 3) with shorter oligonucleotide probes (Table 1). Factors that influence sensi-tivity are discussed in more detail in the Supplementary Material.
Microarrays were initially developed for genome-wide expression analysis and are now routinely used for this purpose. They are, however, increas-ingly emerging as tools for microbial community analysis and diagnostic purposes (23–26). This requires high specificity and reproducibility in view of species-level and even subspecies-level resolution in the case of microbial analysis, down to the single polymor-phism critical for clinical applications (27). Whereas many microarray-based enzyme-mediated procedures have been developed to this effect (reviewed in Reference 27), the LHM technology offers a new alternative approach. First
of all, discrimination is enhanced by efficient agitation of the hybridization reaction, as the convective stream helps recycle the weakly bound probes that explore the full energy landscape to find the minimal energy corresponding to the PM probe. Moreover, for mismatches that are difficult to resolve, discrimination can be enhanced by exploring different temperatures within a single hybridization experiment. For instance, the PM/MM ratios obtained during a melting procedure are much larger than during hybridization at 42°C (Figure 5D). As expected, the optimal temperature for best resolution is not the same for the different probes. This example illustrates the value of the LHM for providing the finest resolution required for crucial applications such as reliable diagnostics.
It is commonly admitted that DNA hybridization efficiencies strongly depend on the Tm. In spite of the wide
variety of methods to calculate the Tm
of short oligonucleotide sequences in solution, prediction of this parameter for DNA molecules tethered to solid substrates is still challenging. Thus, there is presently no reliable predictor of on-chip hybridization efficiency (3,4,28,29). The LHM circumvents this constraint by providing simultaneous measurement of the melting profile of all the probes present on an array within a single run (Figure 5A) and does so accurately across multiple experiments (Figure 5C). Our melting analysis produced reproducible dissociation curves. It was fully automated and was completed in <60 min for oligo-nucleotides or 90 min for PCR products [instead of >20 h, Wick et al. (14)].
Many factors influence the stability of DNA-DNA duplexes, among which are target length, sequence, double- versus single-stranded composition, position of fluorescent label, and formation of secondary structures (30). Although the study of the kinetic parameters is beyond the scope of this work, our results already demonstrate the value of the LHM for such kinetic analysis. Among tools available for such studies (6–8,11,13,14; www. auroraphotonics.com), the LHM system is, to our knowledge, the only one that is fully integrated and compatible with standard printed microarray slides.
As of today, the LHM has some extrinsic technological limitations. In particular, because of optical constraints mainly set by detector size and imaging system cost and size, the area of the slide surface that can be investigated is limited to approximately 1 cm2. We are presently developing
solutions to at least double the effective slide surface area, resulting in spot numbers compatible with most foreseen multiplex applications. Another issue is the strong fluorescence of the fluoro-phores in the hybridization solution, which increases 10-fold the threshold of spot detection before washing. To solve this problem, new concepts that increase bound fluorophore signals at the expense of the optical background signal of the solution are under devel-opment. These will result in higher detection limits and/or faster
detec-tions. Lastly, the LHM that will be commercially available will include four different wavelengths and will therefore allow for investigations of hybridization competition (according to PM/MM concentration ratios and temperature) by dual labeling of PM and MM targets.
In order to generalize the use of microarrays in laboratories, hospitals, or even in the field, the issues of sensi-tivity, specificity, reliability, nonsuper-vised operation, low cost, compactness, low consumption, and speed must be addressed. As discussed here, such a live microarray hybridization machine may bring a major contribution to these goals. The LHM already shows much promise as a research tool in the quest for better hybridization conditions. It should also contribute to the emergence of new diagnostic systems integrating
hybridization and readout, which will require less supervision and provide faster access to results.
ACKNOWLEDGMENTS
The LHM development, as well as this study, were partially funded by the French Ministry of Defense (DGA).
COMPETING INTERESTS STATEMENT
All of the authors except G.B. de-clare competing financial interests, as they are employed by Genewave, the company that will commercialize the live hybridization machine described in this paper. G.B. declares no competing interests.
Reachover
125,000
Life Science
Professionals Life science marketing lists with more life.
For more information, call(212) 520-2729
���������������������������������������� ������������������������������������������� �������������������������������������� ���������������������������������������� ����������������������������������������� ��������������������������� ��������������������������������������� ��������������������������������������������� ������������������������������������������ ������������������������������� ����������������������������������������� �������������������� ��������������������������� ������������� �������������������������������� ���������������������������������� ������������������������������ ����������������
��������������������������
������������������������
������������������
�������������������������������
�����
REFERENCES
1. Lockhart, D.J., H. Dong, M.C. Byrne,
M.T. Follettie, M.V. Gallo, M.S. Chee, M. Mittmann, C. Wang, et al. 1996. Expression
monitoring by hybridization to high-den-sity oligonucleotide arrays. Nat. Biotechnol.
14:1675-1680.
2. Wang, D.G., J.B. Fan, C.J. Siao, A. Berno,
P. Young, R. Sapolsky, G. Ghandour, N. Perkins, et al. 1998. Large-scale
identifica-tion, mapping, and genotyping of single-nucleotide polymorphisms in the human genome. Science 280:1077-1082.
3. Pozhitkov, A., P.A. Noble, T. Domazet-Loso,
A.W. Nolte, R. Sonnenberg, P. Staehler, M. Beier, and D. Tautz. 2006. Tests of rRNA
hybridization to microarrays suggest that hy-bridization characteristics of oligonucleotide probes for species discrimination cannot be predicted. Nucleic Acids Res. 34:e66. 4. Sekar, M.M., W. Bloch, and P.M. St. John.
2005. Comparative study of sequence-depen-dent hybridization kinetics in solution and on microspheres. Nucleic Acids Res. 33:366-375.
5. Loy, A. and L. Bodrossy. 2006. Highly parallel microbial diagnostics using oligo-nucleotide microarrays. Clin. Chim. Acta
363:106-119.
6. Fiche, J.B., A. Buhot, R. Calemczuk, and T.
Livache. 2007. Temperature effects on DNA
chip experiments from surface plasmon reso-nance imaging: isotherms and melting curves. Biophys. J. 92:935-946.
7. Khomyakova, E.B., E.V. Dreval, M.
Tran-Dang, M.C. Potier, and F.P. Soussaline.
2004. Innovative instrumentation for micro-array scanning and analysis: application for characterization of oligonucleotide duplexes behavior. Cell. Mol. Biol. (Noisy-le-grand)
50:217-224.
8. Lee, H.H., J. Smoot, Z. McMurray, D.A.
Stahl, and P. Yager. 2006. Recirculating
flow accelerates DNA microarray hybrid-ization in a microfluidic device. Lab Chip
6:1163-1170.
9. Li, E.S., J.K. Ng, J.H. Wu, and W.T. Liu. 2004. Evaluating single-base-pair discrimi-nating capability of planar oligonucleotide microchips using a non-equilibrium dissocia-tion approach. Environ. Microbiol. 6:1197-1202.
10. Liu, W.T., A.D. Mirzabekov, and D.A.
Stahl. 2001. Optimization of an
oligonucle-otide microchip for microbial identification studies: a non-equilibrium dissociation ap-proach. Environ. Microbiol. 3:619-629. 11. Stimpson, D.I., J.V. Hoijer, W.T. Hsieh, C.
Jou, J. Gordon, T. Theriault, R. Gamble, and J.D. Baldeschwieler. 1995. Real-time
detection of DNA hybridization and melt-ing on oligonucleotide arrays by usmelt-ing opti-cal wave guides. Proc. Natl. Acad. Sci. USA
92:6379-6383.
12. Wu, Y., P. de Kievit, L. Vahlkamp, D.
Pijnenburg, M. Smit, M. Dankers, D. Melchers, M. Stax, et al. 2004. Quantitative
assessment of a novel flow-through porous microarray for the rapid analysis of gene expression profiles. Nucleic Acids Res. 32: e123.
13. Urakawa, H., P.A. Noble, S. El Fantroussi,
J.J. Kelly, and D.A. Stahl. 2002.
Single-base-pair discrimination of terminal mis-matches by using oligonucleotide microarrays and neural network analyses. Appl. Environ. Microbiol. 68:235-244.
14. Wick, L.M., J.M. Rouillard, T.S. Whittam,
E. Gulari, J.M. Tiedje, and S.A. Hashsham.
2006. On-chip non-equilibrium dissocia-tion curves and dissociadissocia-tion rate constants as methods to assess specificity of oligonucle-otide probes. Nucleic Acids Res. 34:e26. 15. Bailly, X., G. Bena, V. Lenief, P. de Lajudie,
and J.C. Avarre. 2006. Development of a
lab-made microarray for analyzing the ge-netic diversity of nitrogen fixing symbionts
Sinorhizobium meliloti and Sinorhizobium
medicae. J. Microbiol. Methods 67:114-124. 16. Choumane, H., N. Ha, C. Nelep, A.
Chardon, G.O. Reymond, C. Goutel, G. Cerovic, F. Vallet, et al. 2005. Double
in-terference fluorescence enhancement from reflective slides: application to bicolor micro-arrays. Appl. Phys. Lett. 87:3.
17. Liu, W.T., J.H. Wu, E.S. Li, and E.S.
Selamat. 2005. Emission characteristics of
fluorescent labels with respect to tempera-ture changes and subsequent effects on DNA microchip studies. Appl. Environ. Microbiol.
71:6453-6457.
18. Draghici, S., P. Khatri, A.C. Eklund, and
Z. Szallasi. 2006. Reliability and
reproduc-ibility issues in DNA microarray measure-ments. Trends Genet. 22:101-109.
19. Wu, Z.S., J.H. Jiang, G.L. Shen, and R.Q.
Yu. 2007. Highly sensitive DNA detection
and point mutation identification: an electro-chemical approach based on the combined use of ligase and reverse molecular beacon. Hum. Mutat. 28:630-637.
20. Zhang, J., H.P. Lang, F. Huber, A. Bietsch,
W. Grange, U. Certa, R. Mckendry, H.-J. Guntherodt, et al. 2006. Rapid and
label-free nanomechanical detection of biomarker transcripts in human RNA. Nat. Nanotechnol.
1:214-220.
21. Li, X., J.S. Lee, and H.B. Kraatz. 2006. Electrochemical detection of single-nucleo-tide mismatches using an electrode microar-ray. Anal. Chem. 78:6096-6101.
22. Kane, M.D., T.A. Jatkoe, C.R. Stumpf, J.
Lu, J.D. Thomas, and S.J. Madore. 2000.
Assessment of the sensitivity and specific-ity of oligonucleotide (50mer) microarrays. Nucleic Acids Res. 28:4552-4557.
23. Palmer, C., E.M. Bik, M.B. Eisen, P.B.
Eckburg, T.R. Sana, P.K. Wolber, D.A. Relman, and P.O. Brown. 2006. Rapid
quantitative profiling of complex microbial populations. Nucleic Acids Res. 34:e5. 24. Zhou, J. 2003. Microarrays for bacterial
de-tection and microbial community analysis. Curr. Opin. Microbiol. 6:288-294.
25. Letowski, J., R. Brousseau, and L. Masson. 2004. Designing better probes: effect of probe size, mismatch position and number on hy-bridization in DNA oligonucleotide microar-rays. J. Microbiol. Methods 57:269-278. 26. Stenger, D.A., J.D. Andreadis, G.J. Vora,
and J.J. Pancrazio. 2002. Potential
appli-cations of DNA microarrays in
biodefense-related diagnostics. Curr. Opin. Biotechnol.
13:208-212.
27. Bodrossy, L. and A. Sessitsch. 2004. Oligonucleotide microarrays in microbial di-agnostics. Curr. Opin. Microbiol. 7:245-254. 28. Held, G.A., G. Grinstein, and Y. Tu. 2003.
Modeling of DNA microarray data by using physical properties of hybridization. Proc. Natl. Acad. Sci. USA 100:7575-7580. 29. Pullat, J., R. Fleischer, N. Becker, M.
Beier, A. Metspalu, and J.D. Hoheisel.
2007. Optimization of candidate-gene SNP-genotyping by flexible oligonucleotide mi-croarrays; analyzing variations in immune regulator genes of hay-fever samples. BMC Genomics 8:282.
30. Stedtfeld, R.D., L.M. Wick, S.W. Baushke,
D.M. Tourlousse, A.B. Herzog, Y. Xia, J.M. Rouillard, J.A. Klappenbach, et al. 2007.
Influence of dangling ends and surface-proxi-mal tails of targets on probe-target duplex formation in 16S rRNA gene-based diagnos-tic arrays. Appl. Environ. Microbiol. 73:380-389.
Received 29 November 2007; accepted 14 January 2008.
Address correspondence to Jean-Christophe Avarre, Genewave, Biology Department XTEC, Bat. 404, Ecole Polytechnique 91128 Palaiseau, France. e-mail: jean-christophe. [email protected]
To purchase reprints of this article, contact: [email protected]