HAL Id: hal-01120098
https://hal.archives-ouvertes.fr/hal-01120098
Submitted on 24 Feb 2015
HAL is a multi-disciplinary open access
archive for the deposit and dissemination of
sci-entific research documents, whether they are
pub-lished or not. The documents may come from
teaching and research institutions in France or
abroad, or from public or private research centers.
L’archive ouverte pluridisciplinaire HAL, est
destinée au dépôt et à la diffusion de documents
scientifiques de niveau recherche, publiés ou non,
émanant des établissements d’enseignement et de
recherche français ou étrangers, des laboratoires
publics ou privés.
Precipitation Water Stable Isotopes in the South
Tibetan Plateau: Observations and Modeling
Jing Gao, Valérie Masson-Delmotte, T. Yao, L. Tian, Camille Risi, G.
Hoffmann
To cite this version:
Jing Gao, Valérie Masson-Delmotte, T. Yao, L. Tian, Camille Risi, et al.. Precipitation Water Stable
Isotopes in the South Tibetan Plateau: Observations and Modeling. Journal of Climate, American
Meteorological Society, 2011, 24 (13), pp.3161-3178. �10.1175/2010jcli3736.1�. �hal-01120098�
Precipitation Water Stable Isotopes in the South Tibetan Plateau: Observations
and Modeling*
JINGGAO
Key Laboratory of Tibetan Environment Changes and Land Surface Processes, Institute of Tibetan Plateau Research, Chinese Academy of Sciences, and Graduate University of Chinese Academy of Sciences, Beijing, China
V. MASSON-DELMOTTE
Laboratoire des Sciences du Climat et de l’Environnement, IPSL, UMR, Gif-sur-Yvette, France T. YAO ANDL. TIAN
Key Laboratory of Tibetan Environment Changes and Land Surface Processes, Institute of Tibetan Plateau Research, Chinese Academy of Sciences, Beijing, China
C. RISI
LMD/IPSL, CNRS, UPMC, Paris, France G. HOFFMANN
Laboratoire des Sciences du Climat et de l’Environnement, IPSL, UMR, Gif-sur-Yvette, France (Manuscript received 19 March 2010, in final form 30 November 2010)
ABSTRACT
Measurements of precipitation isotopic composition have been conducted on a daily basis for 1 yr at Bomi, in the southeast Tibetan Plateau, an area affected by the interaction of the southwest monsoon, the westerlies, and Tibetan high pressure systems, as well as at Lhasa, situated west of Bomi. The measured isotope signals are analyzed both on an event basis and on a seasonal scale using available meteorological information and airmass trajectories. The processes driving daily and seasonal isotopic variability are investigated using multidecadal climate simulations forced by twentieth-century boundary conditions and conducted with two different isotopic atmospheric general circulation models [the isotopic version of the Laboratoire de Me´te´-orologie Dynamique GCM (LMDZiso) and the ECHAM4iso model]. Both models use specific nudging techniques to mimic observed atmospheric circulation fields. The models simulate a wet and cold bias on the Tibetan Plateau together with a dry bias in its southern part. A zoomed LMDZ simulation conducted with ;50-km local spatial resolution dramatically improves the simulation of isotopic compositions of cipitation on the Tibetan Plateau. Simulated water isotope fields are compared with new data and with pre-vious observations, and regional differences in moisture origins are analyzed using back-trajectories. Here, the focus is on relationships between the water isotopes and climate variables on an event and seasonal scale and in terms of spatial and altitudinal isotopic gradients. Enhancing the spatial resolution is crucial for improving the simulation of the precipitation isotopic composition.
1. Introduction
The stable isotopes (18O and D) of meteoric waters have been widely used in hydrological and climatic studies. Since the initiation of the International Atomic Energy Agency/World Meteorological Organization’s (IAEA/ WMO) Global Network of Isotopes in Precipitation * Supplemental information related to this paper is available at the
Journals Online Web site: http://dx.doi.org/10.1175/2010JCLI3736.s1.
Corresponding author address: Jing Gao, No. 18, 2871 Shuangqing Rd., Haidian District, Beijing 100085, China.
E-mail: gaojing@itpcas.ac.cn DOI: 10.1175/2010JCLI3736.1
(GNIP, information online at http://www-naweb.iaea. org/napc/ih/GNIP/IHS_GNIP.html) in 1961, several de-cades’ worth of data are available for a large number of stations, which, combined with theoretical one-dimensional (Ciais and Jouzel 1994) and three-dimensional models (Jouzel et al. 1994), provide improved our understanding of the mechanisms of stable isotopic fractionation in natural processes (Dansgaard 1964; Jouzel and Merlivat 1984; Jouzel et al. 1997). In the late 1980s, large gaps re-mained in the spatial coverage of GNIP stations, in par-ticular on the Tibetan Plateau. This area acts as a ‘‘water tower’’ for surrounding lowlands; therefore, determining the controls on the isotopic composition of precipitation is crucial to understanding the origin of moisture and has implications for hydrological, tree-ring, and ice-core pa-leoclimate studies (Thompson et al. 2000; Tian et al. 2003; Yao et al. 2008).
There was thus an urgent need for improvements in our monitoring and understanding of modern precipitation iso-topic composition over the Tibetan Plateau region. Since the 1990s, a network of about a dozen isotopic sampling sites has been established on the Tibetan Plateau, and has routinely operated on a monthly time step (Tian et al. 2003). These observations have revealed the regional complexity of geographical and climatic factors driving precipitation isotopic composition (Tian et al. 2003, 2007; Zhang et al. 2005; Kurita and Yamada 2008; Liu et al. 2008; Yu et al. 2008) and the imprint of airmass origins on this composition (Araguas-Araguas et al. 1998; Aizen et al. 2006; Tian et al. 2007).
In parallel with the development of monitoring net-works, water stable isotopes have been implemented in atmospheric general circulation models (AGCMs) since the early 1980s (Jouzel et al. 1987; Hoffmann and Heimann 1997; Hoffmann et al. 1998; Mathieu et al. 2002; Noone and Simmonds 2002; Vuille et al. 2005; Schmidt et al. 2007; Lee et al. 2007; Yoshimura et al. 2008; Tindall et al. 2009; Risi et al. 2010), significantly improving our understanding of the processes driving precipitation isotopic composition (Joussaume et al. 1984). Modeling water stable isotopes provides an independent evaluation of the modeled water cycle and climate. Moreover, the consistent physical framework of the model enables analysis of the climatic controls on the spatial and temporal precipitation isotopic compositions, on global or regional scales. Based on our present-day capabilities, isotopic AGCMs have also been used to explore the temporal stability of the isotope–climate relationship under varying paleoclimate boundary condi-tions (e.g., glacial climate, or changing orbital parameters) (Jouzel et al. 2000; Hoffmann et al. 2000; LeGrande and Schmidt 2009). While many of these studies focused on the polar ice caps and the interpretation of polar deep-drilling sites, they have revealed the importance of atmospheric
circulation changes in the local relationships between changes in precipitation isotopic composition and climate, including the Asian area (e.g. LeGrande and Schmidt 2009). For the Tibetan Plateau, comparisons between isotopic AGCMs and data remain a challenge. Earlier studies (Hoffmann et al. 1998; Yoshimura et al. 2003; Vuille et al. 2005) have shown that some models can capture the major observed spatial patterns, but perform better for short-term (daily or several days) isotope variability than on seasonal or interannual time scales. The challenge is first due to the difficulty in realistically capturing the basic features of the atmospheric circulation and precipitation in the area, including the correct airmass advection and local recycling patterns (Kurita and Yamada 2008). Re-cent studies have shown remarkable improvements in the realism of simulated precipitation (Shi et al. 2008; Nguyen and McGregor 2009). Model–data mismatches can be linked with the complex Tibetan Plateau topography (Chow and Chan 2009). Due to the current spatial reso-lution of AGCMs, they cannot capture the impacts of subgrid topography on regional circulation. The second challenge for Tibetan Plateau model–data comparisons is the lack of empirical observations on the Tibetan Plateau, which limits our knowledge of spatial and temporal pre-cipitation isotopic composition gradients and, in particular, of the submonthly variability. The monthly mean isotopic composition is indeed produced by the juxtaposition of individual precipitation events. Filling observational gaps is therefore essential to better understand the processes at play and to evaluate the water cycle simulated by the atmospheric models.
The first goal of this paper is to reveal the daily and seasonal characteristics of isotopic compositions in pre-cipitation and understand the links between isotopic compositions in precipitation and the moisture trajec-tory path to the south of the Tibetan Plateau, in rela-tionship with monsoon dynamics (Sengupta and Sarkar 2006). For this purpose, we present new observations of precipitation isotopic composition from a ;1-yr (October 2007–November 2008) monitoring experiment conducted on an event basis at two locations, Bomi and Lhasa, both in the south area of the Tibetan Plateau. We analyze their relationships with local meteorological pa-rameters. Then these relationships were confirmed by simulated moisture trajectory from the isotopic version of the Laboratoire de Me´te´orologie Dynamique GCM (LMDZiso).
The second goal of this paper is to evaluate the model performance of stable isotopes in precipitation on different time scales along the southern Tibetan Plateau. We use three nudged simulations run with two isotopic AGCMs (LMDZiso at two different spatial resolutions and ECHAM4iso) to analyze the distribution and processes
controlling south Tibetan precipitation isotopic com-position. The seasonal, annual, spatial, and altitudinal variations of the precipitation isotopic composition sim-ulated by both models are compared with the monthly observations from three Tibetan stations (Bomi, Lhasa, and Tuotuohe, China) and two nearby stations (Mumbai and Shilong, India) influenced by the Asian monsoon.
In section 2, we describe the study area, the observa-tional data used here, and the AGCM models enabled with water stable isotopes. In section 3, we discuss the relationships between the observed stable isotopic com-positions and the meteorological data. In section 4, we compare observations with simulations from LMDZiso and ECHAMiso.
2. Material and methods a. Study area
Located on the southeastern margin of the Tibetan Plateau, at the junction of the Nyainqentanglha and Himalaya Mountains, the Bomi area (298219–308409N, 948009–968309E) is a crucial region for studying moisture transport processes and the interaction of major circu-lation systems (southwest monsoon, westerly flow, and the Tibetan high pressure system; see Fig. 1).
Moving along the Brahmaputra River, the southern moisture flow reaches this area with the onset of the Indian monsoon, resulting in abundant rainfall. At Bomi, located in the valley of the Parlang Zangbo River (298509N, 958479E, 2730 m MSL), meteorological data show that the
annual mean precipitation is ;835 mm (from 1961 to 2003) with evaporation reaching ;700 mm (from 1980 to 2003). Monthly mean precipitation amounts are higher than 50 mm from March to October and usually peak in June. The annual mean relative humidity is about 71%, reaching up to 80% in September. The annual mean temperature is 8.68C, ranging from 08C in January to 16.58C in July (Fig. 2a). During our sampling year (from October 2007 to November 2008), the spring and summer (March–September) precipitation amount accounts for ;80% of the annual rainfall, similar to the long-term average precipitation percentage at Bomi recorded at the meteorological station. The average temperature (9.98C) and relative humidity (72%) are also close to the long-term averages. We can therefore consider that this single year of precipitation isotopic composition observations represents a ‘‘normal monsoon’’ year.
Lhasa is located in a vast valley along the Brahmaputra River, to the west of Bomi by 570 km. The annual mean precipitation amount at the Lhasa meteorological station (298429N, 918089E, 3650 m MSL) is ;620 mm, and the area is dominated by monsoon precipitation, with about 85% of the total annual precipitation occurring as rain-fall from May to September. The annual mean temper-ature is 7.58C and the annual mean relative humidity is about 47%, showing that Lhasa is drier than Bomi out-side of July–August (Fig. 2b). The interannual variabil-ities in monthly temperature and relative humidity are higher at Lhasa than are those at Bomi; while Bomi shows a larger variability of annual precipitation. During our sampling year (October 2007–November 2008), the rainfall from May to September accounts for 90% of the total annual precipitation; similar to the long-term average percentage of precipitation occurring during the monsoon period at Lhasa. At Lhasa, the precipitation isotopic composition has been monitored on an event basis since the 1990s (Tian et al. 2003). The annual weighted mean d18O in precipitation calculated from our event-based sampling (see next section) (216.9&) is close to the multiyear weighted mean values (217.4&). Thus, our observation year is representative of a normal monsoon year and the isotopic composition of pre-cipitation from Lhasa and Bomi is comparable to com-parisons with other long-term datasets. These results will be discussed in section 3.
Here, we also refer to monthly mean observations avail-able from different precipitation collection stations on and around the Tibetan Plateau: two stations in the IAEA’s GNIP network (Mumbai and Shilong) (data available from 1961 to 1978, downloaded from the Web site http:// www-naweb.iaea.org/napc/ih/GNIP/IHS_GNIP.html) and Lhasa and Tuotuohe, meteorological stations (our ob-servations; data available from 1996 to 1999; see Fig. 1). FIG. 1. Location of the study area and sites of interest. Open circles
indicate the locations of the five precipitation sampling sites providing temperature and precipitation data. This paper uses unpublished data from Bomi and Lhasa together with available data from Lhasa, Mumbai, Shilong, and Tuotuohe. Arrows show the general patterns of summer moisture transport that affect the seasonal isotopic variations of precipitation in the study area. The gray shading is a mask of ele-vations .3000 m. In this paper, we have performed new measure-ments of dD on Tuotuohe monthly mean precipitation samples in order to depict its d-excess seasonal cycle (see section 4).
Figure 2 shows the mean seasonal variations of mete-orological conditions and observed monthly mean d18O
in precipitation at these five stations. Mumbai (10 m MSL) is our southernmost site, with an annual mean temper-ature of 27.18C and an annual precipitation amount of ;1985 mm, which is mostly (90%) provided by wet season precipitation (June–September). The climate at Shilong, located northward and at higher altitude (1598 m MSL), is colder (annual mean temperature of 14.78C) and is also controlled by the summer monsoon, with a mean annual precipitation amount of ;2155 mm. As previously explained, Bomi and Lhasa are located in the valley near the Brahmaputra where monsoon moisture is transported toward the southern Tibetan Plateau (Lin and Wu 1990). Tuotuohe with the highest altitude (4533 m) is our northernmost, coldest (annual mean temperature of 23.88C), and driest (;260 mm yr21)
site, as it is outside of the monsoon influence and is un-der the influence of continental air masses. The observed monthly mean weighted d18O in precipitation decreases from south to north, except for at Tuotuohe (Fig. 2c). In the southern Tibetan Plateau, the amount effect domi-nates the variation of precipitation d18O and the heavy isotopes undergo a gradual depletion along the north-ward monsoon transport. In the northern Tibetan Plateau, a different moisture origin is found and the variations in precipitation d18O are controlled by temperature (Tian et al. 2003, 2007). These monthly mean records
will be discussed in detail in section 4 for comparison with isotopic simulations.
b. Precipitation sampling and data acquirement Precipitation samples were collected on an event basis from October 2007 to November 2008 at the Bomi and Lhasa meteorological stations. Rainfall samples were immediately sealed in plastic bottles to prevent evapo-ration. Solid precipitation samples were collected and melted at room temperature, and then preserved as rainfall samples. All of the samples were stored frozen until analysis.
The isotopic composition of the 113 precipitation sam-ples at Bomi was measured at the Laboratoire des Sci-ences du Climat et de l’Environnement, France. The d18O amounts were measured by equilibration on a MAT-252 mass spectrometer, with an analytical precision of 0.05&, and dD was measured by reduction on uranium, with an analytical precision of 0.5&. The d18O measurements of the 90 precipitation samples at Lhasa were performed with a MAT-253 mass spectrometer with GasBench-II (Thermo Scientific, Waltham Massachusetts) and the dD of 156 precipitation samples were measured by inductively coupled plasma mass spectrometry (ICP-MS; X-7 series, Thermo Scientific) at the Key Laboratory of the Chinese Academy of Sciences (CAS) for Tibetan Environment and Land Surface Processes, Institute of Tibetan Plateau Research, with a precision of 0.05& for d18O and 0.5& for
FIG. 2. Mean seasonal cycle of meteorological condi-tions at five stacondi-tions (red represents Mumbai, green rep-resents Shilong, black reprep-resents Bomi, blue reprep-resents Lhasa, and magenta represents Tuotuohe): (a) monthly mean temperature (8C), (b) precipitation amount (mm month21), and (c) observed d18O (&) in precipitation. Vertical error bars display the interannual monthly stan-dard deviations. Purple lines are reference horizontal lines. The monthly mean data are available at Mumbai from 1961 to 1976, at Shilong from 1966 to 1978, and at Lhasa and Tuotuohe from 1996 to 1999.
dD. All of the measured results were calibrated with re-spect to Vienna standard mean ocean water (VSMOW). Interlaboratory d18O comparisons were conducted with 53 samples and demonstrate the lack of systematic biases (the average of the difference is 0.02& and the standard deviation is 0.07&), making possible the comparison of the spatial and temporal variations of d18O in pre-cipitation at Bomi and Lhasa.
The air temperatures and precipitation amounts were recorded for each precipitation events at both stations, through the average of the observed temperature before and after the precipitation event, and through the total precipitation amount for each event. Monthly meteo-rological data are also available from 1961 to 2003 (see section 2a).
c. AGCM simulations
Two isotopic GCMs (LMDZiso and ECHAMiso) are used in this paper to evaluate the performance of sim-ulations and explore processes that control the isotopic composition of precipitation in India and the Tibetan Plateau.
LMDZ, developed at the Laboratoire de Me´te´orologie Dynamique (LMD), is the atmospheric component of the L’Institut Pierre-Simon Laplace (IPSL) model. The model resolution is shown in Table 1. The dynamical equations are discretized on a latitude–longitude grid. Water in its vapor and condensed forms is advected by the Van Leer advection scheme (Van Leer 1977), which is a monotonic second-order finite-volume scheme. The physical parameterization scheme is described in detail in Hourdin et al. (2006). It includes the Emanuel convective parameterization (Emanuel 1991; Emanuel and Zivkovic-Rothman 1999) coupled to the (Bony and Emanuel 2001) cloud scheme. Risi et al. (2010) describe in detail the implementation of water stable isotopes in LMDZiso and the performances of the model for present and past climates. The representation of isotopic processes in the convection scheme is described in Bony et al. (2008). In this paper, we use three different simulations conducted with LMDZiso. The first is a climatological simulation run from 1979 to 2007 using the Atmospheric Model Intercomparison Project (AMIP) protocol (Gates 1992). In this simulation monthly interannually varying SSTs and sea ice, as well as a fixed CO2value (348 ppm), are
prescribed (Risi et al. 2010). The second run is a ‘‘nudged’’
simulation. Using the same boundary conditions as in the first run, the horizontal wind fields are nudged to the European Centre for Medium-Range Weather Forecasts (ECMWF) reanalysis results (Uppala et al. 2005). To do so, the simulated winds are relaxed in each grid box and at all levels toward the reanalyzed winds with a relaxation time of 1 h (Coindreau et al. 2007; Xin et al. 2008; Risi et al. 2010). In this case, the simulated large-scale wind field is consistent with the observations, making possible the comparison of simulated and observed daily or monthly meteorological conditions and precipitation isotopic com-positions. The third run is an additional nudged simulation, as in the second, was performed using the zoom function-ality of the LMDZ model. The grid was stretched so that the horizontal resolution was in the range of 50–60 km in a domain extending between 08 and 558N and 608 and 1308E. This domain is larger than that in Fig. 1, so that each of our sites of interest is far enough from the zoom borders. This additional zoomed simulation was run over 3 yr (2005– 07) to test the impact of spatial resolution on LMDZ outputs (see section 4). As in the second run, horizontal winds were nudged to the ECMWF reanalyses with re-laxation times of 1 and 4 h outside and inside the zoom, respectively.
Here, we compare LMDZiso results with the results of another AGCM previously used for the monsoon area (Hoffmann and Heimann 1997). The ECHAM model has 19 vertical layers, from surface pressure up to a pressure level of 30 hPa, with a horizontal resolution of 2.88 3 2.88 (time step of 24 min; see Table 1). The model’s specific humidity and optional tracers are transported using a semi-Lagrangian advection scheme (Rasch and Williamson 1990). This model is documented in detail in Roeckner et al. (1996). The water isotope physics was implemented in a way similar to that in the Goddard Institute for Space Studies (GISS) AGCM (Jouzel et al. 1987), which is described in Hoffmann et al. (1998). It should be pointed out that there are four main differences between LMDZiso and ECHAMiso. First, LMDZ is a grid-point model whereas ECHAM is a spectral model, though it is combined with a semi-Lagrangian transport. Second, the ECHAM has a higher global horizontal resolution than LMDZ in the standard resolution, but a coarser one than LMDZ in the zoomed configuration. Third, LMDZiso explicitly calculates the evolution of raindrops composi-tion as they evaporate into, and re-equilibrate with, the TABLE1. Model resolutions and basic outputs information.
Model Simulation date Data type Data No. Model resolution
Standard LMDZ 1 Jan 1979–31 Dec 2007 Daily 10 592 3 5 2.58 lat 3 3.758 lon, 19 vertical layers Zoomed LMDZ 1 Jan 2005–31 Dec 2007 Daily 1095 3 5 50–60 km, 19 vertical layers ECHAM Jan 1970–Dec 2001 Monthly 384 3 5 2.88 lat 3 2.88 lon, 19 vertical layers
surrounding vapor following Stewart (1975), as detailed in Bony et al. (2008). In contrast, ECHAM prescribes a con-stant percentage of raindrops that re-equilibrates depend-ing on two cloud types. Fourth, the evolution of both the rain and vapor compositions throughout the evaporation process is considered in LMDZiso, contrary to ECHAM (as detailed in Bony et al. 2008).
As for LMDZiso, we use here two different simula-tions: 1) A ‘‘free’’ 1970–2001 ECHAM run using monthly SST, sea ice, and greenhouse gas concentration datasets (Hurrell and Trenberth 1999) and 2) a nudged simulation where the 3D horizontal winds are also nudged toward the results of the 40-yr ECMWF Re-Analysis (ERA40; Uppala et al. 2005).
3. Observed characteristics of stable isotopes in precipitation in the south Tibetan Plateau In this section, we first show the observed isotopic composition of precipitation at Bomi from 2007 to 2008 and its relationships with local meteorological data. We then compare the temporal distributions and seasonal cycles of the observations at Bomi and Lhasa to explore the different moisture origins.
a. Isotopic compositions of precipitation at Bomi and links with local weather variables
Figure 3 presents the temporal variations in the relative humidity, air temperature, precipitation amount, and pre-cipitation d18O of individual precipitation events
col-lected at Bomi from October 2007 to November 2008 (see methods in section 2a). The d18O values show sig-nificant seasonality and, at the event basis, some links with local weather parameters. During the dry winter, the most depleted d18O values occur within the largest storm precipitation events. From November 2007 to May 2008, d18O values vary between 5.5& and 222.8& and are positively correlated with temperature (R 5 0.58, n 5 41), in agreement with the isotopic tempera-ture effect (Dansgaard 1964). From June to October, d18O is progressively depleted, varying from 20.5& to 229.1&. During this summer–autumn period, the low-est d18O values correspond to the highest precipitation amounts, with a correlation coefficient of 20.56 (n 5 72) between d18O and precipitation amount. Notably, in
March and April, marked by 200 mm of total pre-cipitation, d18O values show a positive correlation with temperature (R 5 0.47, n 5 23), a negative correlation with relative humidity (R 5 20.56, n 5 23), and no cor-relation with precipitation amount. In October, d18O values are lowest and show no linear correlation with temperature or relative humidity but the strongest in-verse correlation with precipitation (R5 20.72, n 5 14).
All of these correlation coefficients are significant at a level exceeding 99% and demonstrate that, at the event basis, different meteorological factors affect the varia-tions in Bomi precipitation d18O in different seasons.
Additional deuterium measurements enable discussion of the local meteoric water line and the deuterium excess variability. The local meteoric water line (LMWL) at Bomi is calculated as dD 5 7:85d18O 1 4:27 (R250.98) (Fig. 3b). The observed slope at Bomi is close to the FIG. 3. (a) (top to bottom) Observed event-based RH, temperature, d18O in precipitation, d excess, and precipitation at Bomi, from Oc-tober 2007 to December 2008. The black stars show the days for which back-trajectories are shown in Fig. S1 of the supplemental material, from left to right: 12 Jan, 3 Jun, 1 Jul, and 27 Oct 2008. (b) The dD vs d18O plot for all precipitation samples defining the LMWL at Bomi.
slope of 8 for the global meteoric water line (Yurtsever and Gat 1981) and suggests a limited impact of non-equilibrium processes on precipitation. This value is also very close to the slope of LMWL at Lhasa (7.9), as well as other observed values reported by Tian et al. (2001). The intercept of 4.27 is rather low, compared to values of 10 in the global precipitation data, ;8.0 at Mumbai and Shilong (Gupta et al. 2005), and 6.2 in LMWL at Lhasa (Tian et al. 2001). This low intercept reflects high rela-tive humidity at Bomi’s moisture source (Clark and Fritz 1997).
The d excess (d 5 dD 2 8d18O; Dansgaard 1964) of precipitation events varies between 28.9& to 22.3&. The annual precipitation weighted mean d excess (9.8&) is close to the d excess of precipitation at Kolkata (Sengupta and Sarkar 2006). For the whole dataset, d excess is negatively correlated with Bomi temperature, with a correlation coefficient of 20.51 (slope 5 20.75& 8C21, n 5 109, p , 0.0001) and posi-tively correlated with the precipitation amount (R 5 0.42, slope 5 0.50& mm21, n 5 109, p , 0.0001). There is no significant correlation between the d excess of events and temperature, precipitation amount, and relative humid-ity in winter, spring, and autumn. In summer, the d excess of events shows a positive relationship with precipita-tion amount (R 5 0.49, slope 5 0.77& mm21, p , 0.0001)
and does not show any correlation with local relative humidity. Seasonal shifts in deuterium excess reflect the inflow of monsoon moisture (Fig. S1 in the supplemental material), with May–September levels below 10&.
The seasonal variations appear more clearly from monthly precipitation weighted data (Fig. 4). The monthly d18O increases with temperature from February to May, and shows an inverse correlation with precipitation amount from June to October. Apparently, the links between weather and d18O are therefore consistent from the
event base to the monthly scale at Bomi: precipitation d18O appears to be mostly driven by changes in the local precipitation amount during the monsoon season and by local temperature changes during the rest of the year.
Since d excess is affected by the relative humidity, temperature, and wind speed during primary evapora-tion (Merlivat and Jouzel 1979), it is expected to reflect different moisture levels during the monsoon season and nonmonsoon seasons in this region (Tian et al. 2007; Xu et al. 2009). It has poor correlation with latitude (Rozanski et al. 1992). Starting from high winter–spring values (;11&), the monthly precipitation-weighted d ex-cess abruptly decreases in May to reach a low ;5& level that persists until September, close to the d excess of sur-face water near the Bay of Bengal coast in eastern India (Gupta et al. 2005). After September, d excess increases while there is no clear shift in d18O.
The seasonal cycle of the Bomi precipitation iso-topic composition can be interpreted as resulting from different air masses: during late autumn–spring, an inflow of continental (the westerlies and local con-vection; see Fig. S2 in the supplemental material) air masses is marked by a temperature control of d18O and high d-excess values; during summer and early autumn, the monsoon flow is marked by a precipitation effect of d18O, a progressive depletion of d18O, and low d-excess
values. In May and September–October, the isotopic data suggest a simultaneous occurrence of continental and monsoon moisture transport systems.
b. Comparison of precipitation d18O at Bomi and Lhasa
The main monsoonal moisture flow is transported along the Brahmaputra River toward the southern Tibetan Plateau (Gao et al. 1985; Lin and Wu 1990; Tian et al. 2003, 2007). Here, we compare the precipitation d18O FIG. 4. Monthly precipitation-weighted d18O and d excess observed at Bomi along with the
sampled in parallel at these two locations on an event basis to estimate the difference in moisture transport.
At each station, the number of precipitation samples (Table 2) depends on the precipitation frequency and the seasonal precipitation distribution. At Lhasa, precip-itation events primarily take place in summer (June– September, JJAS), while Bomi precipitation events are more evenly distributed, mostly from March to October. Although Lhasa and Bomi are located at the same latitude and within 570-km distance, Lhasa received 128.5 mm less precipitation during our sampling period (Table 2, Fig. 5), consistent with the climatological averages (see section 2a). Two main reasons can be invoked to explain this differ-ence: 1) earlier onset and later retreat of monsoon flow at Bomi than at Lhasa and 2) stronger continental recycling and convection near Bomi (with higher relative humid-ity), providing larger precipitation amounts.
At both stations, the seasonal distribution of pre-cipitation d18O is characterized by peak d18O values in spring (March–May, MAM) and minimum summer d18O values (JJAS) (Fig. 5a). During our observation period, the summer precipitation amount is more than 100 mm higher at Lhasa compared to Bomi, with 57% of the total summer precipitation amounts at Lhasa and 68% at Bomi occurring on the same days. This suggests the influence of common large-scale processes. During summer, d18O values are systematically 5.3& more depleted at Lhasa than those of simultaneous precipitation events sampled at Bomi. This could be linked to the orographic uplift of monsoon flow, resulting in deeper convection at Lhasa, located about 1000 m higher than Bomi.
Figure 5b displays the relationships between summer precipitation d18O and precipitation amount at the monthly scale and at the event basis (Fig. 5c). On a monthly scale, the isotopic depletions at Bomi and Lhasa (29& and 28& from June to August) are comparable despite a factor of 2 in the precipitation amounts at these 2 loca-tions; being much higher at Lhasa. There is a general inverse correlation between monthly mean d18O and precipitation amount at Lhasa. In particular, the dif-ference in the relationship between precipitation d18O and precipitation amount at these two stations in June and July may indicate more complicated moisture origins at Bomi. At the event scale, the ‘‘amount effect’’ is much stronger at Lhasa than at Bomi, both in terms of correla-tion coefficient and in terms of the d18O-precipitation
slope: precipitation d18O does not show an obvious cor-relation with daily temperature during our observation period at Lhasa. In the summer (JJAS), the precipitation d18O has a remarkable negative correlation with pre-cipitation amount, with a coefficient of 20.56 (n 5 62, p , 0.0001) which is better than that of Bomi (R 5 20.26, n 5 57, p , 0.05), while the slope of the d18O pre-cipitation is 20.51 at Lhasa, lower than that at Bomi (20.34). The annual mean d excess at Lhasa (7.9&) is TABLE2. Precipitation sampling at Bomi and Lhasa during 2007–08.
Stations Obs periods Alt (m)
No. of samples Total precipitation (mm) No. of summer events Precipitation amount in summer (mm) Bomi 21 Oct 2007 to 22 Nov 2008 2730 113 652.5 57 292.6 Lhasa 9 Oct 2007 to 4 Nov 2008 3658 90 524 62 427.3
FIG. 5. (a) Comparison of daily d18O in precipitation and pre-cipitation amounts observed from October 2007 to November 2008 at Bomi (black) and Lhasa (gray). Relationships between summer precipitation d18O and precipitation amounts (b) on a monthly scale and (c) on an event basis.
about 2& lower than that at Bomi. These differences may be explained by different moisture sources. Lhasa’s moisture is mostly provided by monsoon flow, while Bomi receives moisture provided by different moisture advec-tion paths (the westerlies, local recycling, and monsoon flow) resulting in a subdued precipitation amount effect. Long-term monthly observations available for Lhasa re-veal that interannual precipitation d18O levels are also driven by the amount effect (Tian et al. 2003).
4. Comparison of observations with simulations from LMDZiso and ECHAMiso models
The GNIP network initiated in 1961 provides long-term monthly data for a number of sites in the world. Through monitoring stations initiated in the 1990s, a multiyear dataset is available for some sites on the Ti-betan Plateau. Here, we use three of these TiTi-betan sites (Lhasa, Bomi, and Tuotuohe) and two GNIP sites located in India (Mumbai and Shilong) with multiyear records (Fig. 1), previously described in section 2, to compare the observed seasonal patterns with LMDZiso and ECHAM4iso model outputs. For each model, we also compare two types of simulations, the free versus nudged simulations. The averaged data over the closest grid box compared with the observed data from monitoring sta-tions. Note that the scale mismatch may contribute to the difference between observations and simulations. a. Spatial distribution of annual mean isotopes in
precipitation in India and on the Tibetan Plateau Risi et al. (2010) have documented the validity of global simulations from LMDZiso at different scales. Figure 6 shows maps of simulated annual mean d18O and d excess in precipitation in India and along the Tibetan Plateau. The nudged ECHAM4iso and LMDZiso re-sults do capture the spatial pattern of precipitation d18O and the increasing northward isotopic depletion (Table 3), although there are mismatches in some regions. The stan-dard LMDZiso (hereafter LMDZisoctrl) and ECHAM
simulate annual mean d18O values close to the obser-vations below 2000 and above 4500 m, but they fail to capture the strongly depleted d18O values between 2000 and 4500 m (e.g., Bomi and Lhasa). This may be due to too a weak history of distillation upstream resulting from the underestimated precipitation on the foothills. Satis-factorily, the zoomed LMDZiso (hereafter LMDZisohr)
successfully simulated the lower d18O along the Himalayas and the Tibetan Plateau as the most depleted d18O region, matching better with the observations. This demonstrates that the improved spatial resolution is crucial for realistic simulations. Thanks to the high-resolution topography representation, the air masses undergo more distillation
before arriving on the Tibetan Plateau (discussed in detail in section 4b). Thus, the zoomed annual mean d18O values are lower than the standard simulations, with a depletion of ;5&, and match the observed d18O in precipitation.
Simulations for both models show the ‘‘temperature effect,’’ amount effect (Risi et al. 2010), and ‘‘altitude effect’’ used to reconstruct the history of the Himalayan– Tibetan Plateau uplift, which is critical to understand past Asian monsoon evolutionary patterns (Ramstein et al. 1997). Precipitation isotopic data collected at these five stations suggest a d18O versus elevation gradient of 20.3& (100 m)21(R250.48; see Fig. 7), in agreement with previous Tibetan Plateau analyses (Hou et al. 2003; Tian et al. 2008). The overall simulated d18O–altitude relationships are rather consistent with the observations, with mean slopes of 20.2& (100 m)21for all simulations. In winter, the observed d18O–altitude relationship is sig-nificant in this region with a slope of 20.6& (100 m)21, and all simulations underestimate this d18O–altitude re-lationships with slopes of 20.3& (100 m)21(even lower for LMDZisohrsimulation). In summer, all simulations
again underestimate the d18O–altitude relationship with slopes of 20.1& (100 m)21from LMDZisoctrl, 20.15&
(100 m)21for LMDZisohr, and 20.2& (100 m)21from
ECHAM, all of which are less than the slope of 20.3& (100 m)21obtained from observations. At the locations of the Tibetan Plateau monitoring stations, models have a higher elevation on average (because they cannot re-solve the subgrid valley topography) and strongly over-estimate the local precipitation amount (Table 3); it is therefore surprising that the models capture reasonably well the overall elevation gradient. Finally, the model results overestimate the elevation effect for the high-altitude sites (between 2000 and 5000 m) with large simulated slopes [20.5& (100 m)21]. While clearly improving the seasonal cycle of precipitation isotopic composition in the Tibetan Plateau, the zoomed sim-ulation does not capture the right amplitude of the altitude effects on d excess or d18O, especially in winter. The fact that observed slopes differ at low and high ele-vations, and that models underestimate elevation impacts at middle elevations but overestimate these elevation impacts for high-elevation locations, clearly brings into question the use of isotopic AGCMs to refine paleo-elevation reconstructions.
The spatial distribution of the annual mean d excess in precipitation is not as well simulated as d18O in all of the models. Both LMDZisoctrl and ECHAM overestimate
the d excess in precipitation around the Himalayas and show a stable d-excess spatial distribution, but LMDZisohr
underestimates the d excess in this region while also strongly overestimating the d excess at Mumbai (Fig. 6). ECHAM reproduces the d-excess altitude relationship
FIG. 6. Spatial variations of d18O and d excess in precipitation from observations and three simulations
more reasonably with a slope of 0.24& (100 m)21(R 5 0.92) while the observed d-altitude slope is 0.12& (100 m)21(R 5 0.78). The standard and zoomed d ex-cesses fail to reproduce this relationship.
b. Seasonal cycles of stable isotopes in precipitation in India and on the Tibetan Plateau
Figure 8 shows the simulated seasonal cycles of tem-perature, precipitation amount, d18O, and d excess in
precipitation over five GNIP stations (including our new measurements for Bomi, Lhasa, and Tuotuohe). We can therefore compare the modeled results with the obser-vations (Figs. 2 and 8). From south to north, both models reproduce the seasonal patterns of temperature to some extent, despite systematic biases. The nudged LMDZiso (hereafter LMDZisoctrl) simulation is 68C too warm
during the spring at Shilong, but underestimates Tibetan Plateau temperatures by up to 108C. The comparison between the free AMIP simulation and the nudged sim-ulation reveals a slight improvement in the seasonal cycle of temperature with the nudging at Mumbai and Shilong, which is consistent with the results of Yoshimura et al. (2008). In contrast, the nudging deepens the model cold bias from LMDZiso for the Tibetan Plateau. This means that the LMDZiso model biases are not linked with the large-scale atmospheric dynamics and altitude difference (Table 3) but to model parameterizations, which can in-clude, for instance, land surface properties (albedo and latent and sensible heat fluxes), boundary layer charac-teristics, and/or cloud properties (Kripalani et al. 2007a; Kripalani et al. 2007b). ECHAM performs relatively well for temperatures at Mumbai and Shilong, but also shows a 78C systematic cold bias for the Tibetan Plateau. With ECHAM, the nudging slightly enhances the cold
winter–spring bias at Lhasa, but induces much warmer temperatures in Tuotuohe, in better agreement with the observations. For this location, driving the model toward the observed large-scale wind fields clearly improves the realism of the simulated climate.
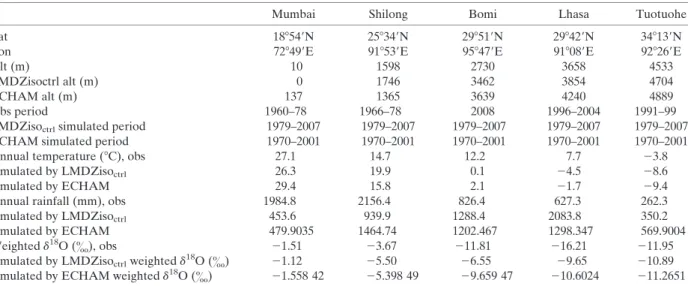
Regarding the precipitation seasonal cycle, nudged simulations of both models capture the pattern of the precipitation seasonal cycle, but strongly underestimate the precipitation amounts (by 60%–70% for LMDZiso TABLE3. Summary of observed–modeled isotope and meteorological data from the standard LMDZ model for five stations.
Mumbai Shilong Bomi Lhasa Tuotuohe
Lat 188549N 258349N 298519N 298429N 348139N
Lon 728499E 918539E 958479E 918089E 928269E
Alt (m) 10 1598 2730 3658 4533
LMDZisoctrl alt (m) 0 1746 3462 3854 4704
ECHAM alt (m) 137 1365 3639 4240 4889
Obs period 1960–78 1966–78 2008 1996–2004 1991–99 LMDZisoctrlsimulated period 1979–2007 1979–2007 1979–2007 1979–2007 1979–2007
ECHAM simulated period 1970–2001 1970–2001 1970–2001 1970–2001 1970–2001 Annual temperature (8C), obs 27.1 14.7 12.2 7.7 23.8 Simulated by LMDZisoctrl 26.3 19.9 0.1 24.5 28.6
Simulated by ECHAM 29.4 15.8 2.1 21.7 29.4
Annual rainfall (mm), obs 1984.8 2156.4 826.4 627.3 262.3 Simulated by LMDZisoctrl 453.6 939.9 1288.4 2083.8 350.2
Simulated by ECHAM 479.9035 1464.74 1202.467 1298.347 569.9004 Weighted d18O (&), obs 21.51 23.67 211.81 216.21 211.95 Simulated by LMDZisoctrlweighted d18O (&) 21.12 25.50 26.55 29.65 210.89
Simulated by ECHAM weighted d18O (&) 21.558 42 25.398 49 29.659 47 210.6024 211.2651
FIG. 7. Annual mean (filled circles), summer (black triangles), and winter (white triangles) variations of precipitation-weighted d18O for observations (black), LMDZiso
ctrl (red), LMDZisohr
(green), and ECHAM (blue) as a function of site elevation. Note that, due to the model grids, elevations for the geographical loca-tions of Bomi, Lhasa, and Tuotuohe are systematically higher in the model ‘‘averaged topography’’ than the actual elevation of the valleys where the observations are conducted. The lower elevation for the coarser-resolution simulations (in apparent better agree-ment with the data) reflects the underestimated average elevation of the Tibetan plateau at coarse resolution.
and 0% ; 75% for ECHAM, respectively) in India, while both models overestimate the precipitation amounts on the Tibetan Plateau. For LMDZ, the nudging clearly improves the hydrological cycle compared to the free simulation, which is even drier at Shilong and wetter in Tibet. For ECHAM, the nudging enhances the model wet bias in summer for Bomi and Lhasa. Overestimating the precipitation over high-elevation regions and underestimating
it over nearby plains is a widespread bias in GCMs (Codron and Sadourny 2002).
The temperature in the zoomed simulation is not re-markably improved at Mumbai and Shilong, but it is slightly closer to the observations at the Tibetan sta-tions, compared with simulations from LMDZisoctrl.
The correlation coefficient for the precipitation amount from LMDZisohris 0.72 ( p , 0.0001), much higher than
FIG. 8. Nudged multiyear monthly averages of climatology and stable isotopic compositions of precipitation (from left to right: air temperature, precipitation amount, d18O, and d excess in precipitation) observed (black) from south to north and compared with
sim-ulations from LMDZiso (red, standard simulation; green, zoomed simulation) and ECHAM (blue). Solid lines show the nudged simu-lations, while dashed lines show the free simulations. Note that, for readability, different vertical-axes scales have been used for d18O and
d excess. We used the standard simulations from LMDZiso for 29 yr (1979–2007), zoomed simulations from LMDZiso for 3 yr (2005–07), and from ECHAM for 31 yr (1970–2000). The lack of Mumbai data arises from a shortage of sampled precipitation and data in the IAEA database, as well as in model outputs.
that from LMDZisoctrl(R 5 0.50, p , 0.0001). The model
performs better for precipitation on the Tibetan Plateau than for India. The zoomed model simulates more an-nual precipitation at Mumbai and Shilong. Although there are differences between the simulated and observed variations of precipitation during spring and summer, zoomed simulations can realistically reproduce the seasonal precipitation patterns at Bomi and Lhasa. At Tuotuohe, the precipitation simulated by LMDZ is almost coincident with the observations.
To summarize, both models exhibit a summer dry bias for India together with a year-round cold and wet bias for the Tibetan Plateau. Part of the model–data mis-matches may arise from the model resolutions and the difficulties involved with capturing the complex in-fluences of the south Tibetan topography, but the com-parison between the nudged and free simulations reveals that they cannot be explained by large-scale dynamics and, therefore, point to the model physical parameterizations. Consistent with earlier model in-tercomparisons, ECHAM seems to perform better than LMDZ regarding monsoon precipitation (Kripalani et al. 2007a,b).
The performances of LMDZ and ECHAM in simu-lating stable isotopes in precipitation are also scrutinized (Fig. 8). Despite temperature and precipitation biases, LMDZ and ECHAM do capture the seasonal pattern of precipitation d18O to some extent. At Mumbai, both models show d18O seasonal cycles consistent with the observations, with minimum values in late summer– early autumn. At Shilong, the ECHAM model captures correctly the seasonal variations of d18O in precipitation, but slightly underestimates the isotopic depletion ob-served in September. For this location, LMDZisoctrl
shows too flat a seasonal cycle and underestimates the summer depletion by about 5&; this was expected from the model dry bias for this area. On the Tibetan Plateau (Bomi and Lhasa), LMDZisoctrl shows rather stable
isotopic values all year round and fails to capture the observed seasonality. Thanks to a better simulation of the monsoon precipitation on the Tibetan Plateau, ECHAM does reasonably capture the summer’s de-pleted d18O values, which are affected by the amount effect, but, similarly to LMDZctrl it overestimates the
winter d18O. Finally, both models capture correctly the
pattern of d18O at Tuotuohe, but again exhibit too high isotopic values in winter and not enough depletion in late summer (August–September). The nudged seasonal cycles of d excess are similar for both models at Shilong, Bomi, and Lhasa, albeit with different simulated d-excess levels in October and in November. Compared with the observations, both models capture the seasonal pattern and amplitude of d excess at Mumbai and Lhasa,
but again fail to reproduce the seasonal d-excess cycle at other stations. At Tuotuohe, the ECHAM simulates significantly higher d excess (3& ;10&) than that of LMDZisoctrl all year round, while the simulated d18O
values are similar.
For ECHAM, the nudged simulation clearly improves the realism of the simulated precipitation d18O, espe-cially on the Tibetan Plateau (Figs. 8k to 8o). Both the free and standard LMDZ simulations produce too flat precipitation d18O seasonal cycles, and the nudging even reduces the magnitude of the simulated seasonal cycle. The nudging however improves the simulation of d ex-cess for both models, especially at Mumbai and Shilong. The LMDZisohrsimulation dramatically improves the
forecasts of precipitation d18O and d-excess patterns, especially on the Tibetan Plateau. On the Tibetan Pla-teau, the zoomed simulations of precipitation d18O are very close to the observations, with a correlation co-efficient of 0.86 ( p , 0.0001). In fact, the zoomed sim-ulation induces a very large precipitation amount at Shilong, which enhances depletion, leading to low pre-cipitation d18O on the Tibetan Plateau in agreement with the observations. The fact that d18O is significantly improved in LMDZisohrcompared to LMDZisoctrl, while
temperature and precipitation are not, confirms that the isotopic composition of water constitutes an added value to investigate the water cycle compared to meteorologi-cal measurements only, since it reflects the dehydration history and processes along trajectories that are not readily identifiable in meteorological data (Worden et al. 2007; Galewsky and Hurley 2010). However, the zoomed simulation does not improve the seasonal cy-cle of d excess, which is controlled by factors other than d18O.
The performance of the models in capturing the sea-sonality of precipitation d18O and d excess is obviously affected by model biases for temperature and precip-itation, albeit in a complex manner. Given their coarse spatial resolutions, models do not capture intense storms associated with strong isotopic depletion, and despite the nudging with large-scale observed wind fields, may not represent correctly the seasonal shifts in airmass trajectories. Compared with other Tibetan stations, the models perform better for precipitation isotopic com-position where the monsoon influence is weakest. This indicates that the simulation of the monsoon is pivotal to the accurate simulation of the seasonal variations for both models.
c. Comparison with daily observations at Bomi and Lhasa
Because the nudged ECHAM simulation does not cover 2008, we have to restrict this model–data comparison
to LMDZiso. The LMDZiso nudged simulation offers the possibility of comparing the modeled day-to-day variabil-ity with the Bomi and Lhasa data between January and December 2008 (Fig. 9). At the event scale, LMDZisoctrl
strongly overestimates the magnitude of the Bomi and Lhasa precipitation amounts and simulates systematically too high d18O values, with very weak seasonal amplitude. The model does not capture the high spring d18O values and the magnitude of summer depletion. LMDZisohr
dramatically improves the event simulation of pre-cipitation and prepre-cipitation d18O with correlation co-efficients of 0.3 and 0.71 (p , 0.0001), respectively, which are much higher than those from LMDZisoctrl(0.09 for
precipitation amount and 0.34 for precipitation d18O, p , 0.0001). The zoomed simulation reproduces the observed seasonal magnitudes with spring high d18O and summer low d18O values (Figs. 9b and 9f). Although the zoomed
model overestimates the precipitation amount in spring and autumn, the simulation reproduced heavy precipi-tation events at Bomi; while the magnitude of the heavy precipitation is not reproduced and LMDZisohrsimulates
too much precipitation during the spring and autumn. The zoomed model still cannot capture the exact sea-sonal amplitude of temperature, underestimating its range by more than 18C (Figs. 9a and 9e). The zoomed d excess does not capture the pattern of observed d-excess
variation, especially in spring, and underestimates the magnitude of the d-excess fluctuations.
The lack of model d18O depletion in LMDZiso ctrl
during summer is unlikely to be linked with interannual variability, which is very small in LMDZ outputs, and is further supported by the comparison of LMDZ with the longer Lhasa records. The lack of summer–autumn de-pletion and d-excess seasonality can be linked to different processes, such as the model condensation processes, or the model moisture source and transport.
5. Conclusions
The local climate, together with the origin and trans-port of moisture and precipitation processes, are crucial factors that affect the spatial and temporal variabilities of stable isotopes in precipitation. In this paper, we have shown new results from two stations along the south-eastern Tibetan Plateau, at Bomi and Lhasa, where precipitation sampling was achieved on an event basis. The links with local precipitation and temperature have been analyzed at the event and on a monthly basis and these show rather consistent results. The complex sea-sonal cycle of precipitation d18O in this area cannot be understood without taking into account airmass trajecto-ries, which we did using backward trajectories calculated FIG. 9. Daily variabilities of (a),(e) temperature, (b),(f) d18O in precipitation, (c),(g) precipitation amount, and (d) d excess for the
from the LMDZ model. Episodic winter precipitation events mostly arise from the westerlies. During the sum-mer, the monsoon produces the lowest d18O values both at Bomi and Lhasa. In spring, different moisture transports result in differences in precipitation d18O at Bomi and Lhasa. Similarities between Bomi and Lhasa are observed in summer and point to the advection of monsoon flow from Bomi to Lhasa along the Brahmaputra River valley, a regional flow pattern that cannot be resolved by low-resolution AGCMs.
Our study has shown that the amount effect is ob-served with the monsoon’s onset, which relates high precipitation amounts with strongly depleted d18O, and explained the links between shifts in moisture origin and southern Tibetan d18O values, in particular the highest d18O levels in spring and the most depleted levels in summer. Further quantitative understand could be in-vestigated in simulations including the tagging of mois-ture sources (Delaygue et al. 2000; Masson-Delmotte et al. 2008).
The available observations now enable systematic comparisons with isotopic AGCMs regarding the isotopic variability along precipitation events, spatial patterns, and seasonal cycles. Both LMDZisoctrland ECHAMiso
share common biases in this complex Tibetan Plateau region, notably deficient precipitation at low latitudes and too-wet and too-cold conditions on the Tibetan Pla-teau. They generally simulate stronger correlations of d18O with precipitation and temperature than are ob-served [something that has been obob-served before; Hoffmann et al. (2005)], and underestimate the variabil-ity of d18O at seasonal and event scales. In particular, LMDZisoctrl underestimates the seasonal amplitude of
d18O in the southern Tibetan Plateau, probably in re-lationship to the upstream processes and a dominant westerly flow; while generally improving the simulated precipitation amount, the nudging enhances the model cold bias. Nudging ECHAM amplifies the difference in the precipitation amounts at Bomi and Lhasa, but it is effective at producing realistic simulated d18O results in precipitation in our study region. In winter, both models overestimate the effects of temperature and precipitation on d18O. In summer, both models underestimated the amount effects, especially at Mumbai and Shilong, where they are too dry. In general, ECHAM performs better than LMDZiso on the regional climate and precipitation isotopic composition. The model bias however remains significant, typically less than 4& for ECHAM but reaching 10& for LMDZiso. Although ECHAM is able to simulate reasonably well the amount effect and the spatial distribution of the precipitation d18O, it still fails to capture the southern Tibetan plateau d18O seasonal cycle and winter values.
The LMDZisohrversion makes simulations more
re-alistic thanks to an improved representation of regional topography. Although it is too wet at Shilong, the Tibetan precipitation is much closer to the observations. The simulation of daily and monthly precipitation d18O is more reasonable and shows realistic seasonal variations. The improved spatial resolution is therefore crucial for correct simulations of Tibetan Plateau precipitation and d18O.
The overall simulated d18O versus elevation gradient is within the range of observations, although it is under-estimated in winter and at low elevations. Both LMDZctrl
and ECHAM show wet and cold biases between 2000 and 4500 m. At high altitudes, models simulate steeper-elevation d18O than is observed. Because of changing d18O-elevation slopes with altitude, we are suspicious of the reliability of estimating the paleo-elevation based on the oxygen isotopic composition of precipitation.
This study shows the potential of Tibetan Plateau precipitation isotopic composition databases for testing the realism of the water cycle simulated by isotopic AGCMs and the importance of spatial resolution for re-alistic simulations. There is a strong need to maintain long-term observations at the monthly time frame, to improve the spatial coverage of the datasets, and to de-velop event-based studies that are necessary to better understand the exact processes at play, including, in the future, the parallel monitoring of water vapor isotopic composition. Our comparison with two AGCMs shows very large systematic biases in the AGCMs regarding both the regional climate and the properties of water stable isotopes in precipitation. The complex topographic features add to the difficulties in correctly simulating moisture advection from the lowlands to the Tibetan Plateau. Second-order isotopic data such as deuterium excess and oxygen 17 are expected to bring further con-straints on the water cycle, moisture origin, local recy-cling, and convective processes. However, models that can correctly capture these second-order tracers remain a future research effort due to the large biases in second-order isotopic data, which are probably linked to land surface, convection, and cloud representations. Nudging does not resolve these parameterization problems but helps to build a framework within which the synoptic-scale atmospheric dynamics is realistic.
While isotopic AGCMs have previously been used to assess the stability of the isotope–climate relationships at polar locations, there is still much to be done before they can be used with confidence for improving paleo-climate reconstructions conducted with water stable isotopes in the Tibetan Plateau area or for providing constraints on paleo-elevation. Systematic comparisons between isotopic AGCMs should be expanded to other
models than the two AGCMs explored here. The major model–data mismatches shown here are also strong limi-tations for confidently forecasting the regional impacts of increasing greenhouse gas concentrations. This is particu-larly frustrating when considering the societal importance of the southern Tibetan Plateau and its glaciers, which serve as a ‘‘water tower’’ for some of the world’s largest rivers and provide water to many surrounding countries.
Acknowledgments. We thank Sandrine Bony for her contribution in the development of the LMDZiso model and fruitful discussions, Yang Wei for the initial field work, and Francoise Vimeux for her constructive comments. We also thank Sonia Falourd and Be´ne´dicte Minster for their help with isotopic measurements. This work is supported by the GIS Pluies-Tibet, the French Embassy in China, the National Natural Science Foundation of China (Grants 40830638 and 40810019001), the External Cooperation Program of the Chinese Academy of Sciences (Grant GJHZ0960) and the CAS/SAFEA International Partner-ship Program for Creative Research Teams. Special thanks are given to anonymous reviewers for very helpful sug-gestions. Our thanks are also given to all those involved with precipitation sample collection.
REFERENCES
Aizen, V. B., E. M. Aizen, D. R. Joswiak, K. Fujita, N. Takeuchi, and S. A. Nikitin, 2006: Climatic and atmospheric circulation pattern variability from ice-core isotope/geochemistry records (Altai, Tien Shan and Tibet). Ann. Glaciol., 43, 49–60. Araguas-Araguas, L., K. Froehlich, and K. Rozanski, 1998: Stable
isotope composition of precipitation over Southeast Asia. J. Geophys. Res., 103 (D22), 28 721–28 742.
Bony, S., and K. A. Emanuel, 2001: A parameterization of the cloudiness associated with cumulus convection: Evaluation using TOGA COARE data. J. Atmos. Sci., 58, 3158–3183. ——, C. Risi, and F. Vimeux, 2008: Influence of convective
pro-cesses on the isotopic composition (delta O-18 and delta D) of precipitation and water vapor in the tropics: 1. Radiative-convective equilibrium and Tropical Ocean-Global Atmo-sphere-Coupled Ocean–Atmosphere Response Experiment (TOGA-COARE) simulations. J. Geophys. Res., 113, D19305, doi:10.1029/2008JD009942.
Chow, K. C., and J. C. L. Chan, 2009: Diurnal variations of circu-lation and precipitation in the vicinity of the Tibetan Plateau in early summer. Climate Dyn., 32, 55–73.
Ciais, P., and J. Jouzel, 1994: Deuterium and oxygen 18 in pre-cipitation: A new isotopic model including mixed cloud pro-cesses. J. Geophys. Res., 99, 16 793–16 803.
Clark, I., and P. Fritz, 1997: Environmental Isotopes in Hydro-geology. CRC, 328 pp.
Codron, F., and R. Sadourny, 2002: Saturation limiters for water vapour advection schemes: Impact on orographic precipitation. Tellus, 54A, 338–349, doi:10.1034/j.1600-0870.2002.01265.x. Coindreau, O., F. Hourdin, M. Haeffelin, A. Mathieu, and C. Rio,
2007: Assessment of physical parameterizations using a global
climate model with stretchable grid and nudging. Mon. Wea. Rev., 135, 1474–1489.
Dansgaard, W., 1964: Stable isotopes in precipitation. Tellus, 16, 436–468.
Delaygue, G., V. Masson, J. Jouzel, and R. D. Koster, 2000: The origin of Antarctic precipitation: A modelling approach. Tel-lus, 52B, 19–36.
Emanuel, K. A., 1991: A scheme for representing cumulus con-vection in large-scale models. J. Atmos. Sci., 48, 2313–2329. ——, and M. Zivkovic-Rothman, 1999: Development and
evalua-tion of a convecevalua-tion scheme for use in climate models. J. At-mos. Sci., 56, 1766–1782.
Galewsky, J., and J. V. Hurley, 2010: An advection–condensation model for subtropical water vapor isotopic ratios. J. Geophys. Res., 115, D16116, doi:10.1029/2009JD013651.
Gao, D., H. Zou, and W. Wei, 1985: Influence of water vapor pass along the Yalungzangbo River on precipitation (in Chinese with English abstract). Meteor. Res., 3, 239–249.
Gates, W. L., 1992: AMIP: The Atmospheric Model Intercom-parison Project. Bull. Amer. Meteor. Soc., 73, 1962–1970. Gupta, S. K., R. D. Deshpande, S. K. Bhattacharya, and R. A. Jani,
2005: Groundwater delta O-18 and D-delta from central Indian Peninsula: Influence of the Arabian Sea and the Bay of Bengal branches of the summer monsoon. J. Hydrol., 303, 38–55. Hoffmann, G., and M. Heimann, 1997: Water isotope modeling in
the Asian monsoon region. Quat. Int., 37, 115–128, doi:10.1016/ 1040-6182(96)00004-3.
——, M. Werner, and M. Heimann, 1998: Water isotope module of the ECHAM atmospheric general circulation model: A study on timescales from days to several years. J. Geophys. Res., 103 (D18), 16 871–16 896.
——, J. Jouzel, and V. Masson, 2000: Stable water isotopes in at-mospheric general circulation models. Hydrol. Processes, 14, 1385–1406.
——, M. Cuntz, M. Werner, and J. Jouzel, 2005: How much climate information is in the water isotopes?: A systematic comparison between the IAEA/GNIP isotope network and atmospheric gen-eral circulation models. Isotopes in the Water Cycle: Past, Present and Future of a Developing Science, P. K. Aggrawal, J. R. Gat, and K. F. O. Froehlich, Eds., Int. Atomic Energy Agency, 303–320. Hou, S. G., V. Masson-Delmotte, D. Qin, and J. Jouzel, 2003:
Modern precipitation stable isotope vs. elevation gradients in the High Himalaya. Comment on ‘‘A new approach to stable isotope-based paleoaltimetry: Implications for paleoaltimetry and paleohypsometry of the High Himalaya since the Late Miocene’’ by David B. Rowley et al. [Earth Planet. Sci. Lett., 188(2001) 253-268]. Earth Planet. Sci. Lett., 209, 395–399. Hourdin, F., and Coauthors, 2006: The LMDZ4 general circulation
model: Climate performance and sensitivity to parameterized physics with emphasis on tropical convection. Climate Dyn., 27, 787–813.
Hurrell, J. W., and K. E. Trenberth, 1999: Global sea surface temperature and analyses: Multiple problems and their im-plications for climate analysis, modeling, and reanalysis. Bull. Amer. Meteor. Soc., 80, 2661–2678.
Joussaume, S., R. Sadourny, and J. Jouzel, 1984: A general-circulation model of water isotope cycles in the atmosphere. Nature, 311, 24–29.
Jouzel, J., and L. Merlivat, 1984: Deuterium and O-18 in precipitation— Modeling of the isotopic effects during snow formation. J. Geo-phys. Res., 89 (D7), 1749–1757.
——, G. L. Russell, R. J. Suozzo, R. D. Koster, J. W. C. White, and W. S. Broecker, 1987: Simulations of the HDO and H2O-18 atmospheric
cycles using the NASA GISS general-circulation model—The seasonal cycle for present-day conditions. J. Geophys. Res., 92 (D12), 14 739–14 760.
——, and Coauthors, 1994: Stable water isotope behavior during the Last Glacial Maximum: A general circulation model analysis. J. Geophys. Res., 99, 25 791–25 801.
——, and Coauthors, 1997: Validity of the temperature re-construction from water isotopes in ice cores. J. Geophys. Res., 102 (C12), 26 471–26 487.
——, G. Hoffmann, R. D. Koster, and V. Masson, 2000: Water isotopes in precipitation: Data/model comparison for present-day and past climates. Quat. Sci. Rev., 19, 363–379.
Kripalani, R. H., J. H. Oh, and H. S. Chaudhari, 2007a: Response of the East Asian summer monsoon to doubled atmospheric CO2: Coupled climate model simulations and projections
un-der IPCC AR4. Theor. Appl. Climatol., 87, 1–28.
——, ——, A. Kulkarni, S. S. Sabade, and H. S. Chaudhari, 2007b: South Asian summer monsoon precipitation variability: Coupled climate model simulations and projections under IPCC AR4. Theor. Appl. Climatol., 90, 133–159.
Kurita, N., and H. Yamada, 2008: The role of local moisture re-cycling evaluated using stable isotope data from over the middle of the Tibetan Plateau during the monsoon season. J. Hydrometeor., 9, 760–775.
Lee, J., I. Fung, D. J. DePaolo, and C. C. Henning, 2007: Analysis of the global distribution of water isotopes using the NCAR atmospheric general circulation model. J. Geophys. Res., 112, D16306, doi:10.1029/2006JD007657.
LeGrande, A. N., and G. A. Schmidt, 2009: Sources of Holocene variability of oxygen isotopes in paleoclimate archives. Cli-mate Past, 5, 441–455.
Lin, Z., and X. Wu, 1990: A preliminary analysis about the tracks of moisture transportation on the Qinghai–Xizang Plateau (in Chinese with English abstract). Geogr. Res., 9, 30–49. Liu, Z. F., L. Tian, T. D. Yao, and W. S. Yu, 2008: Seasonal
deu-terium excess in Nagqu precipitation: Influence of moisture transport and recycling in the middle of Tibetan Plateau. Environ. Geol., 55, 1501–1506.
Masson-Delmotte, V., and Coauthors, 2008: A review of Antarctic surface snow isotopic composition: Observations, atmospheric circulation, and isotopic modeling. J. Climate, 21, 3359–3387. Mathieu, R., D. Pollard, J. E. Cole, J. W. C. White, R. S. Webb, and
S. L. Thompson, 2002: Simulation of stable water isotope variations by the GENESIS GCM for modern conditions. J. Geophys. Res., 107, D4, doi:10.1029/2001JD900255. Merlivat, L., and J. Jouzel, 1979: Global climate interpretation
of the deuterium–oxygen 18 relationship for precipitation. J. Geophys. Res., 84, 5029–5033.
Nguyen, K. C., and J. L. McGregor, 2009: Modelling the Asian summer monsoon using CCAM. Climate Dyn., 32, 219–236. Noone, D., and I. Simmonds, 2002: Associations between d18O of
water and climate parameters in a simulation of atmospheric circulation for 1979–95. J. Climate, 15, 3150–3169.
Ramstein, G., F. Fluteau, J. Besse, and S. Joussaume, 1997: Effect of orogeny, plate motion and land sea distribution on Eurasian climate change over the past 30 million years. Nature, 386, 788–795.
Rasch, P. J., and D. L. Williamson, 1990: Computational aspects of moisture transport in global-models of the atmosphere. Quart. J. Roy. Meteor. Soc., 116, 1071–1090.
Risi, C., S. Bony, F. Vimeux, and J. Jouzel, 2010: Water stable isotopes in the LMDZ4 general circulation model: Model evaluation for present day and past climates and applications
to climatic interpretation of tropical isotopic records. J. Geo-phys. Res., 115, D12118, doi:10.1029/2009JD013255. Roeckner, E., and Coauthors, 1996: The atmospheric general
circulation model ECHAM-4: Model description and simu-lation of present-day climate. Max Planck Institute for Me-teorology Tech. Rep. 218, 90 pp.
Rozanski, K., L. Araguas-Araguas, and R. Gonfiantini, 1992: Re-lation between long-term trends of oxygen-18 isotope com-position of precipitation and climate. Science, 258, 981–985. Schmidt, G. A., A. N. LeGrande, and G. Hoffmann, 2007: Water
isotope expressions of intrinsic and forced variability in a coupled ocean–atmosphere model. J. Geophys. Res., 112, D10103, doi:10.1029/2006JD007781.
Sengupta, S., and A. Sarkar, 2006: Stable isotope evidence of dual (Arabian Sea and Bay of Bengal) vapour sources in mon-soonal precipitation over north India. Earth Planet. Sci. Lett., 250, 511–521.
Shi, X. Y., Y. Q. Wang, and X. D. Xu, 2008: Effect of mesoscale topography over the Tibetan Plateau on summer precipitation in China: A regional model study. Geophys. Res. Lett., 35, L19707, doi:10.1029/2008GL034740.
Stewart, M. K., 1975: Stable isotope fractionation due to evapo-ration and isotopic exchange of falling waterdrops: Applica-tions to atmospheric processes and evaporation of lakes. J. Geophys. Res., 80, 1133–1146.
Thompson, L. G., T. Yao, E. Mosley-Thompson, M. E. Davis, K. A. Henderson, and P. N. Lin, 2000: A high-resolution millennial record of the South Asian monsoon from Himalayan ice cores. Science, 289, 1916–1919.
Tian, L., V. Masson-Delmotte, M. Stievenard, T. Yao, and J. Jouzel, 2001: Tibetan Plateau summer monsoon northward extent revealed by measurements of water stable isotopes. J. Geophys. Res., 106 (D22), 28 081–28 088.
——, T. Yao, P. F. Schuster, J. W. C. White, K. Ichiyanagi, E. Pendall, J. Pu, and Y. Wu, 2003: Oxygen-18 concentrations in recent precipitation and ice cores on the Tibetan Plateau. J. Geophys. Res., 108, 4293, doi:10.1029/2002JD002173. ——, ——, K. MacClune, J. W. C. White, A. Schilla, B. Vaughn,
R. Vachon, and K. Ichiyanagi, 2007: Stable isotopic variations in west China: A consideration of moisture sources. J. Geo-phys. Res., 112, D10112, doi:10.1029/2006JD007718. ——, L. L. Ma, W. S. Yu, Z. F. Liu, C. L. Yin, Z. P. Zhao, W. Tang,
and Y. Wang, 2008: Seasonal variations of stable isotope in precipitation and moisture transport at Yushu, eastern Ti-betan Plateau. Earth Sci., 51, 1121–1128.
Tindall, J. C., P. J. Valdes, and L. C. Sime, 2009: Stable water isotopes in HadCM3: Isotopic signature of El Nin˜o–Southern Oscillation and the tropical amount effect. J. Geophys. Res., 114, D04111, doi:10.1029/2008JD010825.
Uppala, S. M., and Coauthors, 2005: The ERA-40 Re-Analysis. Quart. J. Roy. Meteor. Soc., 131, 2961–3012.
Van Leer, B., 1977: Towards ultimate conservative difference scheme: IV. A new approach to numerical convection. J. Comput. Phys., 23, 276–299.
Vuille, M., M. Werner, R. S. Bradley, and F. Keimig, 2005: Stable isotopes in precipitation in the Asian monsoon region. J. Geo-phys. Res., 110, D23108, doi:10.1029/2005JD006022.
Worden, J., D. Noone, and K. Bowman, 2007: Importance of rain evaporation and continental convection in the tropical water cycle. Nature, 445, 528–532.
Xin, X., Z. Li, R. Yu, and T. Zhou, 2008: Impacts of upper tropo-spheric cooling upon the late spring drought in East Asia simu-lated by a regional climate model. Adv. Atmos. Sci., 25, 555–562.
Xu, B. Q., and Coauthors, 2009: Black soot and the survival of Ti-betan glaciers. Proc. Natl. Acad. Sci. USA, 106, 22 114–22 118. Yao, T. D., Y. Q. Liu, S. C. Kang, N. Z. Jiao, Y. H. Zeng, X. B. Liu, and Y. J. Zhang, 2008: Bacteria variabilities in a Tibetan ice core and their relations with climate change. Global Bio-geochem. Cycles, 22, GB4017, doi:10.1029/2007GB003140. Yoshimura, K., T. Oki, N. Ohte, and S. Kanae, 2003: A quantitative
analysis of short-term O-18 variability with a Rayleigh-type isotope circulation model. J. Geophys. Res., 108, 4647, doi:10. 1029/2003JD003477.
——, M. Kanamitsu, D. Noone, and T. Oki, 2008: Historical iso-tope simulation using reanalysis atmospheric data. J. Geophys. Res., 113, D19108, doi:10.1029/2008JD010074.
Yu, W. S., T. D. Yao, L. Tian, Y. M. Ma, K. P. Ichlyanagi, Y. Wang, and W. Z. Sun, 2008: Relationships between delta O-18 in precipitation and air temperature and moisture origin on a south–north transect of the Tibetan Plateau. Atmos. Res., 87, 158–169.
Yurtsever, Y., and J. Gat, 1981: Atmospheric waters. Stable Isotope Hydrology: Deuterium and Oxygen-18 in the Water Cycle, J. R. Gat and R. Gonfiantini, Eds., International Atomic Energy Agency Tech. Rep. Series, Vol. 210, 103–142.
Zhang, X. P., J. M. Liu, Y. Q. He, L. D. Tian, and T. D. Yao, 2005: Humidity effect and its influence on the seasonal distribution of precipitation delta O-18 in monsoon regions. Adv. Atmos. Sci., 22, 271–277.