HAL Id: hal-00295994
https://hal.archives-ouvertes.fr/hal-00295994
Submitted on 31 Jul 2006
HAL is a multi-disciplinary open access
archive for the deposit and dissemination of
sci-entific research documents, whether they are
pub-lished or not. The documents may come from
teaching and research institutions in France or
abroad, or from public or private research centers.
L’archive ouverte pluridisciplinaire HAL, est
destinée au dépôt et à la diffusion de documents
scientifiques de niveau recherche, publiés ou non,
émanant des établissements d’enseignement et de
recherche français ou étrangers, des laboratoires
publics ou privés.
MIPAS-E satellite measurements in winter 2002/2003
S. Davies, G. W. Mann, K. S. Carslaw, M. P. Chipperfield, J. J. Remedios, G.
Allen, A. M. Waterfall, R. Spang, G. C. Toon
To cite this version:
S. Davies, G. W. Mann, K. S. Carslaw, M. P. Chipperfield, J. J. Remedios, et al.. Testing our
understanding of Arctic denitrification using MIPAS-E satellite measurements in winter 2002/2003.
Atmospheric Chemistry and Physics, European Geosciences Union, 2006, 6 (10), pp.3149-3161.
�hal-00295994�
www.atmos-chem-phys.net/6/3149/2006/ © Author(s) 2006. This work is licensed under a Creative Commons License.
Chemistry
and Physics
Testing our understanding of Arctic denitrification using MIPAS-E
satellite measurements in winter 2002/2003
S. Davies1, G. W. Mann1, K. S. Carslaw1, M. P. Chipperfield1, J. J. Remedios2, G. Allen3, A. M. Waterfall4, R. Spang5, and G. C. Toon6
1Institute for Atmospheric Science, School of Earth and Environment, University of Leeds, UK
2Earth Observation Science, Space Research Centre, University of Leicester, UK
3School of Earth, Atmospheric and Atmospheric Sciences, University of Manchester, UK
4Rutherford Appleton Laboratory, Chilton, Didcot, UK
5Institut 1: Stratosphare: Forschungszentrum Juelich, 52 425, Juelich, Germany
6Jet Propulsion Laboratory, California Institute of Technology, Pasadena, California, USA
Received: 22 August 2005 – Published in Atmos. Chem. Phys. Discuss.: 1 November 2005 Revised: 13 June 2006 – Accepted: 21 July 2006 – Published: 31 July 2006
Abstract. Observations of gas-phase HNO3 and N2O in
the polar stratosphere from the Michelson Interferometer for Passive Atmospheric Sounding aboard the ENVISAT satel-lite (MIPAS-E) were made during the cold Arctic winter of 2002/2003. Vortex temperatures were unusually low in early winter and remained favourable for polar stratospheric cloud formation and denitrification until mid-January. MIPAS-E observations provide the first dataset with sufficient coverage of the polar vortex in mid-winter which enables a reason-able estimate of the timing of onset and spatial distribution of denitrification of the Arctic lower stratosphere to be per-formed. We use the observations from MIPAS-E to test the evolution of denitrification in the DLAPSE (Denitrification by Lagrangian Particle Sedimentation) microphysical deni-trification model coupled to the SLIMCAT chemical trans-port model. In addition, the predicted denitrification from a simple equilibrium nitric acid trihydrate-based scheme is also compared with MIPAS-E. Modelled denitrification is
compared with in-vortex NOy and N2O observations from
the balloon-borne MarkIV interferometer in mid-December. Denitrification was clearly observed by MIPAS-E in mid-December 2002 and reached 80% in the core of the vortex by early January 2003. The DLAPSE model is broadly able to capture both the timing of onset and the spatial distribution of the observed denitrification. A simple thermodynamic equi-librium scheme is able to reproduce the observed denitrifica-tion in the core of the vortex but overestimates denitrificadenitrifica-tion closer to the vortex edge. This study also suggests that the onset of denitrification in simple thermodynamic schemes may be earlier than in the MIPAS-E observations.
Correspondence to: S. Davies
1 Introduction
The severity of seasonal halogen-catalysed ozone loss in the Arctic lower stratosphere is dependent on the prevailing meteorology. Sustained low temperatures are well known to promote the heterogeneous activation of halogen reser-voirs via polar stratospheric clouds (PSCs). The predomi-nant mechanism for the reverse process of sequestration of
ozone-depleting active chlorine (ClOx=ClO + 2 × Cl2O2) in
the Arctic is via reaction with NO2to form ClONO2. Hence
a key aspect of activation balance is the availability of nitro-gen species. Denitrification is the irreversible loss of total
reactive nitrogen (NOy=N + NO + NO2+NO3+2N2O5
+HNO3+ClONO2 + minor species) from an airmass by
the gravitational sedimentation of NOy-containing particles.
However, HNO3 is the main source of NO2 in the Arctic
springtime vortex, produced either by photolysis or reaction with OH, and its concentration is therefore particularly im-portant. Several CTM studies have shown that denitrifica-tion in mid-winter can increase springtime Arctic ozone loss
by reducing HNO3concentrations in the lower stratosphere,
thus reducing the rate of ClOxdeactivation and extending the
ozone loss period (e.g. Chipperfield and Pyle, 1998; Waibel et al., 1999; Tabazadeh et al., 2000; Davies et al., 2002).
Moderate denitrification of the Arctic lower stratosphere has been observed in many cold winters of the late 1980s and 1990s (e.g. Fahey et al., 1990; Sugita et al., 1998; Kondo
et al., 2000; Santee et al., 2000). In situ NOy
observa-tions from the NASA ER-2 during the cold Arctic winter of 1999/2000 revealed denitrification of an unprecedented mag-nitude (Popp et al., 2001). In addition to extensive denitrifi-cation, ER-2 flights in January and February 2000 revealed the presence of very large nitric acid trihydrate (NAT) par-ticles (up to 20 µm diameter) with very low concentrations
(in the range 10−5to 10−3cm−3) in the Arctic lower strato-sphere (Fahey et al., 2001). Subsequent modelling studies have indicated that the sedimentation of these large NAT particles was capable of causing denitrification comparable to that observed (Carslaw et al., 2002; Drdla et al., 2002). Mann et al. (2003) used the microphysical DLAPSE model to demonstrate that this mechanism may have caused den-itrification in a number of other cold Arctic winters of the 1990s.
Davies et al. (2005) extended the work of Mann et al. (2003) by comparing the DLAPSE model against a wide range of observations from three Arctic winters (1999/2000, 1996/97 and 1994/95). They obtained good agreement by assuming a constant volume-average NAT nucleation rate. In two of these winters (1999/2000 and 1996/97), both the magnitude and spatial distribution of observed denitrification were reproduced by the model, within the constraints of the observations, when a particle nucleation rate derived from observed ER-2 NAT particle size distributions on 20 January 2000 (Northway et al., 2002) was used. However, it was not possible to deduce the onset of denitrification from ob-servations in these winters. In the 1999/2000 Arctic winter, denitrification occurred between the deployment phases of the SOLVE/THESEO 2000 campaign (Newman et al., 2002) and was essentially complete by the time of the first ER-2 flight (Davies et al., 2005). In 1996/97, the Improved Limb Atmospheric Spectrometer (ILAS) satellite-borne instrument
observed HNO3and N2O during the onset of the low
temper-atures required for PSC formation and for potential denitri-fication (Kondo et al., 2000). However, the solar occultation technique used by ILAS restricted coverage in 1996/97 to a maximum of 14 northern hemisphere profiles per day in a
narrow latitude band (∼67◦N in February). The restricted
view from ILAS means that the timing of denitrification in-ferred by ILAS measurements is likely to be controlled by a combination of denitrification and subsequent advection of denitrified airmasses to the ILAS occultation points (Davies et al., 2005).
Observations of nitric acid (but not N2O) with greater
spa-tial coverage but lower vertical resolution have been per-formed for a large number of years by the Microwave Limb Sounder (MLS) on the Upper Atmosphere Research Satel-lite (UARS). Santee et al. (1995) showed that the Antarctic experienced severe denitrification during the winter of 1992
whereas a similar decrease in HNO3did not occur over the
Arctic during the 1992/93 Arctic winter. Subsequent MLS observations for the 5 following Arctic and Antarctic win-ters demonstrated similar results (Santee et al., 1999). How-ever, coverage is limited to 80 degrees in each hemisphere but in alternate yaw periods only (∼35 days). Furthermore, the MLS data are limited by their precision, and the lack of coincident PSC and tracer information in most years. Most studies, e.g. Santee et al. (1999) have concentrated on the
study of representative climatologies for HNO3and other
re-trieved species.
Therefore, observations of HNO3within the Arctic polar
vortex in winters prior to 2002/2003 have been insufficient to accurately determine the timing of onset, the rate of pro-gression and the spatial distribution of denitrification. These quantities are the key to confirming that the denitrification mechanism is realistically treated in large-scale models such as DLAPSE. For example, the onset of denitrification will differ between a model that assumes an ice or NAT-mediated mechanism. In addition, Mann et al. (2002, 2003) proposed that the duration that the vortex is near-concentric with the region of potential NAT formation controls the extent of den-itrification by large NAT particles. They suggested that under some conditions denitrification can cease even when large re-gions of NAT exist. Such an effect might be detectable by examining the onset of denitrification in relation to the me-teorological situation. Mann et al. (2002) also showed that denitrification by low concentrations of NAT would leave the vortex edge region weakly denitrified when compared with the core of the vortex. High-frequency, high spatial
resolu-tion observaresolu-tions of HNO3/NOy and N2O inside the polar
vortex are required to address these issues.
The Michelson Interferometer for Passive Atmospheric Sounding on ENVISAT (MIPAS-E) provides, for Arctic win-ter 2002/2003, an excellent opportunity to study the issues identified above for denitrification. As described in Spang et al. (2005a), MIPAS-E provides daily observations with coverage of the vortex to the poles due to ENVISAT’s sun
synchronous orbit and adjustable line-of-sight views. In
this paper, we use observations of HNO3 and N2O from
MIPAS-E during the cold Arctic winter of 2002/3 to exam-ine the onset and spatial distribution of denitrification and test the DLAPSE/SLIMCAT model. Comparisons are also
made with the vertical distribution of NOyfrom the in-vortex
MarkIV balloon flight in mid-December 2002. DLAPSE has a full microphysical treatment of NAT particle growth and sedimentation on a vortex-wide scale as described in Davies et al. (2005) and used by Mann et al. (2002). We also use the MIPAS-E observations to test whether the observed distribu-tion of denitrificadistribu-tion can be reproduced by a simple NAT equilibrium scheme, as used in many CTMs.
2 Description of the MIPAS-E instrument and model
2.1 The MIPAS-E instrument
MIPAS-E is a limb-scanning Fourier transform infra-red (FT-IR) spectrophotometer aboard the ENVISAT satellite. EN-VISAT orbits the Earth once every ∼100 min, resulting in
∼14 polar orbits per day. The IR emission from the Earth’s
atmosphere is sampled at 3 km intervals from 6 to 42 km (re-duced sampling above), corresponding to the field-of-view and the nominal vertical resolution of the operationally re-trieved data in the lower stratosphere.
All MIPAS-E data used in the comparisons presented are based on level 2 products (V4.53-5) from the near real-time data produced by the European Space Agencys (ESA)
op-erational processor. For HNO3 and N2O observations in
polar regions, it has been estimated that the random errors are <10% and <20% respectively whilst systematic errors are estimated to be <15% for each species (Oelhaf et al.,
2004; Camy-Peyret et al., 2004). Systematic errors in HNO3
have a negligible effect on this study which concerns the
rel-ative changes of HNO3; subsequent to V4.53 a change in
HNO3spectroscopy (Flaud et al., 2003) results in a
system-atic increase of 14% in MIPAS HNO3values. PSC particles
may impact on the retrievals of both these species, therefore a cloud detection index (CI) for MIPAS-E, as described in Spang et al. (2005a), is used to remove MIPAS-E data whose quality may be affected by the presence of PSCs. A CI-threshold of 2.0 at any altitude between 12 and 31 km in a retrieval is used to reject such profiles (Spang et al., 1997; Spang and Remedios, 2003). An additional constraint is
the removal of data for which substantial HNO3uptake into
PSCs may occur locally. We therefore restrict our analysis of MIPAS-E data to those profiles in which the
ECMWF-analysed temperature is greater than TNAT-2 K. Analysis of
the model data suggests that the mean uptake of HNO3into
PSCs at MIPAS-E tangent points within the region TNAT–
2 K<T<TNATis <0.7 ppbv with an upper limit to the
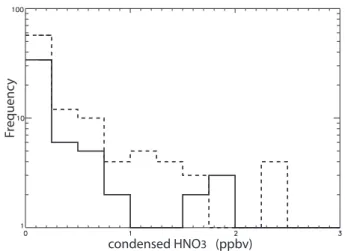
resid-ual local uptake of 2.5 ppbv at 465 K and 2 ppbv at 505 K (Fig. 1). These results are consistent with tests of the
de-pendence of the observed HNO3data as a function of cloud
index. In the model, condensed HNO3is present
predomi-nantly as NAT rather than locally-sequestered super-cooled
ternary solutions of HNO3, H2SO4and H2O (STS).
Furthermore, we have examined the dependence of HNO3
anomalies (relative to a tracer correlation from early Novem-ber) versus cloud index and find that for CI>2 there is no
ev-idence from the data for uptake of HNO3into PSCs greater
than ∼1 ppbv which is broadly consistent with the model. These upper limits to the uptake should be compared to the strength of the denitrification signal which is of the order of 8 ppbv or more in late December and early January. In con-trast, for CI<2.0, we find significant anomalies indicative of
uptake of HNO3.
2.2 The DLAPSE/SLIMCAT model
DLAPSE is a Lagrangian microphysical NAT particle model coupled to a full-chemistry version of the SLIMCAT CTM (Chipperfield, 1999). DLAPSE calculates the time depen-dent growth, advection and sedimentation of NAT particles and has been described in detail in Carslaw et al. (2002), Mann et al. (2003) and Davies et al. (2005). Changes in
gas phase HNO3 due to growth of NAT particles are
calcu-lated by DLAPSE and are applied to the HNO3field on the
SLIMCAT grid, which is then advected in an Eulerian man-ner along with the other gas phase species. Both DLAPSE
F
requenc
y
condensed HNO3 (ppbv)
Fig. 1. Histograms of model NAT-phase HNO3at MIPAS-E tangent points in the region TNAT–2 K<T<TNAT with CI>2.0 at 505 K (solid line) and 465 K (dashed line).
and SLIMCAT are forced using operational analyses from the European Centre for Medium-Range Weather Forecasts (ECMWF). NAT particles are nucleated at a fixed rate wher-ever the temperature is below the NAT equilibrium
tem-perature (TNAT) which is calculated from model H2O and
HNO3using Hanson and Mauersberger (1988). The uptake
of HNO3at low temperature into STS is also included in the
model (Carslaw et al., 1995). Temporary uptake of HNO3
by STS reduces the amount of gas-phase HNO3available for
NAT particle growth.
For this study, the SLIMCAT resolution was 2.8◦
lon-gitude × 2.8◦ latitude × 36 isentropic levels. In the lower
stratosphere, the model isentropic levels were spaced at 10 K potential temperature intervals, corresponding to a vertical resolution of around 400 m. The SLIMCAT stratospheric chemistry scheme contains 41 species and ∼120 chemical reactions, including heterogeneous reactions on STS, using data from Sander et al. (2000). Model tracers were initialised using values from a SLIMCAT multi-annual run (Chipper-field, 1999) on 7 November 2002, well before the onset of temperatures low enough to allow the formation of PSCs. To more accurately match the initial observed nitric acid field,
the initial model HNO3field was replaced by that observed
by the MIPAS-E instrument on that day. For this purpose,
the MIPAS-E observations were averaged onto a 20◦ by 5◦
longitude-latitude grid and then interpolated onto the model grid. An advantage of this approach is that the initialisation
with MIPAS-E HNO3implies that later comparisons are not
sensitive to systematic errors in these observations. In ef-fect, it is the relative change in MIPAS-E observations that are tested against the model denitrification.
Table 1. Model sensitivity experiments. * indicates calculated by microphysical model. Simulation M0 M1 M2 E1 E2 Nucleation rate 0.0 0.8 3.2 – – (10−9cm−3s−1) Fall velocity (ms−1) * * * 0.005 0.001 Equivalent radius (µm) * * * 3.0 1.2 2.3 Model simulations
Three main simulations were undertaken: (M1) using
DLAPSE with a low nucleation rate of 8.0×10⁻¹⁰
parti-cles cm−3s−1; (M2) DLAPSE with a high nucleation rate
of 3.2×10⁻⁹ particles cm−3s−1; and (M0) a “passive” run
in which no NAT particles formed. The lower nucleation rate corresponds to that used in Mann et al. (2003), which was found by Davies (2003) to best fit nitric acid measure-ments aboard the ER-2 in winter 1999/2000. The higher nu-cleation run was found to better match denitrification profiles observed in the 1994/95 Arctic winter (Davies et al., 2005). Two further model runs (E1 and E2) were undertaken using an equilibrium denitrification scheme based on the sedimen-tation of large NAT particles within the SLIMCAT CTM.
Here, the equilibrium amount of condensed HNO3
deter-mined by Hanson and Mauersberger (1988) is sedimented with an assigned fall velocity. The fall velocities used for E1 and E2 were adjusted to produce denitrification values at 505 K in late-December which were approximately consis-tent with that provided by model runs M1 and M2 respec-tively. Note that the absolute denitrification is not what is being tested in this comparison, but only the spatial and tem-poral evolution. Table 1 summarises the model runs.
2.4 Determining and comparing observed MIPAS-E and
modelled DLAPSE denitrification
Having performed calculations of denitrification, when the model is compared to the MIPAS-E data, account must be taken of the fact that the MIPAS-E data available for this
study were HNO3 data, rather than NOy, and that the
re-trieval is actually an average over a finite vertical distance. Throughout the period of this study (December 2002 – early
January 2003), in-vortex NOywould be expected to be
com-posed almost entirely of HNO3 as heterogeneous
process-ing on PSCs would be expected to remove most of the
ClONO2and N2O5due to the widespread low temperatures
found within the vortex. In-vortex HNO3 photochemistry
would also be expected to be slow. In the model, HNO3
comprises more than 90% of the available NOy throughout
the December – January period with the remainder found
to be predominantly ClONO2 (∼1 ppbv). Other NOy
con-Day after Jan 1, 2003
HNO
3
/NO
y (ppb
v)
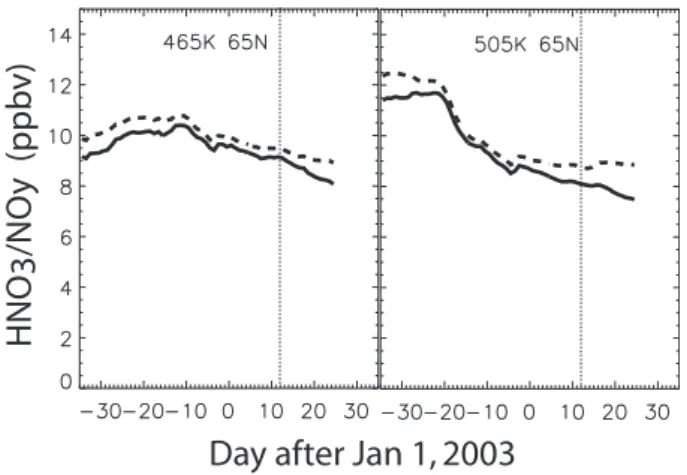
Fig. 2. Timeseries of modelled vortex mean HNO3(solid line) and NOy(dashed line) at 465 K and 505 K. The edge of the vortex is defined as 65◦N equivalent latitude.
Fig. 3. Profiles of HNO3 (solid line) and NOy (dashed line) from the MarkIV balloon flight of 16 December 2002. The error bars have been omitted for clarity and are conservatively <10% (∼0.5 ppbv) for the 400–600 K potential temperature range.
stituents are present at even lower abundances in the model
(NOx<0.3 ppbv and N2O5<0.1 ppbv) throughout this
pe-riod. Figure 2 shows the discrepancy between modelled
mean HNO3 and NOyat 465 and 505 K poleward of 65◦N
equivalent latitude to be ≤1 ppbv throughout the December and early January period.
Independent observations of NOypartitioning in the
mid-winter Arctic vortex are sparse. The single in-vortex MarkIV
balloon flight during this period demonstrates that HNO3is
an excellent proxy for NOybelow ∼570 K (Fig. 3). We have
restricted our analysis of MIPAS data to the period prior to
the vortex split in mid-January as our assumptions about NOy
partitioning are unlikely to be valid in a dynamically unstable vortex (Tsidu et al., 2005).
To determine an observed denitrification from the
of Popp et al. (2001) (derived for the 1999/2000 winter) to
infer the deviation of HNO3from the expected NOyvalue in
the absence of any denitrification (referred to as NO∗
y). The
modelled denitrification from DLAPSE is usually calculated
as the difference between the nitric acid (or NOy)
concen-tration in a DLAPSE run and the corresponding passive run where the denitrification in the model has been switched off. However, since the MIPAS-E ”denitrification” is defined as
HNO3-NO∗y, a proper comparison requires a matching
defini-tion of modelled DLAPSE “denitrificadefini-tion” as the difference
between the NOy concentration in the passive run and the
HNO3 concentration in the DLAPSE run. Throughout the
remainder of this article we refer to denitrification observed by MIPAS-E as:
HNO3−NO∗y, (1)
with NO∗
ydetermined from MIPAS-E N2O. The comparable
denitrification in the model is calculated as
HNO3−passiveNOy. (2)
MIPAS-E does not retrieve the concentration from a single point. Instead the value of the retrieval represents a weighted average of concentrations over the 3 km vertical resolution of the instrument. Since the denitrification process can pro-duce very steep vertical gradients, a direct comparison of the model with the observation at the retrieved potential temper-ature level is not appropriate. For a consistent comparison, the model denitrification profile must first have the observa-tion averaging kernel applied. The averaging kernel for the MIPAS-E instrument is described in Carli et al. (2004) and is defined on a 1 km altitude grid. In all comparisons between
MIPAS-E and DLAPSE, model profiles of HNO3and passive
NOyhave been first linearly interpolated onto the 1 km
alti-tude grid and then have had the MIPAS-E averaging kernel applied, leaving profiles on a 3 km altitude grid. These pro-files were then linearly interpolated onto the isentropic levels 425 K, 465 K, 505 K and 545 K. For the comparison on these levels, the MIPAS-E profiles were also linearly interpolated in potential temperature to give equivalent retrievals on these same potential temperatures surfaces.
3 Evolution of Arctic denitrification in 2002/2003
3.1 Vortex meteorology
The Arctic winter of 2002/2003 was colder than the clima-tological mean and characterised by an unusually early onset of temperatures sufficiently low for the existence of PSCs (Goutail et al., 2005). Spang et al. (2005b) report observa-tions of PSCs as early as 1 December 2002. Larsen et al. (2004) report balloon-borne observations of PSCs at Esrange
(67.9◦N, 21.1◦E) and Sodankyl¨a (67.4◦N, 26.6◦E) between
3 December and 7 December 2002. PSCs were first
ob-served at Ny ˚Alesund on 7 December 2002 although the
tro-650 550 450 350 650 550 450 350 650 550 450 350 -40 -20 0 20 40 60
Day after January 1, 2003
P ot ential Temper atur e (K) 14 12 10 8 6 4 2 0 40 20 0 -20 -40 1.4 1.2 1.0 0.8 0.6 0.4 0.2 0 106 km2
(a)
NAT area(b)
Normalised centroid separation(c)(
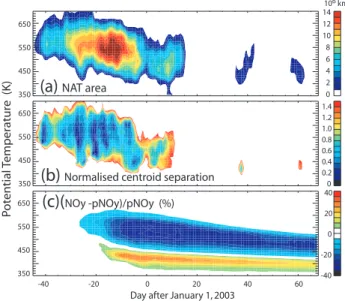
NOy -pNOy)/pNOy (%)Fig. 4. (a) Model calculated NAT area (106km2) based on ECMWF analyses and HNO3and H2O from model run M1; (b) Calculated normalised centroid separation (i.e. separation of the centroids of the polar vortex and NAT area, divided by NAT area); (c) Vortex mean NOy- passive NOyas a percentage of total passive NOyfrom run M1.
pospheric conditions were unsuitable for stratospheric view-ing earlier in the winter.
Larsen et al. (2004) report that “small areas with
temper-atures below the NAT existence temperature TNATstarted to
develop on the 550 K potential temperature surface in mid-November”. Figure 4a shows a time-potential temperature
section of the area with temperatures below TNAT(the NAT
area) using ECMWF analysed temperatures, model HNO3
and H2O and the expression of Hanson and Mauersberger
(1988). The NAT area developed in mid November and by
early December, the area of the vortex below TNAT
(here-after, the “cold pool”) had increased significantly to cover an
area of more than 107km2throughout the region 525–575 K
(see Fig. 4a). Figure 4b shows the separation of the centre of the vortex and the centre of the cold pool and is a mea-sure of the likely efficiency of denitrification (Mann et al., 2002). A value of zero indicates that the vortex and cold pool centres are co-located resulting in “cold closed flow”, which is conducive to long NAT particle growth times and denitrification by large NAT particles (Mann et al., 2003). A value of 1 indicates that the centre of the cold pool is offset by its radius from the vortex and air flows through the cold pool before warming. Such through-flow conditions result in relatively short intermittent particle growth insufficient to produce large NAT particles. The cold pool had significant areas in closed flow for much of December, resulting in sig-nificant denitrification by NAT being predicted by DLAPSE. Figure 4c shows the model diagnosed vortex mean percent denitrification. Denitrification occurred in DLAPSE from
-10 -8 -6 -4 -2 0 2 HNO3-NOy* (ppbv)
(a)
(b)
(c)
(d)
(e)
(f)
(g)
(h)
(i)
(j)
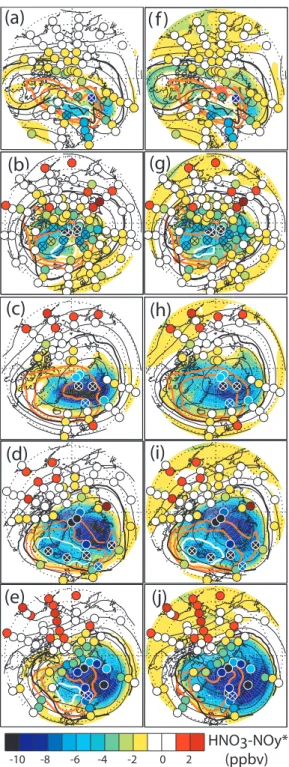
Fig. 5. Contour plot of model gas-phase HNO3– passive NOyfor M2 (a–e: left) and E2 (f–j: right) at 505 K on 5 days in 2002: 9, 13, 16, 19, 22 December. The magnitude of MIPAS-E HNO3–NO∗y is shown as filled circles. An X in a MIPAS-E observation indi-cates profiles where 2.0<CI<2.5 which may indicate the presence of PSCs (Spang et al., 2005a). Also shown are the 65◦N Equivalent Latitude contour (thick black line), TNATand TNAT–2 K (red lines), Montgomery streamfunction (thin black lines) and the region with >1 ppbv HNO3uptake to liquid aerosol (white contour).
early December, the timing being coincident with the time of maximum cold closed flow. According to the model, vortex mean denitrification reached a maximum of ∼35% at 520 K by 1 January 2003, after which the vortex warmed signifi-cantly.
In mid-January a sudden stratospheric warming increased temperatures above the threshold for PSC formation, displac-ing the vortex over central Europe. The polar vortex split on 20 January 2003 although the two vortex parts recombined a few days later. The recombined vortex cooled again in late January, by which time temperatures were infrequently low enough for the formation of PSCs. Further warmings oc-curred in mid February and early March. Sporadic PSCs were observed in February and March, usually associated with additional cooling from orographic temperature pertur-bations or tropospheric uplift (Naujokat and Grunow, 2003; Spang et al., 2005b). We restrict the analysis in this study to the period prior to the first warming in mid-January.
High resolution in situ NOy observations of the Arctic
lower stratosphere by the SIOUX instrument aboard the Geo-physica aircraft in January and February 2003 revealed sig-nificant renitrification between 400 and 440 K, together with evidence of moderately strong denitrification at higher alti-tudes (Grooß et al., 2005).
3.2 Evolution of model denitrification
Figure 5 compares the evolution of modelled and MIPAS-E observed denitrification, with the observations shown as over-plotted coloured circles. Only points at equivalent
lat-itudes greater than 65◦N and having a CI>2.0 are shown.
Figures 5a to 5e correspond to model run M2 and Figs. 5f to 5j correspond to model run E2 for the days indicated. In each plot, contours of the Montgomery streamfunction in-dicate the direction of air flow. Figure 5a shows that on 9 December 2002 the Arctic vortex was elongated with two centres of flow. At this time, the cold pool was located close to the edge of the vortex, resulting in air mass tra-jectories with short durations below PSC temperatures. The orientation of the vortex and cold pool were similarly off-set throughout the first week of December (not shown). Ac-cording to the microphysical model, NAT particles formed in these cold air masses had insufficient time to grow appre-ciably, resulting in very weak denitrification despite the large
region below TNAT. In addition, analysed temperatures were
extremely low in early December, resulting in sequestration
of model gas-phase HNO3 in supercooled ternary solution
particles (STS) and hence further restriction of NAT growth. At this time, the DLAPSE model run M2 predicts a peak denitrification of 3–4 ppbv in a narrow region over north-ern Russia. Denitrification calculated by equilibrium run E2 (Fig. 5f) shows broadly similar features to M2 although there is a more pronounced “tongue” of weakly denitrified air fol-lowing the vortex flow across the pole from Arctic Russia to Canada. Particle sedimentation in the equilibrium model
occurs at a fixed rate therefore any air mass that is exposed to
temperatures below TNATwill undergo some denitrification.
From 13 December onwards, the vortex and cold pool cen-tres become more closely aligned, creating a significant re-gion of closed flow in the cold pool. Model denitrification in the core of the vortex (which corresponds to the region of cold closed flow) increased substantially over the following 10 days. Widespread MIPAS-E CI values below 2.0 close to the core of the vortex (Figs. 5b–d) also imply widespread PSC activity at this time. By 22 December, the vortex core was more than 80% denitrified in each model run. The dis-crepancies in the spatial distribution of denitrification be-tween model runs M2 and E2 become more apparent from 16 December onwards (cf. Figs. 5c–e and Figs. 5h–j). Model run M2 has the region of denitrification closely constrained to the region of closed flow in the core of the vortex. In contrast, the denitrification in model run E2 is much more widely distributed, with high levels of denitrification even in the through-flow part of the cold pool. Observed denitrifi-cation (filled circles) by late December suggests that model run E2 significantly overestimates the spatial extent of deni-trification at 505 K. A more detailed comparison of the spa-tial distribution of denitrification from MIPAS-E and these model runs is discussed in Sect. 5.
A notable feature is that both model denitrification
schemes have two centres of low gas phase HNO3 evident
on 19 December 2002 (Figs. 5d and i). The large region of
low HNO3close to the centre of the vortex is most likely due
to denitrification as temperatures are close to or just above
TNAT. MIPAS-E confirms the existence of strongly
deni-trified air in this region. The smaller region of low HNO3
over Iceland is most likely due to uptake into STS. MIPAS-E CI values below 2.5 for retrievals in this region indicate the likely presence of PSCs. (Differences in the uptake of
HNO3into STS between the model runs M2 and E2 are due
to differing extents of denitrification in both models.) As can be seen in Fig. 4a, in late December, the area of NAT supersaturation decreased significantly. This is partly caused by a minor stratospheric warming, but also the strong
denitrification decreases TNAT. Consequently model
calcu-lated denitrification was essentially complete by late Decem-ber, irrespective of the scheme used (not shown).
It is also worth noting that MIPAS-E indicates regions of
enhanced HNO3 relative to NO∗y at 505 K on 13 December
(Figs. 5b, g) and from 19 December (Figs. 5d, i) as shown by red circles. It is possible that these are a signal of reni-trification caused by the evaporation of NAT which has co-condensed onto ice particles which formed on the synoptic scale as temperatures were extremely low at 550 K in early December (Goutail et al., 2005).
3.3 Comparison with MarkIV balloon
The NASA Jet Propulsion Laboratory MarkIV balloon-borne
interferometer flew from Esrange, near Kiruna (67.9◦N,
P o te ntial t emper atur e (K) HNO3 - NOy* (ppbv)
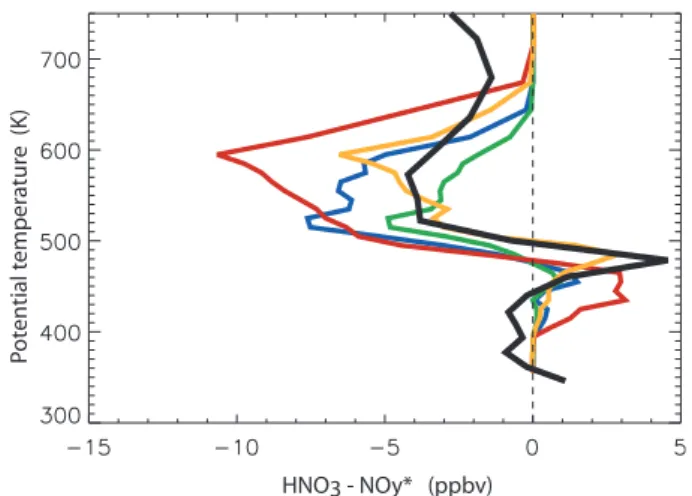
Fig. 6. Denitrification observed by the MarkIV balloon flight from Kiruna on 16 December 2002 (black). The model diagnosed deni-trification interpolated to the location of the MarkIV from runs M1 (green), M2 (blue), E1 (orange) and E2 (red) are also shown. Den-itrification from MarkIV is diagnosed as gas-phase NOy–NO∗yand model denitrification is diagnosed from gas-phase NOy– passive NOyfor all runs.
21.1◦E) on 16 December 2002. Figures 5c and h show the
model denitrification at 505 K on that day from model runs M2 and E2, respectively. According to the ECMWF anal-yses Northern Scandinavia was deep within the polar
vor-tex and temperatures were ∼2 K below TNAT. Model runs
M2 and E2 both indicate significant (∼6 ppbv) denitrifica-tion above Kiruna at 505 K on this day although the region of strongest modelled denitrification (∼10 ppbv) was situated about 500 km northeast of Kiruna.
Figure 6 shows the denitrification profile as observed by the MarkIV interferometer and for the four model runs terpolated to the Esrange location. Since the MarkIV
in-strument measures most NOyspecies, here we compare the
observed denitrification (NOy–NO∗y) with the model
deni-trification (NOy- passive NOy) for each of the runs – M1,
M2, E1, E2. Figure 6 shows that significant denitrification was observed by the MarkIV (black line) between ∼520 and
∼600 K. The observed denitrification does not tend to zero
above 650 K because the NO∗y(N2O) relation from Popp et al.
(2001) begins to break down for the low N2O concentrations
at these altitudes. The two different model denitrification schemes predict two different shaped denitrification profiles. In the equilibrium model runs, peak denitrification occurs at a considerably higher altitude than in either of the two runs with the DLAPSE microphysical scheme. The peak denitri-fication in the equilibrium model scheme corresponds to the
level where temperatures are furthest below TNAT whereas
the microphysical scheme accounts for the variation in parti-cles size with altitude leading to greater denitrification (larger particles) at lower levels.
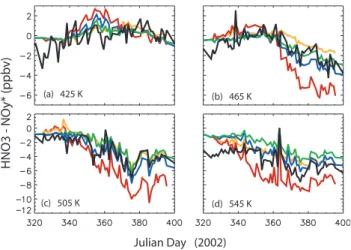
(a) 425 K (b) 465 K (c) 505 K (d) 545 K Julian Day (2002) HNO3 - NO y* (ppb v)
Fig. 7. Temporal evolution of ’average’ MIPAS-E-observed (black line) and model denitrification poleward of 65◦Equivalent Latitude at 4 isentropic levels during 2002/3. Model diagnosed denitrifica-tion from runs, M1 (green) M2 (blue), E1 (orange) and E2 (red) are also shown. Model output is interpolated to the location of the MIPAS-E tangent points and similarly averaged. Denitrification is diagnosed as gas-phase HNO3–NO∗yfor MIPAS-E and gas-phase HNO3– passive NOyfor model runs.
The shape of the observed denitrification profile is not re-produced at all altitudes by either of the model denitrification schemes. At high altitudes, denitrification is too strong in the equilibrium model runs, whereas the microphysical model runs tend to produce more denitrification than is observed at lower altitudes. Considering the microphysical model runs, at lower levels, the magnitude of observed denitrification from MarkIV is more consistent with that produced by the M1 run at the lower levels (around 500 K). At higher altitudes however, the observed denitrification bridges that produced by model runs M1 and M2. A comparison of the magni-tude of the observed denitrification with that produced by the equilibrium model runs shows that model E1 best matches the observed denitrification from MarkIV although both E1 and E2 significantly overestimate denitrification between 550 and 650 K. Although the observed renitrification is best re-produced in run E2, this model run is incompatible with the observed denitrification. The Chemical Lagrangian Model of the Stratosphere (CLaMS) uses a denitrification scheme based on DLAPSE. CLaMS was able to broadly reproduce the renitrification observed by the MarkIV balloon (Grooß et al., 2005) which implies that the renitrification feature may be too small to be reproduced in SLIMCAT at the resolution used in this study. Minimum ECMWF-analysed tempera-tures were extremely low (∼181 K at 550 K) in early Decem-ber therefore it is also possible that ice PSCs may have been present (Goutail et al., 2005) and contributed to the denitrifi-cation observed by MarkIV.
4 Timing of denitrification
Observations of Arctic NOyspecies from a variety of
plat-forms in a number of earlier winters have not been able to unambiguously determine the timing of the onset of strato-spheric denitrification in the Arctic. The wide spatial
cov-erage of MIPAS-E HNO3and N2O provide an opportunity
to determine both the onset and duration of denitrification in the Arctic during the winter of 2002/2003.
Figure 7 shows the evolution of denitrification inside the polar vortex as predicted by the four model runs on 4 isen-tropic levels (425 K, 465 K, 505 K and 545 K) and as mea-sured by MIPAS-E. Section 2.4 describes the procedure used to enable the model and observations to be comparable on these levels. Each daily point in the graph approximates a “vortex average denitrification”, which is the mean of ob-served or modelled denitrification interpolated to each of the valid retrieval points. Retrieval locations were assumed to be valid only if they satisfied all of the following criteria throughout the profile: MIPAS-E cloud index>2.0 (no inter-ference from clouds; Spang et al., 2005a); ECMWF
equiva-lent latitude>65◦ (inside the vortex); and T>TNAT–2 K as
determined from the ECMWF analyses, model H2O and
HNO3according to Hanson and Mauersberger (1988). The
value of denitrification represented in Fig. 7 is not a true vor-tex average as MIPAS-E does not sample all equivalent lati-tudes equally, especially when the criteria detailed above are used. The noise in the signal of the denitrification is caused by this non-uniform sampling of the vortex.
Figure 5 shows that the first clear signal of denitrification at 505 K in MIPAS-E occurred on 19 December 2002 near the pole. Five of the observations on 19 December (shown as filled circles marked with an X) may be weakly influenced by the presence of PSCs (2.0<CI<2.5), whilst three
obser-vations are clearly above TNAT–2 K. Consequently, only the
latter points are within the criteria that we use to calculate the vortex average. The MIPAS-E 505 K denitrification (black line in Fig. 7c) for this day (plotted at Julian day 353.5) has negligible denitrification within the noise of the signal. There are indications that weak denitrification was observed by MIPAS-E on 16 December although these points are on
the limit of the TNAT–2 K criterion we use to exclude
possi-ble uptake into PSCs. No MIPAS-E HNO3data are currently
available for 17–18 December.
The first point in Fig. 7c where the denitrification can be unambiguously determined to have begun is when den-itrified air is advected out of the cold pool on 19 Decem-ber (day 353.5) at 505 K and 545 K. At 465 K, the denitri-fication signal is much weaker and occurs later (day 370 onwards). Weak denitrification is preceeded by a slow
in-crease in MIPAS-E HNO3–NO∗ywhich could be due to
reni-trification or heterogeneous conversion of NOyreservoirs to
HNO3. A similar slow increase in HNO3–NO∗y is also
ob-served at 425 K but no denitrification is evident. The
-10 -8 -6 -4 -2 0 2
HNO3 - NOy* (ppbv)
(a) (b)
(c) (d)
Fig. 8. Contour plots of HNO3– passive NOyat 505 K on 3 January 2003 from model runs (a) M1, (b) M2, (c) E1 and (d) E2. MIPAS-E HNO3–NO∗yat tangent points are shown in filled circles.
545 K makes detailed comparisons at this altitude more dif-ficult.
The microphysical model runs M1 and M2 (green and blue respectively) capture the timing of denitrification well at all altitudes. This is especially true at 505 K, where the initial
offset between HNO3 and NO∗y is smaller. It is not clear
which of the two NAT particle nucleation rates used in the model best match MIPAS-E observations. In contrast, the equilibrium model runs (E1 and E2) both have a relatively short period of weak renitrification followed by denitrifica-tion that does not agree with the MIPAS-E observadenitrifica-tions. The tendency for model runs E1 and E2 to denitrify too early is more pronounced at 545 K. Denitrification begins around 10 days sooner in model runs E1 and E2 than is observed by MIPAS-E at this level. However, the ’vortex average’ ap-proach used here may mask some of the initial denitrification by cancellation of positive and negative signals. In addition, the exclusion of MIPAS-E profiles where PSCs may exist also limits the degree of certainty with which we can unam-biguously determine the timing of denitrification from these observations. Although model run E1 could be considered to reproduce the temporal evolution of “average” denitrifi-cation observed by MIPAS-E, it significantly underestimates observed denitrification in the core of the vortex (Fig. 8).
In summary, the temporal evolution of model and MIPAS-E “vortex average” denitrification during the Arctic win-ter of 2002/2003 suggests that the microphysical scheme is
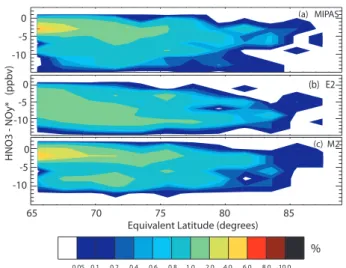
0.05 0.1 0.2 0.4 0.6 0.8 1.0 2.0 4.0 6.0 8.0 10.0
Equivalent Latitude (degrees)
HNO3 - NO y* (ppb v) (a) MIPAS (b) E2 (c) M2 % 65 70 75 80 85 0 -5 -10 0 -5 -10 0 -5 -10
Fig. 9. Probability distribution of denitrification as a function of Equivalent Latitude at 505 K for (a) MIPAS-E observations, (b) model run E2 and, (c) model run M2 for the period 15 December 2002 to 12 January 2003. Model denitrification is interpolated to each MIPAS-E observation point. The bin size is 2◦×1 ppbv.
better able to reproduce the MIPAS-E observations. The best agreement between model and observation is obtained
when the NAT nucleation rate is set to 3.2×10⁻⁹cm−3s−1
as in the M2 run. The temporal change in denitrification in the equilibrium model run E2 (with particle fall speed cho-sen to approximately match the denitrification produced by M2 at 505 K) does not match that of the MIPAS-E obser-vations. Model run E1 produces “average” denitrification which more closely reproduces the MIPAS-E observations than model run E2 by producing denitrification of a lower magnitude over a wider area of the vortex than is observed but significantly underestimating the observed denitrification in the core of the vortex. The denitrification produced by the equilibrium scheme shows very different features than the MIPAS-E observations at higher altitudes.
5 Spatial distribution of denitrification
In this section the evolution of the spatial distribution of den-itrification using the microphysical and equilibrium schemes is compared with observations from MIPAS-E. Figure 9 compares the modelled spatial distribution of denitrifica-tion in runs M2 and E2 with MIPAS-E at 505 K from
mid-December to mid-January. The modelled distribution in
run M2 agrees well with the observations (Fig. 9a). Both MIPAS-E observations and model run M2 demonstrate a bi-modal distribution of denitrification at equivalent latitudes
between 65 and 70◦ with a high probability of little or no
denitrification, together with a lower probability of strong denitrification (∼8–9 ppbv) in a narrow band. In contrast, model run E2 has an almost equal probability of
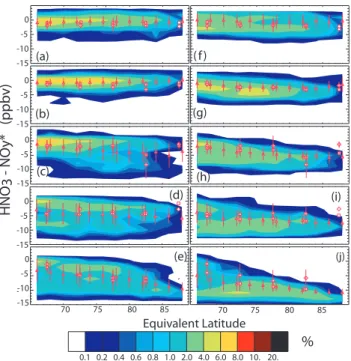
0.1 0.2 0.4 0.6 0.8 1.0 2.0 4.0 6.0 8.0 10. 20. % 0 -5 -10 -15 0 -5 -10 -15 0 -5 -10 -15 0 -5 -10 -15 0 -5 -10 -15 70 75 80 85 70 75 80 85 Equivalent Latitude (a) (b) (f) (g) HNO 3 - NO y* (ppb v) (i) (c) (h) (d) (e) (j)
Fig. 10. Probability distribution of denitrification as a function of Equivalent Latitude at 505 K for seven 5 day periods from model run M2 (a–e: left) and model run E2 (f–j: right). From the top, the intervals are 2–6 December, 7–11 December, 12–16 December, 17–21 December and 27–31 December. Triangles show the mod-elled vortex mean denitrification at the indicated Equivalent Lati-tude. Squares indicate the MIPAS-E mean denitrification and dia-monds indicate the vortex mean of model denitrification when in-terpolated to MIPAS-E.
latitude range. Both M2 and E2 produce a distribution of
denitrification at equivalent latitudes above 75◦N which is
realistic when compared with MIPAS-E. The low
probabil-ities at equivalent latitudes poleward of 80◦N may be
at-tributed to the low number of valid MIPAS-E points in that region during the period of study as many potentially denitri-fied profiles are excluded due to the presence of PSCs which
affect the retrieval or temperatures below TNAT–2 K where
significant HNO3uptake cannot be excluded.
Figure 10 shows the distribution of modelled denitrifica-tion at 505 K from model runs M2 and E2 for five 5-day pe-riods during December as a function of equivalent latitude. Model denitrification at each in-vortex grid point was placed
into 1 ppbv×2◦equivalent latitude bins. Triangles mark the
mean and 1-σ standard deviation of the contoured model denitrification distribution. All in-vortex MIPAS-E points which satisfied the selection criteria described above were
placed into 1 ppbv×5◦equivalent latitude bins and plotted as
squares. The diamonds represent the model interpolated to MIPAS-E observations and sampled similarly to MIPAS-E.
In the equilibrium run E2, denitrification occurs almost
uniformly poleward of ∼67◦N (Fig. 10h–j) whereas the
mi-crophysical run M2 shows a higher incidence of
denitrifica-tion at the higher equivalent latitudes (Fig. 10c–d). This fea-ture of kinetically controlled denitrification is less apparent towards the end of December (Fig. 10e) when transport of denitrified air plays an increasing role in the spatial distribu-tion of denitrificadistribu-tion. Significant differences in the spatial distribution of denitrification between the two model runs re-main, however. These differences are especially apparent to-wards the end of December (Figs. 10e and j). Both model runs have a relatively high occurrence of strong denitrifica-tion close to the centre of the vortex. However, the distribu-tion of denitrificadistribu-tion at lower equivalent latitudes within the
vortex (between ∼70◦–80◦N) show significant differences.
In summary, the spatial distribution in the DLAPSE micro-physical scheme agrees much better with observations than a model which simply assumes thermodynamic equilibrium
between NAT and gas-phase HNO3. Out of the three
compar-isons performed here (timing, vertical distribution and hori-zontal distribution) it is the horihori-zontal distribution of deni-trification that provides the most compelling evidence that a microphysical scheme is more realistic than an equilibrium scheme.
6 Conclusions
The Arctic winter of 2002/2003 was unusually cold with temperatures below the PSC formation threshold from mid-November until mid-January. Denitrification of the Arctic lower stratosphere was observed by the JPL MarkIV
inter-ferometer over Scandinavia in mid-December 2002. HNO3
and N2O observations from the MIPAS-E instrument aboard
ENVISAT were available throughout the polar vortex during this winter. MIPAS-E has provided an opportunity to ex-amine the timing and spatial distribution of denitrification in this winter. We have used data from MIPAS-E to explore the temporal and spatial distribution of denitrification in the DLAPSE/SLIMCAT model. Comparisons were also made with a simple NAT-based equilibrium denitrification scheme. Denitrification was first observed by MIPAS-E in mid-December between 505 and 545 K. At these altitudes, the denitrification scheme in DLAPSE closely matched the tim-ing of observed denitrification at these altitudes. In contrast, the simpler equilibrium denitrification scheme used in many CTMs tended to denitrify around 10 days too early when compared with MIPAS-E. This discrepancy was pronounced in the equilibrium model run with the higher denitrification rate but less evident when a lower denitrification rate was used. However, the equilibrium model run with the lower denitrification rate significantly underestimated the magni-tude of denitrification in the core of the vortex. Early den-itrification was especially pronounced at 545 K, accompa-nied initially by weak renitrification at 505 K. At lower al-titudes (465 and 425 K) where denitrification was weaker,the differences between model runs were less pronounced. The best fit to observations was achieved using the microphysical
denitrification scheme with a nucleation rate of 3.2×10⁻⁹
particles cm−3s−1. The need for an increased NAT
parti-cle nuparti-cleation rate to match observations of denitrification during the Arctic winter of 2002/2003 is consistent with the results obtained by Grooß et al. (2005). They compared the denitrification produced from their DLAPSE-like scheme in the CLaMS model to MarkIV observations and later in situ observations from the Geophysica high altitude research air-craft.
Considerable differences in the spatial distribution of den-itrification are apparent between microphysical and equi-librium denitrification schemes. Equiequi-librium denitrification schemes have been shown to denitrify over a wider horizon-tal area of the vortex than equivalent microphysical schemes in idealised simulations (Mann et al., 2002) when the rela-tive orientation of the vortex flow and cold pool are offset. A baroclinic vortex is less favourable for denitrification by large NAT particles as the process requires particle
trajecto-ries to remain below TNATfor several days. The rate of
den-itrification increases non-linearly with time in microphysi-cal growth models such as DLAPSE. Equilibrium schemes, however, generally denitrify at a fixed rate which is inde-pendent of the history of the air parcel. There were signif-icant periods of time during the Arctic winter of 2002/2003 when the vortex and cold pool were offset, resulting in sig-nificant differences in the meridional distribution of denitri-fication between microphysical and equilibrium model runs.
We have used the wide spatial coverage of MIPAS-E HNO3
and N2O to examine the horizontal distribution of model
denitrification. These observations suggest that the equilib-rium denitrification scheme used in this study overestimates the observed denitrification in the outer regions of the
vor-tex (between 65◦ and 70◦N equivalent latitude) when the
observed denitrification in the core of the vortex is repro-duced. MIPAS-E observations indicate that the outer regions of the Arctic vortex were not significantly denitrified during the denitrifying phase throughout December and early Jan-uary. The DLAPSE denitrification scheme reproduces the observed horizontal distribution of denitrification during this winter.
Equilibrium schemes tend to produce stronger denitrifi-cation than microphysical schemes at the highest altitudes (∼550 K in 2002/2003) where mid-winter temperatures tend
to be furthest below TNAT. Denitrification at the highest
al-titudes in microphysical models is suppressed by the small
size and slow uptake of HNO3although quantification of this
difference is beyond the scope of this study.
The present comparison with new satellite observations during winter 2002/2003, combined with the extensive com-parison with in situ and remote observations from other win-ters (Davies et al., 2005), now provides strong support for the mechanism of denitrification in our 3-D model. Four clear statements about denitrification may now be made: 1) The onset and rate of Arctic denitrification can be explained by the formation, growth and sedimentation of NAT particles.
2) Synoptic-scale ice formation as a precursor to NAT forma-tion cannot account for the observed development of Arctic denitrification, which occurs long before temperatures have fallen to the ice frost point (although this is not the case in 2002/2003). 3) The formation of NAT at a fixed nucleation rate uniformly throughout the NAT supersaturated region of the vortex produces 3-D fields of denitrification that agree well with extensive observations; none of the denitrification observations that we have analysed supports the need for a more complex NAT formation mechanism, although a sin-gle rate fails to reproduce the magnitude of denitrification equally well in all winters. 4) The co-location of the regions of low temperature and circulation is important in controlling the spatial distribution of denitrification, as originally sug-gested by Carslaw et al. (2002); Mann et al. (2002, 2003).
Acknowledgements. This work was supported by the European
Commission Framework 5 projects EUPLEX and MAPSCORE projects under contracts 2002-00084 and EVK2-CT-2000-00072 and by the Framework 6 project SCOUT-O3. Work at the Jet Propulsion Laboratory was done under contract with the National Aeronautics and Space Administration.
Edited by: R. MacKenzie
References
Camy-Peyret, C., Dufour, G., Payan, S., Oelhaf, H., Wetzel, G., Stiller, G., Blumenstock, Th., Blom, C. E., Gulde, T., Glatthor, N., Engel, A., Pirre, M., Catoire, V., Moreau, G., De Mazi`ere, M., Vigouroux, C., Mahieu, E., Cortesi, U., and Mencaraglia, F.: Validation of MIPAS N2O profiles by stratospheric balloon, air-craft and ground based measurements, Proc. ACVE-2 meeting, 3–7 May 2004, Frascati, Italy, 2004.
Carli, B., Alpaslan, D., Carlotti, M., et al.: First results of MI-PAS/ENVISAT with operational level 2 code, Adv. Space Res., 33, 1012–1019, 2004.
Carslaw, K. S., Luo, B. P., and Peter, Th.: An analytic expression for the composition of aqueous HNO3-H2SO4stratospheric aerosols including gas-phase removal of HNO3, Geophys. Res. Lett., 22, 1877–1880, 1995.
Carslaw, K. S., Peter, Th., Backmeister, J. T., and Eckermann, S. D.: Widespread solid particle formation by mountain waves in the Arctic stratosphere, J. Geophys. Res., 104, 1827–1836, 1999. Carslaw, K. S., Kettleborough, J., Northway, M. J., Davies, S., Gao, R.-S., Fahey, D. W., Baumgardner, D. G., Chipperfield, M. P., and Kleinb¨ohl, A.: A vortex-scale simulation of the growth and sedimentation of large nitric acid hydrate particles, J. Geophys. Res., 107(D20) 8300, doi:10.1029/2001JD000467, 2002. Chipperfield, M. P. and Pyle, J. A.: Model sensitivity studies of
Arctic ozone depletion , J. Geophys. Res., 103, 28 389–28 403, 1998.
Chipperfield, M. P.: Multiannual simulations with a three- dimen-sional chemical transport model, J. Geophys. Res., 104, 1781– 1805, 1999.
Davies, S. Chipperfield, M. P., Carslaw, K. S., Sinnhuber, B.-M., Anderson, J. G., Stimpfle, R. M., Wilmouth, D. M., Fahey. D. W., Popp, P. J., Richard E. C., von der Gathen, P., Jost, H., and
Webster, C. R.: Modeling the effect of denitrification on Arctic ozone depletion during winter 1999/2000, J. Geophys. Res., 107, 8322, doi:10.1029/2001JD000445, 2002.
Davies, S.: Denitrification and ozone loss in the Arctic stratosphere, PhD thesis, University of Leeds, UK, 2003.
Davies, S., Mann, G. W., Carslaw, K. S., Chipperfield, M. P., Kettle-borough, J. A., Oelhaf, H., Wetzel, G., Santee, M. L., Sasano, Y., and Sugita, T.: 3-D microphysical model studies of Arctic deni-trification: Comparison with observations, Atmos. Chem. Phys., 5, 3093–3109, 2005,
http://www.atmos-chem-phys.net/5/3093/2005/.
Drdla, K., Schoeberl, M. R., and Rosenfeld, J., Microphysi-cal modeling of the 1999/2000 Arctic winter. 1. Polar strato-spheric clouds, denitrification and dehydration, J. Geophys. Res., 108(D5), 8312, doi:10.1029/2001JD000782, 2002.
Fahey, D. W., Kelly, K. K., Kawa, S. R., et al.: Observations of denitrification and dehydration in the winter polar stratospheres, Nature, 344, 321–324, 1990.
Fahey, D. W., Gao, R.-S., Carslaw, K. S., et al.: The detection of large HNO3-containing particle in the winter Arctic stratosphere and their role in denitrification, Science, 291, 1026–1031, 2001. Flaud, J.-M., Piccolo, C., Carli, B., Perrin, A., Coudert, L. H., Teffo, J.-L, and Brown, L. R.: Molecular line parameters for the MIPAS (Michelson Interferometer for Passive Atmospheric Sounding) experiment, J. Atmos. Ocean Optics, 16, 172–182, 2003 Fueglistaler, S., Luo, B. P., Voigt, C., Carslaw, K. S., and Peter, Th.:
NAT-rock formation by mother clouds: a microphysical model study, Atmos. Chem. Phys., 2, 93–98, 2002,
http://www.atmos-chem-phys.net/2/93/2002/.
Goutail, F., Pommereau, J.-P., Lef`evre, F., et al.: Early unusual ozone loss during the Arctic winter 2002/2003 compared to other winters, Atmos. Chem. Phys., 5, 665–677, 2005,
http://www.atmos-chem-phys.net/5/665/2005/.
Groß, J.-U., G¨unther, G., M¨uller, R., Konopka, P., Bausch, S., Schlager, H., Voigt, C., Volk, C. M. and Toon, G. C., Simulation of denitrification and ozone loss for the Arctic winter 2002/3, At-mos. Chem. Phys., 5, 1437–1448, 2005,
http://www.atmos-chem-phys.net/5/1437/2005/.
Hanson, D. and Mauersberger, K.: Laboratory studies of nitric acid trihydrate: Implications for the south polar stratosphere, J. Geo-phys. Res., 101, 2117–2120, 1988.
Knopf, D. A., Koop, T., Luo, B. P., Weers, U. G., and Peter, Th.: Homogeneous nucleation of NAD and NAT in liquid strato-spheric aerosols: insufficient to explain denitrification, Atmos. Chem. Phys., 2, 207–214, 2002,
http://www.atmos-chem-phys.net/2/207/2002/.
Kondo, Y., Irie, H., Koike, M., and Bodecker, G. E.: Denitrification and nitrification in the Arctic stratosphere during the winter of 1996/97, Geophys. Res. Lett., 27(3), 337–340, 2000.
Larsen, N., Knudsen, B. M., Svendsen, S. H., et al.: Formation of solid particles in synoptic-scale Arctic PSCs in early winter 2002/2003, Atmos. Chem. Phys., 4, 2001–2013, 2004,
http://www.atmos-chem-phys.net/4/2001/2004/.
Mann, G. W., Davies, S., Carslaw, K. S., Chipperfield, M. P., and Kettleborough, J.: Polar vortex concentricity as a controlling fac-tor in Arctic denitrification, J. Geophys. Res., 107(D22), 4663, doi:10.1029/2002JD002102, 2002.
Mann, G. W., Davies, S., Carslaw, K. S., and Chipperfield, M. P.: Factors controlling Arctic denitrification in cold winters of the
1990s, Atmos. Chem. Phys., 3, 403–416, 2003, http://www.atmos-chem-phys.net/3/403/2003/.
Meilinger, S. K., Koop, T., Luo, B. P., Huthwelker, T., Carslaw, K. S., Kreiger, U., Crutzen, P. J., and Peter, Th.: Size-dependent stratospheric droplet composition in mesoscale temperature fluc-tuations and their potential role in PSC freezing, Geophys. Res. Lett., 22, 3031–3034, 1995.
M¨uller, M., Neuber, R., Massoli, P., et al.: Differences in Arc-tic and AntarcArc-tic PSC occurrenceas observed by lidar in
Ny-˚
Alesund (79◦N, 12◦E) and McMurdo(78◦S, 167◦E), Atmos. Chem. Phys., 5, 2081–2090, 2005,
http://www.atmos-chem-phys.net/5/2081/2005/.
Naujokat, B. and Grunow, K.: The stratospheric arctic winter 2002/3: Balloon flight planning by trajectory calculations, Pro-ceedings of the 16th ESA Symposium on European Rocket and Balloon Programmes and Related Research, St. Gallen (ESA SP-530), 421–425, 2003.
Newman, P. A. Harris, N. R. P., Adriani, A., et al.: An overview of the SOLVE/THESEO 2000 campaign, J. Geophys. Res., 107(D20), 8259, doi:10.1029/2001JD001303, 2002
Northway, M. J., Gao, R.-S., Popp, P. J., et al.: An analysis of large HNO3-containing particles sampled in the Arctic stratosphere during the winter of 1999/2000, J. Geophys. Res., 107(D20), 8298, doi:10.1029/2001JD001079, 2002.
Oelhaf, H., Blumenstock, T., De Mazi`ere, M., Mikuteit, S., Vigouroux, C., Wood, S., Bianchini, G., Baumann, R., Blom, C., Cortesi, U., Liu, G. Y. , Schlager, H., Camy-Peyret, C., Catoire, V.,Pirre, M., Strong, K., and Wetzel, G.: Validation of MIPAS-ENVISAT Version 4.61 HNO3operational data by stratospheric balloon, aircraft and ground-based measurements, Proceedings of ACVE-2 workshop, 3–7 May 2004, Frascati, Italy, 2004. Popp, P., Northway, M. J., Holecek, J. C., et al.: Severe and
exten-sive denitrification in the 1999–2000 Arctic winter stratosphere, Geophys. Res. Lett., 28, 2875–2878, 2001.
Sander, S. P., Ravishankara, A. R., Friedel, R. R., et al.: Chemical Kinetics and Photochemical Data for Use in Stratospheric Mod-eling, Evaluation 13, JPL Publ. 00–3, 2000.
Santee, M. L., Read, W. G., Waters, J. W., Froidevaux, L., Manney, G. L., Flower, D. A., Jarnot, R. F., Harwood, R. S., and Peckham, G. E.: Interhemispheric differences in polar stratospheric HNO3, H2O, ClO and O3, Science, 267, 849–852, 1995.
Santee, M. L., Manney, G. L., Froidvaux, L., Read, W. G., and Waters, J. W.: Six years of UARS Microwave Limb Sounder HNO3observations: Seasonal, interhemispheric, and interannual variations in the lower stratosphere, J. Geophys. Res., 104, 8225– 8246, 1999.
Santee, M. L., Manney, G. L., Livsey, N. J., and Waters, J. W.: UARS Microwave Limb Sounder observations of denitrification ond ozone loss in the 2000 Arctic late winter, Geophys. Res. Lett., 27, 2313–2316., 2000.
Spang, R., Riese, M., and Offermann, D.: CFC 11 Measurements by CRISTA, Adv. Space Res., 19, 575–578, 1997.
Spang, R., Riese, M., and Offermann, D.: CRISTA-2 observations of the south polar vortex in winter 1997: A new dataset for polar process studies, Geophys. Res. Lett., 28, 3159–3162, 2001. Spang, R. and Remedios, J. J.: Observations of a distinctive
in-frared spectral feature in the atmospheric spectra of polar strato-spheric clouds measured by the CRISTA instrument, Geophys. Res. Lett., 30(16), 1875, doi:10.1029/2003GL017231, 2003.
Spang, R., Remedios, J. J., Kramer, L. J., Fromm, M. D., M¨uller, M., Baumgarten, G., and Konopka, P., Polar stratospheric cloud onservations by MIPAS on ENVISAT: detection method, vali-dation and analysis of the northern hemisphere winter 2002/3, Atmos. Chem. Phys. 5, 679–692, 2005a.
Spang R. , Remedios, J. J., Tilmes, S., and Riese, M., MIPAS ob-servation of polar stratospheric clouds in the Arctic 2002/3 and Antarctic 2003 winters, accepted for Adv. Space Res., 2005b. Sugita, T., Kondo, Y., Nakajima, H., Schmidt, U., Engel, A., Oelhaf,
H., Wetzel, G., Koike, M., and Newman, P. A.: Denitrification observed inside the Arctic vortex in February 1995, J. Geophys. Res., 103, 16 221–16 223, 1998.
Tabazadeh, A., Santee, M. L., Danilin, M. Y., Pumphrey, H. C., Newman, P. A., Hamill, P. J., and Mergenthaler, J. L.: Quantifi-fying denitrification and its effect on ozone recovery, Science, 288, 1407–1411, 2000.
Tabazadeh, A.: Role of the stratospheric polar freezing belt in den-itrification, Science, 291, 2591–2594, 2001.
Tabazadeh, A., Djikaev, Y. S., Hammill, P., and Reiss, H.: Labora-tory evidence for surface nucleation of solid polar stratospheric clouds, J. Phys. Chem A, 106(43), 10 238–10 246, 2002. Tsidu, G. M., Stiller, G. P., von Clarmann, T., Funke, B., Fischer, H.,
Glatthor, N., Grabowski, U., H¨opfner, M., Kellmann, S., Kiefer, M., Linden, A., Milz, M., Steck, T., and Wang, D. Y.: NOy from Michelson Interferometer for Passive Atmospheric Soud-ing on Environmental Satellite durSoud-ing the southern hemisphere polar vortex split in September/October 2002, J. Geophys. Res., 110(D11), D11301, doi:10.1029/2004JD005322, 2005. Waibel, A. E., Peter, T., Carslaw, K. S., Oelhaf, H., Wetzel, G.,
Crutzen, P. J., Poschl, U., Tsias, A., Reimer, E., and Fischer, H.: Arctic ozone loss due to denitrification, Science, 283, 2064– 2069, 1999.