HAL Id: hal-00658868
https://hal.archives-ouvertes.fr/hal-00658868
Submitted on 3 Apr 2013HAL is a multi-disciplinary open access
archive for the deposit and dissemination of sci-entific research documents, whether they are pub-lished or not. The documents may come from teaching and research institutions in France or abroad, or from public or private research centers.
L’archive ouverte pluridisciplinaire HAL, est destinée au dépôt et à la diffusion de documents scientifiques de niveau recherche, publiés ou non, émanant des établissements d’enseignement et de recherche français ou étrangers, des laboratoires publics ou privés.
D. Markovitsi, T. Gustavsson, A. Banyasz
To cite this version:
D. Markovitsi, T. Gustavsson, A. Banyasz. DNA Fluorescence. CRC Handbook of organic Photo-chemistry and Photobiology, Taylor & Francis Group, pp1057-1079, 2012. �hal-00658868�
DNA Fluorescence
Dimitra Markovitsi, Thomas Gustavsson and Akos Banyasz
Laboratoire Francis Perrin, CEA/DSM/IRAMIS/SPAM - CNRS URA 2453, CEA Saclay, F-91191 Gif-sur-Yvette, France
1 Introduction
Talking about fluorescence in respect to DNA one usually refers to fluorescent labels used extensively in biology and genetics. Yet DNA does emit fluorescence albeit with a low quantum yield, of the order of 10-4. Such weak emission, which so far prevented large scale technological applications, may be precious in many respects provided that its properties are well understood. For example, it can contribute to elucidate questions such as: How the building blocks of the genetic code “survived” when intense UV radiation was reaching the earth? What are the primary events leading to photochemical reactions which induce carcinogenic mutations? This is possible because following the time behavior of fluorescence brings information about the singlet electronic excited states and their relaxation.
Although the first articles reporting room temperature fluorescence of DNA components were published already in the 1971 1, 2, a thorough study of the emitting states was limited by the time-resolution. It is only during the past few years that the development of femtosecond techniques, mainly based on fluorescence upconversion and allowing excitation and detection in the UV spectral domain, gave an important impulse to this field.
Here we tackle studies appeared since the turn of the 21st century. We mention that two recent reviews deal with the excited state dynamics of nucleic acids with particular emphasis on transient absorption studies 3, 4. In the present Chapter we present the fluorescence
behavior of these systems in more detail and we address the main problems and outcomes related to such investigations.
We examine successively the monomeric building blocks (bases, nucleosides, nucleotides; Section 5) and then more complex systems (single, double and quadruple strands; Section 6). As photon emission is strongly related to photon absorption, at least in the reported work, we also discuss the absorption spectra and the Franck-Condon excited states (Section 4).
Detecting very weak fluorescence signals with UV excitation is not a trivial task. Therefore, we describe experimental methods specially related to this type of measurements (Section 2). Finally, in the case of DNA strands, particular cautions are required due to their increased fragility versus UV radiation and the plasticity of their structure. This renders comparison of data obtained by various groups using different experimental conditions quite delicate and the definition of commonly accepted protocols is an urgent need (Section 3).
2 Experimental methods and setups
2.1
Steady-state fluorescence spectraThe following procedure was followed in order to record fluorescence spectra of DNA components over a large spectral domain and make a refined comparison of the emission spectra of various systems 5.
Fluorescence spectra were recorded with a SPEX Fluorolog-2 spectrofluorimeter equipped with a 450 Watt arc Xenon lamp. The calibration of emission monochromator was verified using a Hg low pressure standard lamp whereas that of the excitation monochromator was confirmed by observing the scattered excitation light from water. The emission correction factor was performed by means of deuterium and tungsten lamps of standard irradiance and checked via the standard fluorescence spectrum of quinine sulfate 6.
For fluorescence measurements, 1 cm x 1 cm and 0.2 cm x 1 cm quartz cells (QZS) were used for dilute and concentrated solutions, respectively. For dilute solutions (< 5x10⁻⁵ M; 1 cm x 1 cm cells), the signal of solvent (in most cases the Raman line of water) was not negligible compared to the fluorescence intensity. Therefore, its contribution was subtracted from the fluorescence spectra. Each spectrum was recorded several times: (i) without any filter at the emission side and using (ii) a Schott WG320 or (iii) a Schott GG385 filter. In all cases, a Schott UG5 filter was used on the excitation side. The three spectra were normalized at appropriate wavelengths and then joined. Such a procedure allowed us to eliminate the second order of the scattered excitation light from water, Raman scattering and also the second order of the main fluorescence peak.
Fluorescence quantum yields (s) were determined using quinine sulfate dihydrate in
0.1 M HClO4 (s = 0.59) 6. As a control the fluorescence quantum yield of PPO in
cyclohexane was determined and found to be 0.90 0.02, in perfect agreement with the most recent value reported in the literature (0.89) 7.
2.2
Time-resolved techniquesAs mentioned in the Introduction, time-resolved fluorescence studies of DNA constituents require femtosecond resolution. Nevertheless, much longer lived components are present in the fluorescence of DNA helices. In order to obtain a global picture, probing fluorescence over several decades of time is necessary. This can only be achieved by combination of different detection techniques.
Femtosecond time resolution is obtained by the use of femtosecond lasers together with optical gating detection: fluorescence upconversion (FU) and optical Kerr gating (OKG). In FU an intense laser (gate) pulse is mixed with the polarized fluorescence in a nonlinear optical crystal creating a sum-frequency light. The gate pulse defines a time window during which the fluorescence can be measured. By scanning the optical delay between the gating and
excitation pulses, fluorescence intensity traces are recorded. The detection is performed by photon counting, favourable for high repetition (MHz) laser sources 8, but also amplified kHz systems are used 9, 10. In OKG the polarized fluorescence is directed through a Kerr shutter consisting of two crossed polarisers between which a Kerr medium is positioned. Without a gating pulse, the fluorescence is extinguished by the Kerr shutter. However, when a highly intense laser pulse (gate) is focused into the Kerr medium, it induces a change of the fluorescence polarization, letting part of it to pass through to detection. An amplified kHz laser system is necessary in order to attain the gating pulse intensities needed 11. Time resolved fluorescence spectra of DNA were obtained by both FU 12-17 and OKG 18, 19.
Recent DNA fluorescence studies focusing on longer components relied on time-correlated single photon counting (TCSPC) using either femtosecond laser 20, 21 or synchrotron radiation 22.
The experimental setup developed in our laboratory for the time-resolved fluorescence measurements of DNA cited here gives the possibility to probe fluorescence over a large time domain from 100 fs to 100 ns using the same excitation source (267 nm, 120 fs). Two different detection techniques were used. On the one hand fluorescence upconversion detects emission associated with allowed electronic transitions with a resolution of ca. 100 fs after deconvolution. On the other, time-correlated single photon counting probes emission from both bright and “dark” excited states with a time-resolution of 10 ps after deconvolution.
We paid special attention to the determination of the fluorescence anisotropy. To this end, parallel Ipar(t) and perpendicular components Iper(t) of the fluorescence signals were
recorded by means of a half wave plate, positioned at the excitation side (FU) or by means of a Glan Thomson prism positioned at the detection side (TCSPC). Fluorescence decays F(t) and fluorescence anisotropy decays r(t) were determined as:
r(t) = (Ipar(t) - GIper(t))/(Ipar(t) + 2GIper(t)).
In the case of FU the G factor was equal to 1 whereas in the case of TCSPC it was determined by the tail-matching method using protonated guanosine (pH = 2.5)23.
3 Protocols for the study of DNA helices
Spectroscopic studies of DNA helices present specific difficulties which are not encountered in the experiments carried out with monomeric chromophores24. Indeed, the close proximity of the bases within a helix favors photoreactions leading to dimeric products, such as cyclobutane dimers and (6-4) adducts 25-27. Moreover, base stacking increases their propensity to loose an electron upon photon absorption 28-30. Thus, laser pulses are likely to provoke two-photon ionization of both the aqueous solvent as well as of the DNA helices. The produced radicals 31-33 are very reactive and they lead to oxidation products, such as 6-hydroxy-5,6-dihydrocytosine or 8-oxo-7,8-dihydroguanine. Further reactions may be induced by the hydrated electrons which can attack the studied nucleic acids.
The various photoproducts may affect fluorescence measurements in two ways. On the one hand, some of them emit light. This is typically the case of the (6-4) adducts whose fluorescence quantum yield is higher by two order of magnitudes than that of DNA components34. On the other, formation within a helix may alter its conformation which, in turn, may modify the electronic coupling. Consequently, excited state relaxation in damaged duplexes should be different compared to that of the initial duplexes which are the objects under study. For example, we found that accumulation of photoproducts in (dA)n·(dT)n,
shortens its fluorescence lifetime recorded by FU and increases that determined by TCSPC 24. Analysis of the thymine dimers formed upon continuous irradiation at 267 nm of (dA)20·(dT)20 using high performance liquid chromatography coupled to mass spectrometry
brought an important insight into the relation between spectral changes and photodamage35. It was demonstrated that changes in the steady-state absorption spectra result from two
antagonistic effects: on the one hand, a decrease in the absorbance due to disappearance of the thymines which reacted and, on the other, an increase in the absorbance due to local denaturation of the adenines. Consequently, the decrease in the absorption maximum observed after a time-resolved measurement36, 37 is not directly proportional to the actual photodamage. To be more specific, the formation of one cyclobutane dimer within (dA)20(dT)20 corresponds to a destruction of 5% of the bases of the duplex but leads to only
0.6% decrease in the absorption maximum 35.
In order to avoid contamination of the fluorescence signals with photons emitted from damaged helices it is important to follow a few rules: keep the laser intensity as low as possible, use a sufficiently large ratio of molecules compared to that of the photons absorbed during the measurement and avoid local accumulation of photoproducts. In practice, FU experiments were performed using a flow cell allowing circulation of 20 ml of solution (ca. 2x10⁻³ M per base), the laser intensity at the surface of sample being 2x10⁸ W/cm2. Much lower laser intensities (104 W/cm2) were used in TCSPC measurements which gave the possibility to work with smaller volumes: 0.3 ml (ca. 2x10⁻⁴ M per base) in a moving cell. However, the ultimate test is to check if successive signals recorded with the same solution are reproducible. Experimental procedures similar to ours were also followed by Schwalb and Temps38.
Besides the above mentioned cautions related to UV excitation of DNA helices, further problems are associated specifically with double strands. Polymers are produced biochemically, which insures efficient base-pairing, whereas oligomers are prepared by annealing of the parent single strands. In the latter case, duplex formation depends both on the annealing conditions and on the base sequence. In particular, when repetitive simple base sequences are used, such as (dA)n·(dT)n or (dAdT)n·(dAdT),n, slipping between the two
complementary strands is possible. The degree of hyperchromism observed upon melting of a duplex should used as a quality test for base pairing 24.
4 Franck-Condon excited states
4.1
Monomeric chromophoresThe absorption spectra of the nucleosides (dA: 2’-deoxyadenosine; dT: thymidine; dG: deoxyguanosine; dC: deoxycytidine), identical to those of the nucleotides (dAMP: deoxyadenosine 5'-monophosphate; TMP thymidine 5'-monophosphate; dGMP: 2’-deoxyguanosine 5'-monophosphate; dCMP: 2’-deoxycytidine 5'-monophosphate) which constitute the monomeric DNA chromophores are shown in Figure 1. The cytosine and thymine derivatives belong to the pyrimidine family while adenines and guanines are denoted as purines.
The lowest in energy absorption band of dA/dAMP and dG/dGMP corresponds to two close lying electronic transitions. This is suggested by a shoulder present in the dG spectrum. In the case of the adenine derivatives, the existence of two transitions was evidenced experimentally by means of linear dichroism and magnetic circular dichroism 39. These observations are corroborated by quantum chemistry calculations which have shown the existence of two close-lying * states, denoted La and Lb 40, 41,in accordance with the Platt
nomenclature42. Even if their relative ordering in gas phase is under debate, it is relatively safe to assume that for chromophores in aqueous solution, the more polar La is the first excited
state. For the pyrimidines, the La and Lb are much further apart, so the first absorption band
corresponds essentially to only one strong * transition.
In addition to the spectra of the nucleosides corresponding to the four major bases, we also present in Figure 1 that of 5-methylcytidine (5MedC). Methylation and demethylation at the 5 position of cytosine are natural processes playing an important biological role 43.
Methylated sites are strongly correlated with the occurrence of carcinogenic mutations 44. The absorption spectrum of 5MedC is red-shifted with respect to that of dC 12. This observation together with the fact that the intensity of the solar radiation reaching the earth increases with increasing wavelength could be a hint for the involvement of this rare base to the appearance of UV-induced DNA lesions.
4.2 DNA helices
When going from monomeric chromophores to the DNA double strands, the absorption spectra are altered (Figure 2). The most striking change concerns the oscillator strength. The DNA hypochromism is used to characterize the stability of double strands via their melting curves, obtained by following the absorbance at 260 nm as a function of temperature. Despite the extensive application of this phenomenological property the underlying modifications of the electronic transitions remained unclear until recently. The study of base pairs and dimers of base pairs by quantum chemistry methods shed light on this question attributing the DNA hypochromism to charge transfer transitions between different bases 45, 46 It was also shown that simple coupling between bright and dark transitions, due to orbital overlap may lead to the same effect 47.
It can be seen in Figure 2 that the change in the molar absorption coefficient observed for the duplex with respect to an equimolar mixture of the constitutive nucleotides is not uniform over the whole spectrum and depends on the base sequence. Interestingly, an increase in the oscillator strength is observed at the red edge of the spectra of duplexes composed of homopolymeric adenine-thymine (dA)n·(dT)n and alternating guanine-cytosine
(dCdG)n·(dCdG)n sequences. This is also known to occur in the case of four-stranded
structures formed by self-association of guanines via Hoogsteen bonds (Figure 3) called G-quadruplexes 48-50.
In addition to orbital overlap interactions, another type of electronic interactions is also operative within double strands: coupling between dipolar transitions of the monomeric chromophores which gives rise to Frenkel excitons. According to the exciton theory the excited states of a multichromophoric system are linear combinations of the excited states localized on each monomeric constituent 51, 52. The calculated properties of the eigenstates highly depend on the way that the exciton matrix is constructed. Recent calculations performed in this frame for duplexes composed of ten base-pairs marked a significant progress with respect to older studies 53, 54. The diagonal terms of the Hamiltonian matrix (dipolar coupling) were calculated using atomic transition charges derived from quantum chemistry data 55 and taking into account various conformations determined by molecular dynamics simulations 56-58. These theoretical studies showed that, even in the presence of conformational disorder, the dipolar coupling alone is capable of inducing delocalization of the excitation over several bases. The number of coherently coupled bases, calculated by the participation ratio PR=1/Lk,59, 60 where Lk is given by:
m monomer i i m k,(C
2 states 2 k)
L
.The sum within the square brackets represents the contribution to the eigenstate <k> of different electronic states (i) belonging to the same monomer (m). The participation ratio was determined for two limiting cases (Figure 4). First, in the absence of spectral broadening, considering that each electronic transition of the monomeric chromophores is a delta function. Then, spectral broadening was taken into account. As the homogeneous width is not known, diagonal disorder was represented by the inhomogeneous width derived from decomposition of the experimental spectra in solution (Figure 1) using lognormal functions 55. Even in the latter case, where the diagonal disorder is overestimated, many of the excited states, in particular those located near the absorption maximum, remain delocalized over several bases
57, 58
. The same theoretical studies showed that delocalization of the excitation does not induce large spectral shifts with respect to the spectra of non interacting monomers 57, 58. Burin et al. showed that the dipolar coupling within DNA hairpins 61 composed of adenine-thymine pairs can be deduced from their absorption spectra62.
Finally, theoretical calculation performed by quantum chemical methods for smaller systems than those studied by the exciton theory, also reported delocalization of the * transitions over two or more bases as well as mixing among * and charge transfer excitons
63-67
.
5 Fluorescence of monomeric chromophores
5.1 Steady-state measurementsFew studies have been consecrated to the steady-state fluorescence properties of the natural DNA bases in recent years. In 2002, we published refined room-temperature fluorescence spectra of the eight natural DNA nucleosides and nucleotides in water 5. Those of dA, dG, dT, dC and 5MedC in water are shown in Figure 1 and the corresponding peak positions are given in Table 1. In contrast to the spectra published up to 2000, which were restricted to the near UV and blue region, the spectra in Figure 1 are extended further into the visible.
We determined the quantum yields using the fluorescence spectra recorded over the whole visible spectral region and compared their values with earlier ones 5. The fluorescence quantum yield values thus obtained were systematically higher than earlier ones and are given in Table 1. It is worth noting that the fluorescence quantum yields are nearly the same for the purine nucleosides and nucleotides. In the case of the pyrimidines, nucleotides have clearly higher quantum yields than the corresponding nucleosides. This shows that the phosphate moieties affect the excited state deactivation processes to a certain extent, but the exact details remain unknown.
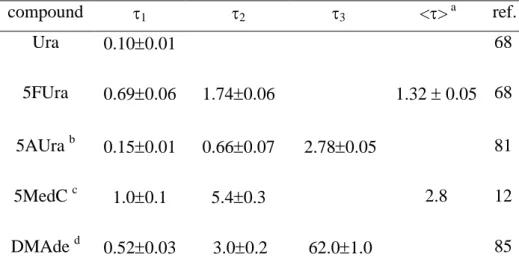
Covalent substitutions have strong effects on the fluorescence properties. This is shown in a striking manner by methylation of the various bases. For 5MedC, the fluorescence peak value was found to be shifted by 14 nm to the red and the fluorescence quantum yield increased by a factor of six compared to dC 12. The effect of methylation, as well as other subsitutions, were also reported in a systematic study of various uracils in reference 68. Uracil itself has the lowest fluorescence quantum yield of all DNA/RNA bases. For 5-methyluracil (thymine), the quantum yield increases by a factor of 3 and for 5-fluorouracil (5FUra) it increases by another factor of two. Furthermore, the maxima of the emission spectra are correlated with the quantum yields; for uracil it is blue-shifted with regard to thymine, while for 5FUra it is red-shifted. This indicates that the emitting state is deactivated faster than its energetic relaxation 68.
5.2 Time-resolved measurements 5.2.1 Natural DNA bases
Since 2000, numerous ultrafast spectroscopic studies in solution have contributed largely to characterize the fluorescence decays of the DNA monomeric chromophores. These studies have established that the excited state decays are globally sub-picosecond, even though there are differences from one system to another. In the large majority of cases, the decays have been measured close to the fluorescence maximum, i.e. 330 nm in spite of the fact that, as mentioned above, the steady-state fluorescence extends well into the visible region. Visible wavelengths have only been probed in a few cases, showing that the fluorescence decays are ultrafast all over the spectral domain.
Peon and Zewail were the first to publish femtosecond fluorescence measurements of DNA/RNA nucleosides and nucleotides in room-temperature water solution using fluorescence upconversion 9. They reported that all fluorescence decays are sub-picosecond and monoexponential. The latter fact that was later revised 69.
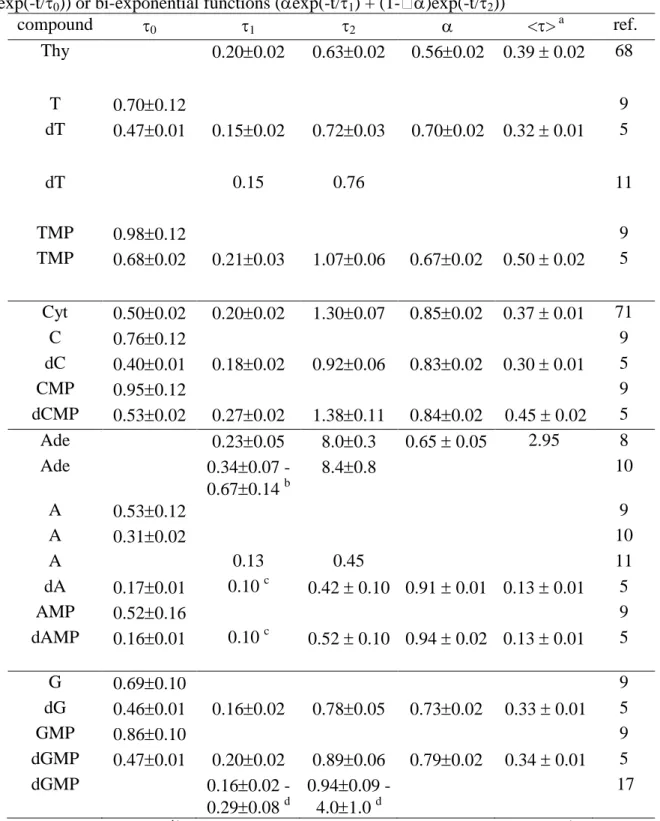
We have, in a series of papers, refined the study of fluorescence from DNA monomeric constituents using femtosecond fluorescence upconversion 5, 8, 17, 68, 70, 71. A general feature for all molecules is that the fluorescence decay is strongly non-exponential. This is exemplified in Figure 5, where the fluorescence decay of dTMP at 330 nm is shown over 7 ps, covering three decades in intensity. Also shown in this figure are the resulting curves from fitting with mono- and bi-exponential model functions.
Normalized fluorescence decays for the four mononucleotides at 330 nm are shown in Figure 6. All these siglals were obtained with an apparatus function of 325 fs (fwhm).
Regarding the two pyrimidine chromophores, there are only small variations between the fluorescence decays of the base, the nucleoside and the nucleotide 5, 18, 68, 70, 71. The non-exponential decays are all dominated by an ultrafast component, between 150 and 300 femtoseconds and a slower one of ca. 1 ps having much lower amplitude (Table 1). In their broadband femtosecond Kerr-gate study of thymidine, Kwok et al. evoked the existence of a "doorway" state facilitating excited state deactivation 18. This "doorway" state should mainly be 1n but mix with the close-lying 1* states.
The fluorescence decay of adenine is characterized by an exceptionally long component of about 8 ps and a faster one of about 0.2 ps 5, 8, 72. The long component was assigned to the 7H tautomer, while the fast component was assigned to the canonical 9H tautomer. The simultaneous presence of two tautomers has only been observed in the case of adenine but not for dA and dAMP. The latter exist only in their 9H form and displays much faster fluorescence decays. Temps and coworkers studied adenine and adenosine by fluorescence upconversion using a tunable excitation source 72. For the 9H-adenine tautomer, they found the decays to vary significantly with the excitation wavelength. This was explained by the opening of an additional non-radiative decay channel with decreasing excitation wavelength, possibly involving a near-lying n* state. For adenosine, on the other
hand, they found a mono-exponential decay for all excitation wavelengths. Kwok et al. studied the adenosine fluorescence by a broadband femtosecond Kerr-gated technique 11. Analysis of the fluorescence decays gave two components with lifetimes of ~0.13 ps and ~0.45 ps which were associated these with the La and Lb1* excited states, respectively. The
0.13 ps time constant was proposed to correspond to the La - Lb internal conversion. This is in
line with an interpretation based on the Strickler-Berg equation, suggesting that both 1* excited states contribute to the fluorescence of these chromophores 73. However, the very low initial value (0.25) and the lack of any rapid decay of fluorescence anisotropy 5 clearly shows that the La - Lb relaxation is too fast (<< 100 fs) to contribute to the emission of dA/dAMP.
This is corroborated by the fact that the steady-state emission spectra are independent of the excitation wavelength 5.
Regarding the guanine chromophore, there are only data for the nucleoside and the nucleotide since guanine itself is not soluble enough in water. As their steady-state fluorescence spectra are by far the broadest, extending beyond 700 nm 5, we performed an extensive study of the dGMP fluorescence at various emission wavelengths 17. The fluorescence decays were found to depend strongly on the wavelength, indicating important spectral shifts (Figure 7). Incompatible with solvation dynamics, a global analysis revealed that the spectral evolution can be explained by an ultrafast red-shift and broadening, in accordance with a recent theoretical study 74. As in the case of dAMP, dGMP emission originates only from the first excited state.
The non-exponentiality of the fluorescence decays was rationalized as arising from two different "regions" of the potential energy surface of the first * state 68, 74. The fast component should then correspond to the Franck-Condon region while the longer one should be correlated with a “relaxed” geometry along the reaction coordinate towards a conical intersection.
On Table 2, we have assembled fitted time constants from recent measurements of fluorescence decays at 330 nm of the four nucleotides.
5.2.2 Role of substituents
In addition to the natural DNA bases mentioned above, the fluorescence of various substituted bases has been studied by ultrafast spectroscopy. The objective was to elucidate conformational and electronic changes occurring during excited state relaxation in close connexion with theoretical studies. Among the possible substitutions the most important one is without doubt methylation, which also occurs naturally. For example, thymine is just the 5-methylated form of the RNA base uracil.
The average fluorescence lifetime of 5MedC is longer about one order of magnitude compared to that of dC 12 (Figure 8b). Contrary to dC, the fluorescence decays of 5MedC depend strongly on the wavelength, indicating important spectral shifts.
We have paid special attention on the fluorescence of uracil and its derivatives 68, 75-77. The effect of methylation, halogenation as well as that of other substituents on the first excited * and n singlet states were investigated by combining femtosecond fluorescence spectroscopy and quantum chemistry calculations 78. The analysis relied heavily on TD-DFT calculations, described below. Uracil itself has the fastest fluorescence decay observed for any nucleic acid. It is shorter than the time resolution (100 fs) of the FU setup. In contrast to methylation at the 5 position, methylation of uracil at positions 1, 3, 6 does not induce any observable change on the fluorescence decays 78. An example is given in Figure 8a, where the fluorescence decays of uracil and thymine are compared. These results, obtained with femtosecond resolution, contrast with those obtained for a "blocked" uracil (5,6-trimethyleneuracil) by a TCSPC study combined with quantum chemistry calculations 79, 80 indicating that the 6-substituent is also involved in the internal conversion mechanism.
According to these studies, the 5 and 6 substituents flip out of the molecular plane in opposite directions forming a biradical state.
Focusing on the 5 substituent, it was found that the fluorescence lifetime depends on its chemical nature 78. The longest lifetime was observed for 5-fluorouracil. A particular behavior was observed in the case of the amino group 81. While amino substitution on the 6 position has no effect at all, amino substitution on the 5-position (5-aminouracil, 5AUra) causes a drastic increase in lifetime. The fluorescence decays of 5AUra depend strongly on the emission wavelength.
As noted in the preceding sub-section, the adenine chromophore has the shortest fluorescence lifetime of the natural DNA constituents. However, slight structural changes may have enormous consequences on the electronic structure and thus the fluorescence properties. A striking example is provided by 2-aminopurine, which contrary to adenine (6-aminopurine) is highly fluorescent with a lifetime of about 12 ns 82, 83. Being a structural analog to adenine, it can replace the latter in stacked structures and form Watson-Crick base pairs with thymines allowing incorporation in the DNA double helix. Zewail and coworkers studied 2-aminopurine in water and in ethanol by fluorescence upconversion, focusing on the early time evolution69. They observed important dynamical spectral shifts assigned to solvation dynamics.
Schwalb and Temps have published detailed FU studies of DMAdenine 84, 85. This molecule presents dual fluorescence, covering the whole visible region. A global analysis of fluorescence decays between 290 and 650 nm enabled the authors to distinguish 5 different time constants from below 100 fs to 62 ps.
On Table 3, we have assembled fluorescence lifetimes of substituted DNA bases. 5.2.3 Solvent effects
Until recently, the solvent effects on the excited state dynamics of DNA and its constituents were described as quite modest 3. This statement was based on the fact that the excited state lifetimes are actually faster than the solvent response. This may be true for "slower" solvents such as alcohols, but for water, the solvation dynamics is actually too fast for the time resolution available with existing experimental setups. For many modified bases, on the other hand, important spectral shifts have been observed. However, the role of the solvent is not limited to its dynamical response. It can also influence the energetic ordering of the excited states, and thus the intramolecular dynamics.
We studied solvent effects on the fluorescence properties of chosen uracils 75-77, 86. An example is given in Figure 9, where the fluorescence decays of 5-fluorouracil in acetonitrile, methanol and water are compared. The fastest decays are observed in acetonitrile and the slowest in aqueous solution while those observed in alcohols are intermediate.
In a FU study of isolated guanosine-cytosine basepairs in chloroform solution after 283 nm excitation, Schwalb and Temps also gave lifetimes of the individual chromophores 87. Since these "nucleosides" were modified with a tert-butyldimethylsilyl group instead of the deoxyribose group, some caution has to be made when comparing with aqueous solution data. The measured decays are dominated by a sub-picosecond component followed by a small amplitude longer component. The sub-picosecond components, 0.67 ps for dC and 0.84 ps for dG are fairly close to the fluorescence lifetimes measured in water solution. The longer components were assigned to n* state emission, since this state is less destabilized in chloroform than in aqueous, and thus may be on the same level as or below the directly excited * state. In a subsequent study of DMAdenine 84, 85, they found that the lifetime of the intermolecular excited charge transfer state is much longer for dioxane solutions (1.4 ns) than that in aqueous solutions (62 ps).
The ultrafast fluorescence decays of the DNA bases are due to highly efficient nonradiative processes occurring in the first excited singlet state. The detailed understanding of these nonradiative relaxation processes constitutes a major challenge from a theoretical point of view, and an increasing number of quantum chemistry calculations have addressed this problem for uracil/thymine 68, 78, 80, 88-96, cytosine79, 91, 97-105, adenine 65, 89, 106-121 and guanine 74, 122-132.
The picture emerging is that the ultrafast decay of the excited state is due to highly efficient conical intersections (CI) between the first singlet * state and the ground state. These CI are related to important geometrical changes occurring in the fluorescent 1* state, but the actual geometries involved differ from one molecule to the other. Complicating the picture even more is the fact that fluorescence only probes the first excited 1* state, but the calculated deactivation processes often involve near-lying dark states of 1n* character. Most theoretical work has been performed for molecules in vacuo, while this Chapter focuses on fluorescence of solutions. Evidently, the relative energy ordering of the 1* and 1n* states is very sensitive to the environment, wherefore it is not always possible to compare theory and experiment. In general the 1n* states are strongly destabilized in aqueous solution and contribute less to the excited state dynamics. An instructive comparison, from a theoretical point of view, of the nonradiative processes involved in the excited state deactivation for the five DNA/RNA bases has recently been given by Serrano-Andres and Merchán 133.
Finally, it should be mentioned that transient absorption experiments probing from the UV to the IR spectral domains have provided complementary information on the excited state relaxation 4, 134-137.
6 Fluorescence of DNA helices
The fluorescence properties change dramatically when we go from monomeric chromophores to multichromophoric systems. This is reflected both in the fluorescence decays and the fluorescence anisotropies. The latter were used to evidence transfer of the excitation energy among the bases of duplexes occurring before conformational changes. Therefore, we first describe this aspect, taking place on the femtosecond time-scale, and we continue with the fluorescence decays which extend up to the nanosecond time-scale.
6.1
Energy transferWe have seen in Section 4 that the electronic coupling is capable of inducing delocalisation of the Frank-Condon excited states within DNA double helices. According to this model, each eigenstate has its own spatial characteristics determined by the electronic transitions of the bases participating to the eigenstate. In the studies performed in the frame of exciton theory
55-58
, the eigenstate topography was given by the square of the coefficients (Cik,m). The latter
depend on the conformation of the duplex which determines the strength of the electronic coupling. As an example, Figure 10 shows the topography corresponding to one eigenstate of (dCdG)5·(dCdG)5 averaged over 100 conformations58. Different eigenstates have different
topographies56-58. Therefore, it is expected that population of an upper eigenstate and subsequent internal conversion will result in a transfer of the excitation energy within the helix, which is known as intraband scattering.
As the polarization of the electronic transitions associated with the various eigenstates of a duplex are also different, intraband scattering should lead to a loss of fluorescence anisotropy. But molecular motions may produce the same effect. Therefore, in order to detect energy transfer one has to probe fluorescence anisotropy on early times, when molecular motions have not the time to occur, in particular for large systems.
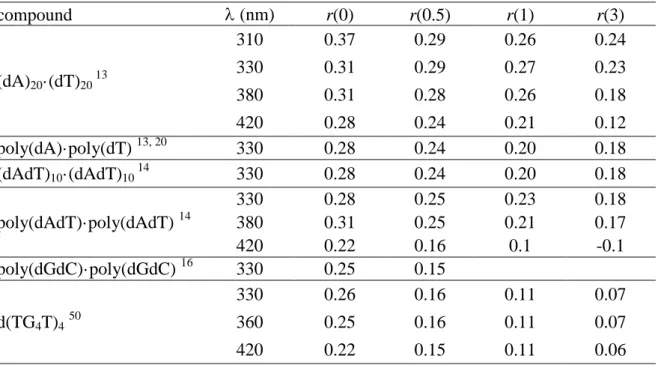
We determined the fluorescence anisotropy decays of DNA duplexes and G-quadruplexes using fluorescence upconversion (Section 2) and compared them with the anisotropy decays corresponding to a stoichiometric mixture of non interacting nucleotides
13-16, 20
. Table 5 shows some typical anisotropy values obtained from these experiments. We found that the fluorescence anisotropy of all the studied duplexes decays more rapidly than that of non-interacting chromophores whose size is much smaller. These results reveal that energy transfer takes indeed place within the helices on the sub-picosecond time-domain.
More important, the anisotropy values detected for double helices are lower than that of the nucleotide mixture already at zero time which means that the onset of energy transfer occurs at times shorter than the 100 fs, time-resolution of our setup. Such an ultrafast energy transfer cannot take place via Förster transfer considering, in particular, the very large Stokes shift associated with the monomeric chromophores (Figure 1).
Ultrafast energy transfer takes also place in the case of self-associated guanines50. Figure 11 shows the anisotropy decay determined for self-associated triguanosine monophosphates, likely to form four-stranded structures49 composed of only one type of chromophore. Their fluorescence anisotropy is already lower than that of dGMP at zero time. Moreover, at 1 ps it dwindles down to 0.02 whereas that of the mononucleotides remains higher than 0.10.
Energy transfer, possibly assisted by conformational motions, may continue on longer time-scales, until the whole population of the excited states relaxes to the ground state.
6.2 Fluorescence decays
The fluorescence decays of DNA helices recorded by FU slow down upon increasing the emission wavelength. At least two time constants, whose values vary with the emission wavelength, are necessary in order to fit the decays with exponential functions. This is not surprising for such multichromophoric systems, knowing that even the fluorescence decays of
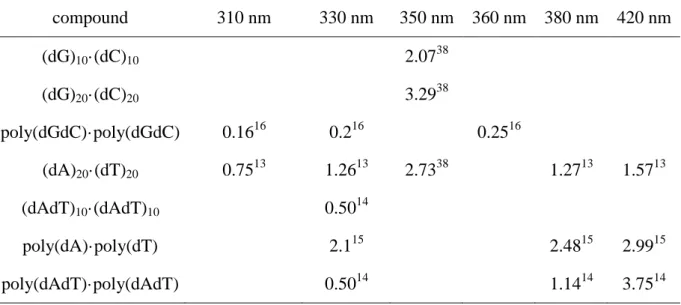
the monomeric chromophores cannot be described by single exponentials (Section 5). Again here, the average lifetime <> is used in order to evaluate the sequence effect on the fluorescence decays. Table 4 shows the <> values determined for various model systems.
The lifetimes of the single strands containing only one type of base are all longer than those of the corresponding nucleotides. The most important lengthening is encountered in the case of adenine and, even more, of guanine strands. For these systems, the fluorescence decays slow down with increasing the number of bases38. We recall that guanine single strands have the propensity to self-associate but so far only one system characterized by a well-defined quadruplex structure was studied. This is formed by association of four single strands d(TGGGGT); its FU decay is presented in Figure 12 together with those of TMP and dGMP50.
A noticeable size effect is also reported for homopolymeric duplexes composed of adenine-thymine pairs, the oligomer (dA)20·(dT)20 and the polymer poly(dA)·poly(dT) (ca.
2000 base pairs)13. Not only is the lifetime at the fluorescence maximum longer when going from the oligomer to the polymer, but the fluorescence anisotropy also decays faster indicating a more efficient energy transfer. Moreover, the changes in the oscillator strength become larger and the maxima of the steady-state absorption and emission spectra shift to slightly higher energies. All these effects are the fingerprints of a collective behavior becoming more pronounced as structural disorder diminishes with increasing size. The size effect on the fluorescence decays of alternating adenine-thymine duplexes is less pronounced
14
. However, even here the fluorescence anisotropy decays more rapidly for the polymer compared with the oligomer. For the latter, a combined broad-band time-resolved fluorescence and transient absorption study suggested the existence of an intermediate weakly emitting species19.
Focusing on the polymeric duplexes, the FU decays recorded at 330 nm, which corresponds to the maximum of their spectra recorded at 0.2 ps, exhibit a clear sequence effect138. The decays of poly(dA)·poly(dT), poly(dAdT)·poly(dAdT) and poly(dGdC)·poly(dGdC) are successively longer, equal and shorter than those of an equimolar mixture of the constitutive nucleotides. An acceleration of the excited state dynamics was also found upon formation of isolated Watson-Crick guanine-cytosine pairs dissolved in chloroform87. These data were correlated with theoretical calculations which pointed out the role of interbase proton transfer139-141.
The introduction of guanine-cytosine pairs in homopolymeric purine-pyrimidine oligomeric duplexes leads to a decrease of the FU lifetimes38. Nevertheless, when the guanine/adenine ratio increases a more complex behavior is observed, assigned to important structural changes.
In contrast to the monomeric chromophores, fluorescence emission of DNA helices contains long-lived components. Already described in earlier studies27, 142, they have been revisited recently in combination of FU and TCSPC measurements. As in the case of FU, TCSPC signals exhibit strong wavelength and sequence dependence 15, 21. This is also true for the double strand poly(dG5MedC)
.
poly(dG5MedC)22. For all the studied systems, fits of the fluorescence decays with multi-exponential functions gave time constants amounting up to a few nanoseconds and contributing to the signal with weak amplitude.Extended time-resolved investigations were carried out for the duplex poly(dA)·poly(dT). A non-linear fitting/deconvolution procedure was performed by merging the data obtained by FU and TCSPC. Then, using the parameters derived from this global fit, the percentage of the emitted photons per decade of time was calculated for various wavelengths. Figure 13 shows the time distribution of the photons emitted at 330 and 420 nm up to 10 ns together with the steady-state fluorescence spectrum. We remark that near the
emission maximum most of the photons are emitted between 1 and 10 ps whereas the red tail of the spectrum is dominated by photons emitted at times longer than 1ns.
The identification of the various emitting states of DNA helices is an intricate problem. The time constants derived from the fits with multi-exponential functions, used in order to quantify the fluorescence decays, are not necessarily associated with precise excited states. As mentioned previously, a large multitude of excited states may exist for a given DNA helix, governed by electronic coupling and associated with the various conformations: * states localized on a single base, Frenkel excitons delocalized over a few bases, charge transfer states, n* states135, 143, as well as combinations among them. The situation becomes even trickier due to the excitation energy transfer processes. In this respect, it is important to stress that, when energy transfer takes place within a low dimensional multichromophoric system, the time-constants derived from fits with multi-exponential functions do not have physical meaning.144 However, the change of the fluorescence anisotropy decays as a function of the emission wavelength observed for the same excitation wavelength13, 14 clearly shows the existence of a variety of bright emitting states.
The great complexity of the fluorescence decays and fluorescence anisotropy decays observed for DNA helices contrasts with the relative simplicity of the transient absorption signals. In the latter case, only two time-constants, assigned to localized * excited states intrastrand excimers4, 36, 37 were determined in most studies. Yet, the fingerprint of Frenkel excitons, living a few ps and depending of the size of the helix, was reported in a transient absorption study 145.
7 Concluding remarks
We have described above how sophisticated spectroscopic measurements have been performed during the past few years for DNA components despite the extremely weak
fluorescence quantum yields. By following specific and rigorous experimental protocols, these measurements have started to unravel the very complex mechanisms which govern the excited state dynamics.
Evidently, the experimental work has to be supported by theoretical calculations. This is relatively easier for the monomeric chromophores, even if modeling solvent effects correctly is not an easy task and more efforts are still needed. Modeling excited state relaxation gets much trickier in the case of model helices for which two different approaches have been followed so far. On the one hand, quantum chemical calculations performed for small systems taking into account orbital overlap and solven 6566. On the other, calculations in the frame of the exciton theory, neglecting orbital overlap but studying larger systems 146. Ideally, the combination of both methods is necessary and can be done properly only in close connection with the experiments.
Collecting detailed experimental data such as fluorescence decays, fluorescence anisotropy decays and time-resolved fluorescence spectra recorded over several decades of time will be a decisive step. Needless to say this has not yet been realized for any DNA strand, but we are fairly optimistic that this is now within reach. Modification of various parameters such as the ionic strength, the size of the helix or the base sequence, known to induce conformational changes, are expected to provide precious additional information. Finally, investigation of nucleosomes (DNA - histones complexes) will provide certainly a more biologically relevant picture. This poses many problems from experimental point of view and constitutes a real challenge.
REFERENCES
1 P. Vigny, C. R. Acad. Sci. Paris, 1971, 272 D, 3206-3209. 2 M. Daniels and W. Hauswirth, Science, 1971, 171, 675-677.
3 C. E. Crespo-Hernàndez, B. Cohen, P. M. Hare and B. C. R. Kohler, Chem. Rev., 2004, 104, 1977–-2019.
4 C. T. Middelton, K. de La Harpe, C. Su, U. K. Law, C. E. Crespo-Hernàndez and B. Kohler,
Ann. Rev. Phys. Chem., 2009, 60, 13-47.
5 D. Onidas, D. Markovitsi, S. Marguet, A. Sharonov and T. Gustavsson, J. Phys. Chem. B, 2002, 106, 11367- 11374.
6 R. A. Velapoldi and K. D. Mielenz, A fluorescence standard reference material: quinine
sulfate dihydrate, U. S. Government Printing Office, Washington, D. C., Washington, 1980.
7 N. Nijegorodov and R. Mabbs, Spectrochimica Acta Part A, 2000, 56A, 2157- 2166.
8 T. Gustavsson, A. Sharonov, D. Onidas and D. Markovitsi, Chem. Phys. Lett., 2002, 356, 49-54.
9 J. Peon and A. H. Zewail, Chem. Phys. Lett., 2001, 348, 255-262.
10 T. Pancur, N. K. Schwalb, F. Renth and F. Temps, Chem. Phys., 2005, 313, 199-212. 11 W.-M. Kwok, C. Ma and D. L. Phillips, J. Am. Chem. Soc., 2006, 128, 11894-11905. .
12 A. Sharonov, T. Gustavsson, S. Marguet and D. Markovitsi, Photochem. Photobiol. Sci., 2003,
2, 362-364.
13 D. Onidas, T. Gustavsson, E. Lazzarotto and D. Markovitsi, J. Phys. Chem. B, 2007, 111, 9644-9650.
14 D. Onidas, T. Gustavsson, E. Lazzarotto and D. Markovitsi, Phys. Chem. Chem. Phys., 2007,
9, 5143-5148.
15 D. Markovitsi, T. Gustavsson and F. Talbot, Photochem. & Photobiol. Sci., 2007, 717 - 724. 16 F. A. Miannay, A. Banyasz, T. Gustavsson and D. Markovitsi, J. Am. Chem. Soc., 2007, 129, 14574-14575.
18 W. M. Kwok, C. Ma and D. L. Phillips, J. Am. Chem. Soc., 2008, 130, 5131-5139. 19 W. M. Kwok, C. S. Ma and D. L. Phillips, J. Phys. Chem. B, 2009, 113, 11527-11534.
20 D. Markovitsi, D. Onidas, T. Gustavsson, F. Talbot and E. Lazzarotto, J. Am. Chem. Soc., 2005, 127, 17130-17131.
21 D. Markovitsi, F. Talbot, T. Gustavsson, D. Onidas, E. Lazzarotto and S. Marguet, Nature, 2006, 441, E7.
22 M. Daniels, L. P. Hart, P. S. Ho, J. P. Ballini, P. Vigny and J. C. Brochon, Photochem. &
Photobiol. Sci., 2007, 6, 883-893.
23 T. Fujiwara, Y. Kamoshida, R. Morita and M. Yamashita, Journal of Photochemistry and
Photobiology B: Biology, 1997, 41, 114-121.
24 D. Markovitsi, D. Onidas, F. Talbot, S. Marguet, T. Gustavsson and E. Lazzarotto, J.
Photochem. Photobiol. A: Chem., 2006, 183, 1-8.
25 H. Görner, J. Photochem. Photobiol. B: Biol., 1994, 26, 117-139.
26 J. Cadet, M. Berger, T. Douki, B. Morin, R. S., J. L. Ravanat and S. Spinelli, Biol. Chem., 1997, 378, 1275-1286.
27 J. Cadet and P. Vigny, in Bioorganic Photochemistry, ed. H. Morrison, John Wiley & Sons, New York, 1990, pp. 1-272.
28 Q. Zhu and P. R. LeBreton, J. Am. Chem. Soc., 2000, 122, 12824-12834.
29 S. Marguet, D. Markovitsi and F. Talbot, J. Phys. Chem. B, 2006, 110, 11037-11039.
30 L. Colon, C. E. Crespo-Hernandez, R. Oyola, C. Garcia and R. Arce, J. Phys. Chem. B, 2006,
110, 15589-15596.
31 L. P. Candeias, P. O'Neill, G. D. D. Jones and S. Steenken, Int. J. Radiat. Biol., 1992, 61, 15-20.
32 L. P. Candeias and S. Steenken, J. Am. Chem. Soc., 1989, 111, 1094-1099. 33 L. P. Candeias and S. Steenken, J. Am. Chem. Soc., 1992, 114, 699-704.
34 J. Blais, T. Douki, P. Vigny and J. Cadet, Photochem. Photobiol., 1994, 59, 402-404.
36 C. E. Crespo-Hernández, B. Cohen and B. Kohler, Nature, 2005, 436, 1141-1144.
37 K. de La Harpe, C. E. Crespo-Hernàndez and B. Kohler, ChemPhysChem, 2009, 10, 1421-1425
38 N. K. Schwalb and F. Temps, Science, 2008, 322, 243-245.
39 A. Holmén, A. Broo, B. Albinsson and B. Nordén, J. Am. Chem. Soc., 1997, 119, 12240-12250.
40 A. C. Borin, L. Serrano-Andres, M. P. Fulscher and B. O. Roos, J. Phys. Chem. A, 1999, 103, 1838-1845.
41 L. Serrano-Andrés and M. Merchán, Journal of Photochemistry and Photobiology C:
Photochemistry Reviews, 2009, 10, 21-32.
42 J. R. Platt, J. Chem. Phys., 1949, 17, 484-495.
43 W. Dean, F. Sandos, S. Miodrag, V. Zakhartchenko, J. Walter, E. Wolf and W. Reik, Proc.
Natl. Acad. Sci. USA, 2001, 98, 13734-13738.
44 Y.-H. You and G. P. Pfeifer, J. Mol. Biol., 2001, 305, 389-399. 45 E. B. Starikov, Modern Phys. Lett. B, 2004, 18, 825-831.
46 D. Varsano, R. Di Felice, M. A. L. Marques and A. Rubio, J. Phys. Chem. B, 2006, 110, 7129-7138.
47 F. Santoro, V. Barone and R. Improta, ChemPhysChem, 2008, 9, 2531-2537.
48 J. L. Mergny, A. De Cian, A. Ghelab, B. Sacca and L. Lacroix, Nucleic Acids Res., 2005, 33, 81-94.
49 D. Markovitsi, T. Gustavsson and A. Sharonov, Photochem. Photobiol., 2004, 79, 526-530. 50 F. A. Miannay, A. Banyasz, T. Gustavsson and D. Markovitsi, J. Phys. Chem. C, 2009, 113, 11760-11765.
51 E. I. Rashbah and M. D. Sturge, Excitons, North-Holland, Amsterdam, 1982.
52 M. Kasha, H. R. Rawls and M. A. El-Bayoumi, Pure & Appl. Chem., 1965, 11, 371-392. 53 I. Tinoco Jr., J. Am. Chem. Soc., 1960, 82, 4785-4790.
56 B. Bouvier, J. P. Dognon, R. Lavery, D. Markovitsi, P. Millié, D. Onidas and K. Zakrzewska,
J. Phys. Chem. B, 2003, 107, 13512-13522.
57 E. Emanuele, D. Markovitsi, P. Millié and K. Zakrzewska, ChemPhysChem, 2005, 6, 1387-1392.
58 E. Emanuele, K. Zakrzewska, D. Markovitsi, R. Lavery and P. Millie, J. Phys. Chem. B, 2005,
109, 16109-16118.
59 P. Dean, Rev. Mod. Phys., 1972, 44, 127-169.
60 M. Schreiber and Y. Toyosawa, J. Phys. Soc. Jpn., 1982, 51, 1537-1543.
61 D. F. Lewis, X. Liu, Y. Wu and X. Zuo, J. Am. Chem. Soc., 2003, 125, 12729-12731.
62 A. L. Burin, J. A. Dickman, D. B. Uskov, C. F. F. Hebbard and G. C. Schatz, J. Chem. Phys., 2008, 129.
63 E. B. Starikov, J. P. Lewis and O. F. Sankey, Intern. J. Modern Phys. B, 2005, 19, 4331-4357. 64 E. B. Starikov, G. Cuniberti and S. Tanaka, J. Phys. Chem. B, 2009, 113, 10428.
65 F. Santoro, V. Barone and R. Improta, Proc. Natl. Acad. Sci., 2007, 104, 9931-9936. 66 F. Santoro, V. Barone and R. Importa, J. Am. Chem. Soc., 2009, 131, 15232-15245. 67 A. W. Lange and J. M. Herbert, J. Am. Chem. Soc., 2009, 131, 3913.
68 T. Gustavsson, A. Banyasz, E. Lazzarotto, D. Markovitsi, G. Scalmani, M. J. Frisch, V. Barone and R. Improta, J. Am. Chem. Soc. , 2006, 128, 607-619.
69 S. K. Pal, J. Peon and A. H. Zewail, Chem. Phys. Lett., 2002, 363, 57-63.
70 T. Gustavsson, A. Sharonov and D. Markovitsi, Chem. Phys. Lett., 2002, 351, 195-200. 71 A. Sharonov, T. Gustavsson, V. Carré, E. Renault and D. Markovitsi, Chem. Phys. Lett., 2003,
380, 173-180.
72 T. Pancur, F. Renth, F. Temps, B. Harbaum, A. Kruger, R. Herges and C. Nather, Phys. Chem.
Chem. Phys., 2005, 7, 1985-1989.
73 B. Cohen, C. E. Crespo-Hernández and B. Kohler, Faraday Discussions Chem. Soc., 2004,
127, 137-147.
75 T. Gustavsson, N. Sarkar, E. Lazzarotto, D. Markovitsi, V. Barone and R. Improta, J. Phys.
Chem. B, 2006, 110, 12843-12847.
76 T. Gustavsson, N. Sarkar, A. Banyasz, D. Markovitsi and R. Improta, Photochem. Photobiol., 2007, 83, 595-599.
77 T. Gustavsson, N. Sarkar, E. Lazzarotto, D. Markovitsi and R. Improta, Chem. Phys. Lett., 2006, 429, 551-557.
78 F. Santoro, V. Barone, T. Gustavsson and R. Improta, J. Am. Chem. Soc., 2006, 128, 16312-16322.
79 M. Z. Zgierski, T. Fujiwara, W. G. Kofron and E. C. Lim, Phys. Chem. Chem. Phys., 2007, 9, 3206 - 3209.
80 M. Z. Zgierski, S. Patchkovskii, T. Fujiwara and E. C. Lim, J. Phys. Chem. A, 2005, 109, 9384 - 9387.
81 A. Bányász, T. Gustavsson, E. Keszei, R. Improta and D. Markovitsi, Photochem. Photobiol.
Sci., 2008.
82 A. Holmén, B. Nordén and B. Albinsson, J. Am. Chem. Soc., 1997, 119, 3114-3121.
83 R. K. Neely, S. W. Magennis, D. T. F. Dryden and A. C. Jones, J. Phys. Chem. B, 2004, 108, 17606-17610.
84 N. K. Schwalb and F. Temps, Phys. Chem. Chem. Phys., 2006, 8, 5229 - 5235. 85 N. K. Schwalb and F. Temps, J. Phys. Chem. A, 2009, 113, 13113-13123.
86 T. Gustavsson, A. Bányász, N. Sarkar, D. Markovitsi and R. Improta, Chem. Phys., 2008, 350, 186–192.
87 N. Schwalb and F. Temps, J. Am. Chem. Soc., 2007, 129, 9272-9273. 88 S. Matsika, J. Phys. Chem. A, 2004, 108, 7584-7590.
89 S. Matsika, J. Phys. Chem. A, 2005, 109, 7538-7545.
90 E. Epifanovsky, K. Kowalski, P. D. Fan, M. Valiev, S. Matsika and A. I. Krylov, J. Phys.
Chem. A, 2008, 112, 9983-9992.
92 H. R. Hudock, B. G. Levine, A. L. Thompson, H. Satzger, D. Townsend, N. Gador, S. Ullrich, A. Stolow and T. J. Martinez, J. Phys. Chem. A, 2007, 111, 8500-8508.
93 R. Improta and V. Barone, J. Am. Chem. Soc., 2004, 126, 14320-14321.
94 R. Improta, V. Barone, A. Lami and F. Santoro, Journal of Physical Chemistry B, 2009, 113, 14491-14503.
95 G. Zechmann and M. Barbatti, J. Phys. Chem. A, 2008, 112, 8273-8279.
96 J. J. Szymczak, M. Barbatti, J. T. S. Hoo, J. A. Adkins, T. L. Windus, D. Nachtigallova and H. Lischka, J. Phys. Chem. A, 2009, 113, 12686-12693.
97 M. Z. Zgierski, S. Patchkovskii and E. C. Lim, J. Chem. Phys., 2005, 123, 081101-081104. 98 M. Z. Zgierski and S. Alavi, Chem. Phys. Lett., 2006, 426, 398-404.
99 L. Blancafort and M. A. Robb, J. Phys. Chem. A, 2004, 108, 10609-10614.
100 L. Blancafort, B. Cohen, P. M. Hare, B. Kohler and M. A. Robb, J. Phys. Chem. A, 2005, 109, 4431-4436.
101 L. Blancafort, Photochem. Photobiol., 2007, 83, 603-610.
102 L. Blancafort and A. Migani, J. Photochem. Photobiol. A: Chem., 2007, 190, 283-289. 103 K. A. Kistler and S. Matsika, J. Phys. Chem. A, 2007, 111, 8708-8716.
104 K. A. Kistler and S. Matsika, J. Phys. Chem. A, 2009, 113, 12396-12403. 105 H. R. Hudock and T. J. Martinez, ChemPhysChem, 2008, 9, 2486-2490.
106 C. M. Marian, M. Kleinschmidt and J. Tatchen, Chem. Phys., 2008, 347, 346-359. 107 C. M. Marian, J. Chem. Phys., 2005, 122, 104314.
108 C. Marian, D. Nolting and R. Weinkauf, Phys. Chem. Chem. Phys., 2005, 7, 3306 - 3316. 109 S. B. Nielsen and Theis I. Sølling, ChemPhysChem, 2005, 6, 1276-1281.
110 S. Perun, A. L. Sobolewski and W. Domcke, Chem. Phys., 2005, 313, 107-112.
111 S. Perun, A. L. Sobolewski and W. Domcke, J. Am. Chem. Soc., 2005, 127, 6257 -6265. 112 L. Blancafort, J. Am. Chem. Soc., 2006, 128, 210-219.
113 L. Serrano-Andres, M. Merchán and A. C. Borin, Chem. Eur. J., 2006, 12, 6559-6571.
115 M. Barbatti and H. Lischka, J. Phys. Chem. A, 2007, 111, 2852-2858.
116 W. C. Chung, Z. Lan, Y. Ohtsuki, N. Shimakura, W. Domcke and Y. Fujimura, Phys. Chem.
Chem. Phys., 2007, 9, 2075-2084.
117 S. Yamazaki and S. Kato, J. Am. Chem. Soc., 2007, 129, 2901-2909.
118 C.-H. Chin, A. M. Mebel, G.-S. Kim, K. Y. Baek, M. Hayashi, K. K. Liang and S. H. Lin,
Chem. Phys. Lett., 2007, 445, 361-369.
119 I. Conti, M. Garavelli and G. Orlandi, J. Am. Chem. Soc., 2009, 131, 16108-16118. 120 R. Improta and V. Barone, Theor. Chem. Acc., 2008, 120, 491-497.
121 Y. B. Lei, S. A. Yuan, Y. S. Dou, Y. B. Wang and Z. Y. Wen, J. Phys. Chem. A, 2008, 112, 8497-8504.
122 H. Langer, N. L. Doltsinis and D. Marx, ChemPhysChem, 2005, 6, 1734-1737. 123 H. Langer and N. L. Doltsinis, Phys. Chem. Chem. Phys., 2004, 6, 2742-2748. 124 H. Langer and N. L. Doltsinis, Phys. Chem. Chem. Phys., 2003, 5, 4516-4518. 125 H. Chen and S. Li, J. Chem. Phys., 2006, 124, 154315.
126 M. Z. Zgierski, S. Patchkovskii, T. Fujiwara and E. C. Lim, Chem. Phys. Lett., 2007, 440, 145-149.
127 C. M. Marian, J. Phys. Chem. A, 2007, 111, 1545-1553.
128 L. Serrano-Andres, M. Merchán and A. C. Borin, J. Am. Chem. Soc., 2008, 130, 2473-2484. 129 S. Yamazaki and W. Domcke, J. Phys. Chem. A, 2008, 112, 7090-7097.
130 S. Yamazaki, W. Domcke and A. L. Sobolewski, J. Phys. Chem. A, 2008, 112, 11965-11968. 131 M. K. Shukla and J. Leszczynski, J. Phys. Chem. B, 2008, 112, 5139-5152.
132 Z. G. Lan, E. Fabiano and W. Thiel, ChemPhysChem, 2009, 10, 1225-1229.
133 L. Serrano-Andrés and M. Merchán, J. Photochem. Photobiol. C: Photochem. Rev., 2009, 10, 21-32.
134 D. N. Nikogosyan, D. Angelov, B. Soep and L. Lindqvist, Chem. Phys. Lett., 1996, 252, 322-326.
136 P. M. Hare, C. E. Crespo-Hernández and B. Kohler, J. Phys. Chem. B, 2006, 110, 18641-18650.
137 D. A. McGovern, G. W. Doorley, A. M. Whelan, A. W. Parker, M. Towrie, J. M. Kelly and S. J. Quinn, Photochem. & Photobiol. Sci., 2009, 8, 542-548.
138 D. Markovitsi and T. Gustavsson, in Energy Transfer Dynamics in Biomaterial Systems ed. I. Burghardt, V. May, D. A. Micha and E. R. Bittner, Springer, Heidelberg/Berlin, 2009, vol. 93.
139 A. L. Sobolewski and W. Domcke, Phys. Chem. Chem. Phys., 2004, 6, 2763-2771.
140 A. L. Sobolewski, W. Domcke and C. Hättig, Proc. Natl. Acad. Sci., 2005, 102, 17903-17906. 141 G. Groenof, L. V. Schäfer, M. Boggio-Pasqua, M. Goette, H. Grubmüller and M. A. Robb, J.
Am. Chem. Soc., 2007, 129, 6812-6819.
142 R. Plessow, A. Brockhinke, W. Eimer and K. Kohse-Höinghaus, J. Phys. Chem. B, 2000, 104, 3695-3704.
143 G. W. Doorley, D. A. McGovern, M. W. George, M. Towrie, A. W. Parker, J. M. Kelly and S. J. Quinn, Ang. Chem.-Intern. Ed. , 2009, 48, 123-127.
144 A. Blumen, J. Klafter and G. Zumofen, in Optical spectroscopy of glasses, ed. I. Zschokke, Reidel Publishing Co., 1986, pp. 199-265.
145 I. Buchvarov, Q. Wang, M. Raytchev, A. Trifonov and T. Fiebig, Proc. Natl. Acad. Sci., 2007,
104, 4794-4797.
TABLE 1: Fluorescence maxima (fl) and quantum yields () of monomeric chromophores in aqueous solution. compound fl (nm) a ×104 r0 ref. dA 307 0.86 0.15 5 dAMP 306 0.68 0.10 0.24 0.01 5 dG 334 0.97 0.08 5 dGMP 334 1.09 0.10 0.15 0.04 5 Thy 329 1.02 0.4 68 dT 330 1.32 0.07 5 TMP 330 1.54 0.11 0.36 0.01 5 dC 328 0.89 0.10 5 dCMP 328 1.15 0.06 0.34 0.01 5 5MedC 342 5.6 0.1 12 Ura 312 0.35 0.4 68 5FUra 335 2.21 0.4 68
TABLE 2: Fluorescence lifetimes (ps) determined at 330 nm of DNA monomeric chromophores in aqueous solution. They were obtained from fits with mono-exponential (exp(-t/0)) or bi-exponential functions (exp(-t/1) + (1-)exp(-t/2))
compound 0 1 2 <> a ref. Thy 0.200.02 0.630.02 0.560.02 0.39 0.02 68 T 0.700.12 9 dT 0.470.01 0.150.02 0.720.03 0.700.02 0.32 0.01 5 dT 0.15 0.76 11 TMP 0.980.12 9 TMP 0.680.02 0.210.03 1.070.06 0.670.02 0.50 0.02 5 Cyt 0.500.02 0.200.02 1.300.07 0.850.02 0.37 0.01 71 C 0.760.12 9 dC 0.400.01 0.180.02 0.920.06 0.830.02 0.30 0.01 5 CMP 0.950.12 9 dCMP 0.530.02 0.270.02 1.380.11 0.840.02 0.45 0.02 5 Ade 0.230.05 8.00.3 0.65 0.05 2.95 8 Ade 0.340.07 -0.670.14 b 8.40.8 10 A 0.530.12 9 A 0.310.02 10 A 0.13 0.45 11 dA 0.170.01 0.10 c 0.42 0.10 0.91 0.01 0.13 0.01 5 AMP 0.520.16 9 dAMP 0.160.01 0.10 c 0.52 0.10 0.94 0.02 0.13 0.01 5 G 0.690.10 9 dG 0.460.01 0.160.02 0.780.05 0.730.02 0.33 0.01 5 GMP 0.860.10 9 dGMP 0.470.01 0.200.02 0.890.06 0.790.02 0.34 0.01 5 dGMP 0.160.02 -0.290.08 d 0.940.09 -4.01.0 d 17 a)
<> = 1+(1-)2, b) depending on the excitation wavelength (245 – 280 nm) c) limited by the time-resolution of the system, 0.10 ps after deconvolution d) depending on the emission wavelength (310 - 600 nm).
TABLE 3: Fluorescence lifetimes (ps) of modified monomeric chromophores in aqueous solution. They were obtained from fits with mono-exponential or multi-exponential functions.
compound 1 2 3 <> a ref. Ura 0.100.01 68 5FUra 0.690.06 1.740.06 1.32 0.05 68 5AUra b 0.150.01 0.660.07 2.780.05 81 5MedC c 1.00.1 5.40.3 2.8 12 DMAde d 0.520.03 3.00.2 62.01.0 85 a)
<> is the average lifetime b) based on a global fit 330-465 nm. c) at 330 nm. d) based on a global fit 350-510 nm.
TABLE 4 Average fluorescence lifetimes <> (in ps) determined for various DNA strands from fluorescence upconversion measurements
compound 310 nm 330 nm 350 nm 360 nm 380 nm 420 nm (dG)10·(dC)10 2.0738 (dG)20·(dC)20 3.2938 poly(dGdC)·poly(dGdC) 0.1616 0.216 0.2516 (dA)20·(dT)20 0.7513 1.2613 2.7338 1.2713 1.5713 (dAdT)10·(dAdT)10 0.5014 poly(dA)·poly(dT) 2.115 2.4815 2.9915 poly(dAdT)·poly(dAdT) 0.5014 1.1414 3.7514
TABLE 5:
Fluorescence anisotropy of DNA strands r(t) determined at time t (in ps) from the fits of the experimental decays using mono-exponential functionscompound (nm) r(0) r(0.5) r(1) r(3) (dA)20·(dT)20 13 310 0.37 0.29 0.26 0.24 330 0.31 0.29 0.27 0.23 380 0.31 0.28 0.26 0.18 420 0.28 0.24 0.21 0.12 poly(dA)·poly(dT) 13, 20 330 0.28 0.24 0.20 0.18 (dAdT)10·(dAdT)10 14 330 0.28 0.24 0.20 0.18 poly(dAdT)·poly(dAdT) 14 330 0.28 0.25 0.23 0.18 380 0.31 0.25 0.21 0.17 420 0.22 0.16 0.1 -0.1 poly(dGdC)·poly(dGdC) 16 330 0.25 0.15 d(TG4T)450 330 0.26 0.16 0.11 0.07 360 0.25 0.16 0.11 0.07 420 0.22 0.15 0.11 0.06
Figure 1
Steady-state absorption (dashed) and fluorescence (solid) spectra of dA, dG, dT, dC and 5MedC spectra in water. Arrows designate the Stokes-shift. Vertical bars indicated the two lowest transitions of dA and dG; exc = 255 nm.
Figure 2
Comparison of the absorption spectra obtained for duplexes [D in solid lines: poly(dGdC)·poly(dGdC) (a); poly(dA)·poly(dT) (b); poly(dAdT)·poly(dAdT) (c)] and an equimolar mixture of the constitutive nucleotides (M in dashed lines). The shaded area in the lower part corresponds to (D-M)/M.
Figure 3
Schematic representation of (a) guanine-cytosine and adenine-thymine Watson-Crick base pairs and (b) a tetrad where guanines are linked via Hoogsteen hydrogen bonds and stabilized by a metal cation (grey circle)
Figure 4
0 2 4 6 8 10 12 14 0 5 10 15 20 25 30 (dGdC)5 .(dGdC)5 participation ratio eige nst at e indexAverage participation ratios calculated for the thirty eigenstates of (dCdG)5·(dCdG)5 within
the frame of the exciton theory. Two extreme cases are shown: the diagonal terms are represented either by delta functions (grey) or by Gaussian curves whose width corresponds to the inhomogeneous width of the experimental absorption spectra of nucleotides in aqueous solution (black).
Figure 5
Fluorescence decay of TMP recorded by fluorescence upconversion at 330 nm. Also shown the apparatus function ( grey) and the fits with mono- and bi-exponential functions.
Figure 6
Fluorescence decays of a) dCMP (circles), TMP (triangles) b) dAMP (triangles) and dGMP (circles) recorded by fluorescence upconversion at 330 nm.
Figure 7
Fluorescence decays of dGMP recorded by fluorescence upconversion at 330 (squares), 450 (circles) and 600 nm (triangles).
Figure 8
Fluorescence decays of a) uracil (circles), thymine (triangles) b) cytidine (circles) and 5-methylcytidine (triangles) recorded by fluorescence upconversion at 330 nm.
Figure 9
Fluorescence decays of 5-fluorouracil in acetonitrile (squares) methanol (circles) and water (triangles) recorded by fluorescence upconversion at 330 nm.