Conceptual Human-System Interface Design
for a Lunar Access Vehicle
Mary Cummings
Enlie Wang
Cristin Smith
Jessica Marquez
Mark Duppen
Stephane Essama
Massachusetts Institute of Technology*
Prepared For Draper Labs
Award #: SC001-018
PI: Dava Newman
HAL2005-04
September, 2005
*MIT Department of Aeronautics and Astronautics, Cambridge, MA 02139
TABLE OF CONTENTS
1 INTRODUCTION... 1
1.1 THE GENERAL FRAMEWORK... 1
1.2 ORGANIZATION... 2
2 H-SI BACKGROUND AND MOTIVATION ... 3
2.1 APOLLO VS.LAVH-SI ... 3
2.2 APOLLO VS.LUNAR ACCESS REQUIREMENTS... 4
3 THE LAV CONCEPTUAL PROTOTYPE... 5
3.1 HS-IDESIGN ASSUMPTIONS... 5
3.2 THE CONCEPTUAL PROTOTYPE... 6
3.3 LANDING ZONE (LZ)DISPLAY... 8
3.3.1 LZ Display Introduction... 8
3.3.2 Motivation and Objectives ... 8
3.3.2.1 Landing Window of Opportunity... 8
3.3.2.2 Over-reliance on Memory... 9
3.3.2.3 Lack of Peripheral and Depth Perception Cues ... 9
3.3.2.4 Landing Site Redesignation Issues ... 10
3.3.3 LZ Display Design ... 12
3.3.3.1 Vertical Altitude and Velocity Indicator (VAVI) ... 13
3.3.3.2 Fuel and Thrust Gauge... 14
3.3.3.3 Pitch Ladder ... 15
3.3.3.4 Landing Zone Forward-Looking View... 16
3.3.3.5 Landing Zone Top-Down View... 17
3.3.3.6 Redesignation Mode ... 19
3.3.4 LZ Display Issues... 21
3.4 SITUATIONAL AWARENESS (SA)DISPLAY... 21
3.4.1 SA Display Introduction... 21
3.4.2 SA Display Design ... 24
3.4.2.1 Profile View ... 24
3.4.2.2 Event List ... 27
3.4.2.3 Expansion Boxes... 28
3.4.2.4 Human Intervention Example: Redesignation of Landing Site ... 29
3.4.2.5 Alternate Design Proposals... 29
3.4.3 Future SA Display Issues ... 30
3.5 SYSTEM STATUS (SS)DISPLAY... 31
3.5.1 Introduction... 31
3.5.2 Motivation and Background Research... 31
3.5.3 SS Display Design... 32
3.5.3.1 Status Alert Panel (SAP)... 33
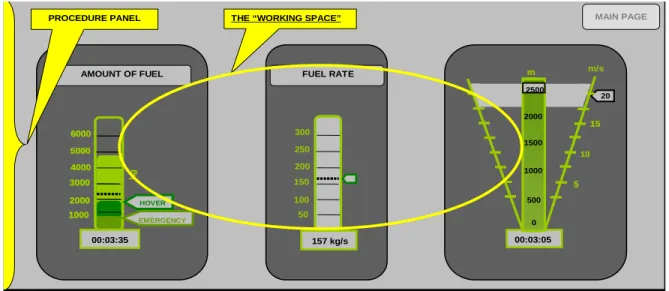
3.5.3.2 Procedure Panel ... 34
3.5.3.4 Time Panel ... 36
3.5.4 System Status Display Future Issues... 37
4 OVERALL DESIGN ISSUES AND NEXT STEPS... 38
4.1 OVERALL DESIGN ISSUES... 38
4.2 NEXT STEPS... 38
REFERENCES... 39
APPENDICES APPENDIX AINTERVIEWS,CONVERSATIONS, AND MEETINGS... 42
APPENDIX BDISPLAY SCREEN SHOTS... 72
APPENDIX CLUNAR TERRAIN ALTITUDE MAPPING:PAST,PRESENT, AND FUTURE DATA ... 95
APPENDIX DPRELIMINARY SYSTEM STATUS INFORMATION REQUIREMENTS... 97
APPENDIX EDECISION LADDERS... 99
APPENDIX FSUMMARY OF APOLLO PRESS KITS... 108
APPENDIX GAPOLLO LANDING SEQUENCE STORYBOARD... 116
APPENDIX HAPOLLO LANDING TIMELINE... 117
APPENDIX ILANDING ON THE MOON:COMPARISON BETWEEN APOLLO-ERA AND LUNAR ACCESS PROJECT... 120
LIST OF FIGURES
Figure 1 The TTO (Technology, Tasks, and Operators) Framework ... 2
Figure 2 The Role of the Human & Automation in Lunar Landings... 3
Figure 3 Displays and Controls in an Apollo Lunar Lander... 4
Figure 4 The Conceptual, Preliminary H-SI Design... 7
Figure 5 LM Window (Jones, 2000)... 10
Figure 6 LZ Display Screen Shot... 13
Figure 7 VAVI ... 14
Figure 8 Fuel and Thrust Gauge ... 15
Figure 9 Roll Attitude Display... 16
Figure 10 LZ Forward-Looking View ... 17
Figure 11 Top-Down View of Landing Zone ... 18
Figure 12 Velocity Vector Superimposed on Top-Down View ... 19
Figure 13 Redesignation Mode... 20
Figure 14 Situational Awareness Display... 22
Figure 15 Top Portion of Situational Awareness Display Profile View... 25
Figure 16 “Scroll Over” of Event with ETT... 26
Figure 17 Close up of Profile View, Projected Trajectory ... 26
Figure 18 Zoom of LIDAR Beam Representation in SA Display ... 27
Figure 19 Event List and Expansion Boxes ... 28
Figure 20 Situational Awareness Display Details ... 29
Figure 21 System Status Main Display... 33
Figure 22 Status Alert Panel ... 33
Figure 23 Procedure Panel ... 35
Figure 24 Checklist with Role Allocations... 35
Figure 25 Human Allocation ... 36
Figure 26 Automation Allocation ... 36
Figure 27 Shared Human-Computer Allocation ... 36
1
Introduction
1.1
The General Framework
In support of the vision for humans to establish a large scale, economically viable, permanent human settlement on the Moon within the next 25 years (Space Frontier Foundation, 2005), the next generation lunar landing vehicle must be capable of achieving pinpoint, anytime, anywhere safe landing on the lunar surface with high precision (10-100m). In addition, this vehicle should support both autonomous and manned lunar missions (NASA ASO-1160). Because of advances in technology over the past thirty-five years since the Apollo landings, the role of the human and automated systems in a new lunar lander system must be reevaluated and redesigned. This report details the design approach and resultant preliminary, conceptual design concepts for a Human-System Interface (H-SI) for a Lunar Access Vehicle (LAV).
While the primary focus of this report is the development of a H-SI concept to support astronauts physically located on a lunar lander, it is important to highlight that the design is intended to be adaptable to other control points (such as locally and distantly remote sites, e.g., from orbit or from earth). Developing a common display that can be used both in spacecraft as well as ground-based control sites is cost-effective in terms of equipment and personnel training, but common displays are also critical for shared situational awareness and collaboration across a network of both humans and automated agents.
The general human systems engineering approach taken in this project is illustrated in Figure 1. The Technology, Tasks, and Operators (TTO) triad represents an integrated and iterative approach to designing technology that will provide an interactive bridge between complex systems and humans engaged in supervisory control. In this framework, operators could be teams or individuals, and technologies are the artifacts that assist operators in accomplishing their tasks. Appropriate function allocation between operators and system is the underlining foundation for determining the role of human operators and desired technologies to support tasks. The general approach in the TTO framework for function allocation consists of distinguishing between the three major types of operator behavior: Skill-Based Behavior (SBB), Rule-Based Behavior (RBB) and Knowledge-Based Behavior (KBB) (Rasmussen, 1983).
• SBB: Behavior is automatic and doesn’t require conscious thought or verbalization. For an example, keeping a car between lane lines while driving.
• RBB: Behavior becomes a conscious activity and is based on given rules. For example, using a checklist to fix a system problem.
• KBB: Behavior is based on the operator's knowledge (i.e. mental model) of the system and operating environment, and there are no, incomplete, or vague rules governing the process. KBBs usually occur in unknown, ill-defined urgent and emergent situations.
Although SBBs and some of the simplest RBBs can be fully automated, KBBs and most RBBs cannot be highly automated. Therefore, our primary focus for the LAV H-SI is to support KBB and RBB by providing operators with relevant technologies.
Three research methods are selected to achieve the TTO design goal. A cognitive task analysis bridges operators and tasks in the operational environment by understanding the local and global tasks that must be performed for mission success, as well as any environmental and organizational constraints. A sensor survey determines desired technologies which either exist or should exist, to support operator decision processes. Human-in-the-loop (HITL) testing is used to ensure that operators can utilize proposed technologies to achieve desired performance and to identify any cognitive issues not discovered in the cognitive task analysis. The ultimate goal is to develop technologies to support human operations within the context of overall successful mission/goal accomplishment. The requirements and specifications that support both operators and tasks will eventually drive the technology advancement by providing a core understanding of cognitive requirements through principled and comprehensive analysis.
Figure 1 The TTO (Technology, Tasks, and Operators) Framework
1.2
Organization
This report has four sections. Section one is the general introduction of Lunar Access project. Section two introduces the background and motivation of the H-SI design. Section
three provides H-SI conceptual designs. Section four discusses future issues and possible improvements. All the written documents produced from the TTO analysis are attached in this report as appendices. Acronyms and abbreviations in this report are listed in Appendix J Acronyms and Abbreviations.
2
H-SI Background and Motivation
Figure 2 presents two extreme cases of function allocation between Apollo astronauts and automated control systems. Despite its antiquity, the cartoon still depicts the primary concern for H-SI design more than forty years later. In a highly automated lunar lander Figure 2a), astronauts have essentially no tasking other than to make a single decision as to whether or not they should abort. However, when inserted into the control loop Figure 2b), astronauts struggle with the heavy operational workload. The crux of both the past and present H-SI design problem is to determine where, between these two points, the acceptable region exists and design accordingly. This problem is further complicated with the additional requirement that the next generation lunar lander system must support both autonomous and manned lunar missions.
a) Highly Automated Lunar Lander b) Human Control in a Lunar Lander
Figure 2 The Role of the Human & Automation in Lunar Landings
2.1
Apollo vs. LAV H-SI
The traditional H-SI of an Apollo lunar lander (ApLL) was primarily composed of physical instruments such as pressure gauges, thermometers and switches (Figure 3). These electro-mechanical displays and controls present a major challenge for human operators because there were several of these types of displays and controls, and each of them required an operator’s attention at a certain time point. So an operator had to memorize their locations and operational sequences through specialized training. Fortunately, with the rapid development of computer hardware and software technologies, on-screen virtual displays and controls are replacing physical displays and controls. This means that humans are able to operate the physical system via a human-computer interface (i.e. computer screen and
mouse). Because of the proposed use of a “glass cockpit”, the LAV H-SI has several prominent advantages over the ApLL H-SI:
• upgradeable software agents to support human decision making and situation awareness which provide for a more robust and cost-effective system
• provide on-demand information in desired locations
• reduced weight because individual physical instruments are replaced by an integrated display
• better information access, integration, and sharing
• displays are multi-purpose in that they can be used by any human controller at any access point, i.e., on the lander, from a local remote control point such as on orbit, or from a distance remote control point such as earth-based mission control.
Figure 3 Displays and Controls in an Apollo Lunar Lander
2.2
Apollo vs. Lunar Access Requirements
Based on interviews with Apollo astronauts and Apollo mission assessment, we found several critical drawbacks in the Apollo H-SI design (Draper, 2005; Newman et al., 2005).
• In Apollo missions, astronauts had to rely on significant mental calculation and rough estimation to identify possible landing areas, known as landing footprint. • Apollo astronauts also had to memorize an inordinate number of procedures and
operational information. This required several years of highly specialized training. • It was difficult for astronauts to sense sink rate and lateral motion of ApLL.
• Only limited landing site re-designation options were available due to the geometric constrains of Lunar Module (LM) windows.
• Landing accuracy was a problematic issue for Apollo missions due to lack of terrain information of lunar surface (Appendix I Landing on the Moon: Comparison between Apollo-era and Lunar Access Project)
These issues must be addressed in the LAV H-SI design. We propose the following key functional requirements for the LAV H-SI design:
• Astronauts/controllers should be constantly aware of vehicle endurance and windows of opportunity for landing, both in time and space.
• Software agents (e.g., on-screen smart checklists) must be provided to reduce astronaut/controller cognitive workload
• Provide advanced visualization tools (i.e., synthetic and predictive views) to enhance astronaut/controller situation awareness.
• On-demand information access and sharing among crew members and mission controllers
• The H-SI should be reconfigurable to support various system configurations (i.e., crew positions & assignment of personnel )
3
The LAV Conceptual Prototype
3.1
HS-I Design Assumptions
The key design assumptions for the LAV H-SI conceptual prototype are: • Crew assumptions:
o There are 2 crew members actively involved in monitoring and decision making of the vehicle position and state during lunar landing
However, the displays designed in this effort are intended to be used by an operator/controller in the control loop such as ground control. This assumption should not be misconstrued as a requirement.
o The 2 crew members are seated with the displays in front of them
o The crew will not be able to control the vehicle during the braking phase o Manual control will only be used during off-nominal situations.
Due to time constraints, actual manual control activation will not be explored in year 1.
o The crew will be positioned so that the g-loading will be positive during coast and braking burn.
o The displays should support the landing without the need for ground control.
• Landing site assumptions:
o A single landing site will be selected a priori and the crew will only be able to redesignate to areas within the local landing region surrounding the specified landing site
o The crew will only be able to abort to orbit or abort to a landing site within the local landing region surrounding the specified landing site o There is a priori knowledge of the location of the desired landing
position and surrounding hazards
Thus some level of mapping exists
o There is prior knowledge of an approximate elevation profile • “Window” assumptions:
o A sensor, such as a monocular camera, will provide a synthetic “out the window” view
o A window is not required for determining vehicle position and state and is not needed for a lunar landing.
• LIDAR assumptions:
o The LIDAR will provide real time lateral and vertical position information during coast and braking burn
o The LIDAR will provide information about hazards within the landing region during the terminal descent
3.2
The Conceptual Prototype
Based on the initial results of Apollo mission assessment, an incomplete sensor survey, a cognitive task analysis, and a proposed Lunar Access trajectory, a preliminary H-SI design is proposed in Figure 4. The H-SI prototype is composed of three displays: landing zone, situation awareness, and system status. The partitioning of display information across three different displays represents the three primary elements of human supervisory control on the LAV: 1) Observing the automation’s attempt to conduct a precision landing and intervening if necessary, 2) Understanding where in space and time the current LAV is in the landing sequence and what future states/actions will occur, and 3) Monitoring of LAV systems in the event of an urgent or emergent condition that could cause an abort of the landing sequence. While this preliminary display concept represents these three primary tasks on three screens, as will be depicted in later sections, the actual displays are designed in a modular format such that the information can be spread across multiple screens. This modular design approach is critical given that no data yet exists on vehicle or cockpit configuration. Moreover, we recognize that crew position is still an unknown.
As stated in the assumptions, there is no reliance on a traditional window in this design. A windowless cockpit with a synthetic vision display has been proposed for designing Moon/Mars vehicles (Oman, 2005). This design concept offers important advantages (e.g. supra-normal acuity and wider functional field of view) over windows and direct human
vision. It also supports various vehicle configurations and crew positions. Therefore, we have incorporated this new design concept in our H-SI conceptual prototype.
For the purposed of this preliminary design effort, we selected a 2 astronaut crew configuration (a pilot and a systems support co-pilot) because a) this was the configuration for Apollo, and b) this is also the traditional configuration for current airplane cockpits. In Apollo missions, the Commander (CMDR) was actual the landing pilot who needs to see the landing site and the Lunar Modal Pilot (LMP) monitored the systems’ status. However, despite the initial crew assignment of 2, as discussed previously, this display configuration is intended to be used by any controller in the loop who could be on the LAV or on the earth, thus it is not role specific. Moreover, because of the modular design of the display components, role allocation is not permanent and is easily reconfigurable. In years 2 and 3 of this research effort, role allocation should be further investigated to include:
• What other viable role allocation schemes exist?
• How many people are really needed in the lunar landing process? It could be that with advanced automation, only one person instead of two is needed.
• If the crew assignment shifts to one or more ground/remote controllers, how will the display designs need to change to support issues such as time latency and control authority?
3.3
Landing Zone (LZ) Display
3.3.1 LZ Display Introduction
While much of the design of the LAV displays will be based on display technologies utilized in other domains, a Moon landing is a very different challenge. The lunar terrain, trajectories, vertical descent to landing, and the role of the crew, when considered all together, make landing on the Moon dissimilar in several ways to flying an airplane, maneuvering an underwater vehicle, or landing a helicopter. The focus of this section is the development of the displays for the actual landing sequence, to include redesignation of the previously selected landing site. It will be crucial to provide the astronauts with a view of where they are headed along with critical information necessary for monitoring the current situation, redesignating a landing site if necessary, or taking over manual control in extreme circumstances. The Landing Zone (LZ) display is designed primarily for the crew member who will be responsible for redesignating a landing site or taking over manual control if necessary. For Apollo missions, this role belonged to the mission commander, but may or may not be the case for the LAV.
3.3.2 Motivation and Objectives
Results of a cognitive task analysis identified several areas needed for improvement over Apollo in terms of the information provided to the crew about their landing site and vehicle capability. We propose that these major areas, which will be discussed below, are:
• Landing Window of Opportunity • Over-reliance on Memory
• Lack of Peripheral and Depth Perception Cues • Landing Site Redesignation Issues
3.3.2.1 Landing Window of Opportunity
One issue that was identified was an awareness of the vehicle’s endurance in reaching alternate landing sites if necessary. Research prior to the first lunar landing demonstrated that the window of opportunity for redesignation was a function of current altitude, fuel, window geometry, surface lighting, and vehicle attitude (NASA, 1966). For a human, combining these factors mentally and reaching a decision using constantly changing variables adds significant mental workload. An interview with Buzz Aldrin revealed that the primary consideration of the crew in reaching an understanding of current vehicle redesignation capability was fuel and the astronauts relied heavily on their memory and prior training experiences to understand limitations (Appendix A Interviews, Conversations, and Meetings). In a phone interview with John Young, he also touched on this fact. He said “We practiced this whole business many, many times…thousands of time. I probably had about 40 or 50 landing in the Lunar Training Vehicle. So, you know, we practiced and the Lunar Training Vehicle ran out of gas fast too…it didn’t have much gas either” (Appendix A Interviews, Conversations, and Meetings). This demonstrates that
fuel was the driving factor in the minds of the Apollo astronauts for determining the landing site window of opportunity.
The window of opportunity for landing is analogous to what VTOL (vertical takeoff and landing) aircraft also must consider. During a visit to Cherry Point and New River Marine Air Stations, AV-8B Harrier and MV-22 Osprey pilots explained how they know their time and available window for landing. They explained that it was purely something that they had a feel for from significant training. They also explained that they know their fuel and burn rate (which are constantly changing) and can use the combination of that information to determine capability to some rough degree (Appendix A Interviews, Conversations, and Meetings).
It is important to note that fuel is a critical limiting factor for a lunar landing and relying on heuristics and correct mental calculations for such a critical event represents a significant design flaw. Thus this research has identified the need to make the crew continuously aware of this dynamic window of opportunity for landing, taking into consideration all the variables for a landing site redesignation.
3.3.2.2 Over-reliance on Memory
Another issue that was identified through the cognitive task analysis and was touched on in the interviews is the fact that the astronauts were constantly pulling vital information from their memories. Operators should not have to determine courses of action through calculation, inference, and data transformation because this process is inherently error-prone (Lintern, Waite, & Talleur, 1999). Instead of relying on memory which is inherently a flawed especially under time pressure (Wickens & Hollands, 2000), humans engaged in supervisory control should be provided with direct perception-action visual representations. Direct manipulation interfaces allow operators the ability to directly perceive the system state, make correct decisions, and reduce errors (Rasmussen, 1998; Shneiderman, 1998). Therefore, a major objective of this LZ display is to provide the commander with as much direct perception-action information as is necessary to safely and accurately land, while avoiding information overload and reliance on memory items. This integrated information, including real and synthetic “out-the-window” views, will allow the crew to perceive the surroundings and make judgments based on that direct perception interaction rather than pulling from memory.
3.3.2.3 Lack of Peripheral and Depth Perception Cues
An issue that repeatedly came up in interviews was the issue of relative size and depth perception. The following quote from an interview with Charles Duke, the Lunar Module Pilot for Apollo 16, illustrates this issue:
“At the beginning, when we looked at the rock, we didn’t think it was very large. The problem on the Moon is depth perception. You’re looking at an object that you’ve never seen before and there is no familiar scale. By that I mean you don’t have telephone poles or trees or cars with which to judge relative size. As you look
at a rock, it looks like a rock. It could be a giant rock far away or it could be a smaller rock close in. We thought it was an average size rock. We went off and we jogged and finally got down there and the thing was enormous. I imagine it was 90 feet across and 45 feet high. It was like a small apartment building towering above us as we finally got down there. I believe it was the largest individual rock anybody saw on the Moon.” (McCandless, McCann, & Hilty, 2003)
This lack of depth perception cues can make obstacle and hazard identification difficult as well as perceiving lateral and vertical rates. Unfortunately, these are key pieces of information that many earth-based vertical landing aircraft pilots depend on to make a safe landing. An AV-8B Harrier pilot described how he maneuvers the vehicle such that he can see two large landmarks out his window. He then primarily uses these landmarks to sense his sink rate and any horizontal movement. He also looks out his window to be sure that the landing site is clear of major debris that may inhibit a safe landing (Appendix A Interviews, Conversations, and Meetings). Because of the windowless cockpit design as well as the lack of perceptual cues, this critical information must be displayed to the crew of a lunar lander in another way such that images seen through live video feed or synthetic images do not hinder the ability to safely land the vehicle either autonomously or manually.
3.3.2.4 Landing Site Redesignation Issues
For Apollo astronauts, landing site redesignation was a complicated process that introduced significant potential for error. Landing site redesignation was accomplished using the LPD (Landing Point Designator), which was difficult (Jones, 2000). Use of the LPD involved using the scribe marks etched in the double panes of glass of the commander’s small window, and numbers provided by the guidance system on the DSKY (Display and Keyboard). As illustrated in Figure 5, these etchings provided a reticle that was used to determine where the Lunar Module would land.
A description by Eugene Cernan, the Apollo 17 mission commander, explains how the reticle was used:
“In addition to all the fancy gear, all the rate needles and everything, when it came right down to landing, we had etchings on the window in both pitch and yaw. And here, after pitchover, Jack is telling me where on the window the computer thinks we’re going to land. The digital autopilot and the computer programs were designed to accept attitude impulses with my hand-controller. I could go “blip” once and that would tell the computer that I wanted to change the target maybe a half degree or a degree in pitch. … It was the same sort of thing in yaw, but you have to remember that yaw didn’t directly change the flight direction because yaw is a rotation around the thrust axis. …So if I blipped the hand-controller in yaw, what it really said to the computer was that I wanted to land a little left and that it had to do a little roll to get over there” (Jones, 2000).
Disorientation with respect to current position and desired landing point was another factor that made landing resignation difficult. An interview with Pete Conrad, who was the mission commander for Apollo 12, revealed that right after pitchover and upon his first view of the landing site, he was completely disoriented. He said “When the LM pitched up at 7,500, I didn’t have the foggiest idea where I was. There were 10,000 craters out there” (McCandless, McCann, & Hilty, 2003). As a result of this disorientation, Pete Conrad and Allan Bean landed the LM primarily using Instrument Flight Rules (IFR) With only a few minutes between the first view of the landing site and touchdown, it is critical that the crew be aware of not only where they are, but where they are headed, and thus any time spent reorienting to the environment takes away from time needed for landing site redesignation. Thus the proposed landing zone display in this report seeks to eliminate any time in which the human is temporarily removed from the loop due to disorientation.
To determine specifically what data and information are needed by pilots/controllers attempting to redesignate a lunar landing site, decision ladders were constructed (Appendix E Decision Ladders). Decision ladders are modeling tools that capture the states of knowledge and information-processing activities necessary to reach a decision. Decision ladders can help identify the information that either the automation and/or the human will need to perform or monitor a task. Decision ladders for the decisions to redesignate a landing site and possibly take over manual control were constructed to identify display information requirements as well as potential human-automation allocation strategies. These decision ladders, outlined in Appendix E Decision Ladders, illustrate the need not only for the same information identified by the cognitive task analysis, but the need for several other pieces of information such as the need for visual or oral alerts in certain situations, obstacle and hazard identification including descriptive parameters, preferred alternate landing areas, the current vehicle footprint capability, and feedback on the vehicle path in terms of changing key parameters such as fuel, rates, and position.
The list below outlines the key objectives of the landing zone display. Some of these objectives may be applicable to the other displays as well.
1) Provide the commander (or crew equivalent) with all of the critical landing parameters in a heads-up display format.
2) Provide the crew with the ability to perform precision landing at a desirable landing site
3) Reduce the time that human is out of the loop due to disorientation. 4) Provide the commander (or crew equivalent) with as much information
as is necessary to safely and accurately land the lunar lander, while avoiding information overload.
5) Combine and condense the information in such a way that it provides critical information in its most applicable form.
6) Provide the ability for the crew to perceive their surroundings instead of pull from their memories in order to make judgments and key decisions. 7) Make the crew continuously aware of the regularly changing window of
opportunity for landing, taking into consideration all the dynamic factors. 8) Provide the astronauts with a view of where they are headed along with
critical information necessary for monitoring the current situation, redesignating a landing site if necessary, or taking over manual control in extreme circumstances.
9) Provide information that is not provided by visual cues for on the Moon due to lighting and depth perception issues.
10) Provide a tool to aid with depth perception and relative size identification during landing.
11) Identify obstacles and/or hazards quickly and sufficiently.
3.3.3 LZ Display Design
The LAV LZ display should capture the most critical information needed to perform a safe and precise lunar landing. Through the aforementioned cognitive task analysis, several key pieces of information were identified as necessary to either monitor or perform a precise and safe lunar landing. These elements include altitude, sink rate (vertical velocity), fuel, and attitude, thrust level, lateral and forward and aft rates, and landing site location. For Apollo commanders, most of this information was available across multiple gauges within the cockpit, but they relied on their Lunar Module pilots (LMP) to read much of this information to them while they maintained an “out-the-window” view of the landing site (McCandless, McCann, & Hilty, 2003). Jack Schmitt explained a similar role and even commented on the fact that had the technology been available at the time, a heads-up display that provided the commander with all the information he depended on his pilot for would have been very beneficial (Appendix A Interviews, Conversations, and Meetings). Therefore, one objective of this display is to provide the commander with all of the information that he/she needs in a heads-up display format.
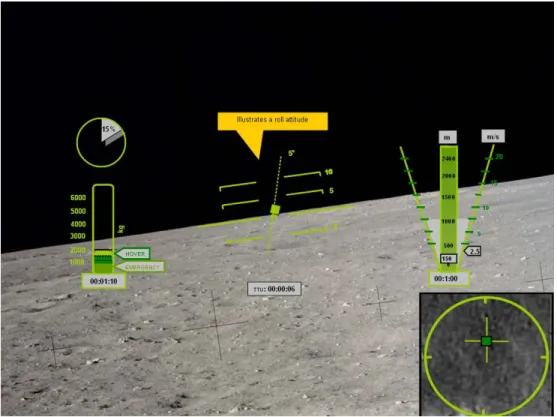
Figure 6 illustrates a screen shot of the LZ display with the landing zone in the distance. The LZ display includes four major elements. The first is the fuel and thrust level gauge that indicates fuel levels to include hover and emergency fuel as well as the current thrust
level of the engine(s). The second element is the Vertical Velocity and Altitude Indicator (VAVI) that conveys altitude and sink rate information as well as important hover situations. Next, the velocity vector which indicates the direction and rate of the vehicle’s movement. Finally, the top-down view illustrates the intended landing zone around the landing site and window of opportunity while including important hazard information. The various elements and modes of the preliminary LZ display will be described in detail below.
Figure 6 LZ Display Screen Shot
3.3.3.1 Vertical Altitude and Velocity Indicator (VAVI)
The vertical altitude and velocity indicator (VAVI) conveys both altitude and sink rate (also known as vertical velocity) information in a single display1. Apollo landers did and current VTOL aircraft still display this information separately which requires the pilot to make mental calculations in order to draw meaningful conclusions. The VAVI is capable of indicating intended descent rates, unsafe situations, and hover maneuvers in a condensed form. The most recent version of the VAVI, which has not yet been integrated into the screen shots, provides a better visual of the vehicle’s current condition and hover maneuvers. In Figure 7, the vertical bar indicates altitude while the “wings” that come out from the altitude bar at the current altitude, act as needles for the sink rate dial to the right. A nominal descent is illustrated in Figure 7a, while a hover initiation, hover, and unsafe
1
A patent application is pending for the VAVI. Fuel and thrust
level gauge
Velocity Vector
VAVI
Top-down view
sink rate are illustrated in b, c, and d respectively. The grey band again indicates the intended descent rate range, while the red illustrate an unsafe sink rate for that current altitude. The black “wings” of the VAVI act as the needles of the descent rate dial. The rate range band becomes shaded when the descent rate sinks below the intended value, indicating the initiation of a hover (Figure 7b). Finally, completely horizontal wings indicate that the vehicle is in a true hover at its current altitude (Figure 7c), but should also be completely horizontal on landing. Unsafe descent rates are indicated by the estimated time to touchdown box turning red as well as the unsafe sink rate that the vehicle is experiencing. As the entire VAVI is dynamic, it is an integrated velocity vector that provides the direct-perception interaction described previously.
Figure 7 VAVI
3.3.3.2 Fuel and Thrust Gauge
The fuel gauge, located in the lower left corner of the display and depicted in Figure 8, conveys import fuel information. The light green color fuel is the current amount of fuel that the vehicle has. The black dotted line indicates the amount of fuel that the vehicle will land with, should it land at the targeted site with no redesignations. The dark green fuel is
a pre-determined desired amount of hover fuel. If a hover is commanded, the level of this fuel will decrease, causing the entire fuel level to drop. Finally, the medium-dark green fuel is the emergency fuel. The number along the vertical axis of the gauge is the raw amount of fuel left, while the time at the bottom is the combination of the burn rate and raw fuel level into an available burn time. The circle above the fuel gauge indicates the thrust level. It is important to note here, that these illustrations are only sketches and thus the colors and markers will likely change in the final demonstration.
Figure 8 Fuel and Thrust Gauge
3.3.3.3 Pitch Ladder
A traditional pitch ladder appears in the terminal descent phase in order to monitor the vehicle’s attitude during the final touchdown. Should the crew have to take over manual control, this would also be a key tool to perform a safe landing. The long, solid straight line indicates the horizon. Each hash line is five degrees of pitch with the solid lines indicating a positive pitch and the dotted lines below the horizon indicating a negative pitch. The lunar lander icon in the middle will move up and down this pitch ladder to indicate current pitch attitude. Finally, the roll of the icon also indicates the roll of the vehicle. A screen shot of this is depicted in Figure 9 below.
Figure 9 Roll Attitude Display
The option will also be given to the crew to move the top-down view to the lower right corner during terminal descent, allowing the horizon of the pitch ladder to match the horizon of the “out-the-window” view.
3.3.3.4 Landing Zone Forward-Looking View
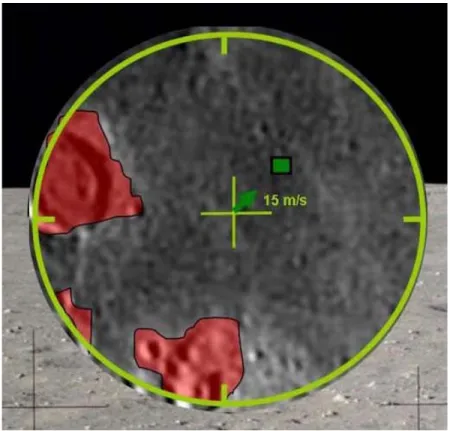
The LZ forward-looking view is available to the crew at the start of pitchover. In addition to the fixed elements described above, this view, illustrated in Figure 10, provides an a priori map of the landing zone including predetermined hazards in the area in the lower right corner. In this view also, the velocity vector is indicated in a circle at the top of the display. This circle represents the spacecraft bore sight and the arrow pointing in the upper right quadrant indicates that the vehicle is moving forward and to the right at the digitally displayed speed next to the arrow. The length of the arrow moves relative to the magnitude of the ground speed. The landing zone, seen in the distance as an oval, also indicates the targeted landing site by a dark green square. As the spacecraft approaches pitchover, the bore sight will drop until a predetermined angle below the horizon, at which time the landing zone view would replace it and the pitch ladder would appear.
Figure 10 LZ Forward-Looking View
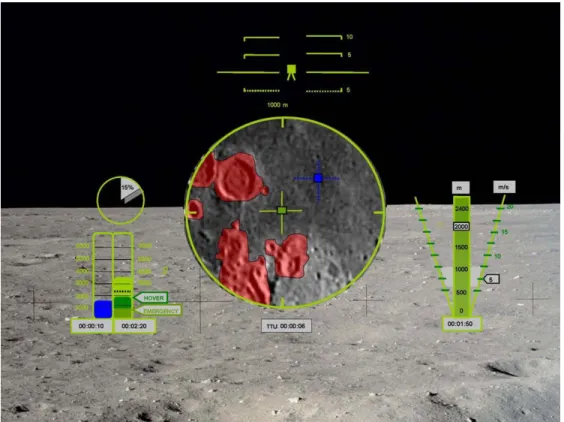
3.3.3.5 Landing Zone Top-Down View
The LZ top-down view provides critical landing zone information. This view transitions from the lower right corner to the center of the display once the vehicle is positioned directly above the landing site and has completed its pitching maneuver (Figure 11). The rationale behind this view is that once the vehicle is directly above the landing site, the information about the landing zone below it is the most important information for the terminal descent phase. This design was adapted from the MV-22 Osprey displays in which top-down information is overlaid over an “out-the-window” view (Appendix A Interviews, Conversations, and Meetings). According to an MV-22 Osprey instructor pilot, the pilots love this orientation and find it very intuitive (Appendix A Interviews, Conversations, and Meetings).
Figure 11 Top-Down View of Landing Zone
Important additional information included in this view is the velocity vector, and the landing footprint for window of opportunity and hazard detection and avoidance information. In this phase of the landing, the Terminal Descent Phase, the velocity vector is superimposed over the top-down view. The bars of the cross in the center of the circle indicate forward, aft, and left and right velocities. This same notation as the forward-looking view holds here as well. This superimposed velocity vector is illustrated in Figure 12 below.
Figure 12 Velocity Vector Superimposed on Top-Down View
The landing zone is a window of opportunity for landing site redesignation and includes the area that is within reach of the vehicle. It is indicated by the green circle seen in Figure 11. Since the size of this window of opportunity is a function of vehicle altitude and fuel constraints, it will constantly be shrinking during a descent. The number seen directly above the top-down view is the diameter of the green circle. Other distance indicators such as small hash marks in the circle may be added for scale issues.
The top-down view of the landing zone, provided no later than the beginning of the terminal descent phase, also provides hazard detection information. Provided primarily by the LIDAR, the red areas indicate obstacles or hazards. This information will be used by the crew to determine if a landing site redesignation is necessary. The grey box below the top-down view illustrated in Figure 11 is the time until an update of the sensor image that is providing the top-down view.
3.3.3.6 Redesignation Mode
When the LIDAR indicates that the targeted landing site is hazardous and the human intervenes to redesignate a landing site, several part of the display will change to indicate a mode change and prevent mode confusion. Figure 13 illustrates a screen shot of the display in redesignation mode. The primary elements of this mode are the blue cross-hairs that appear to allow for redesignation and the 2nd fuel gauge which also shows a fuel level in blue. The blue cross-hairs are controlled using a cursor input device that has yet to be designed. Once the cross hairs are over a new safe landing site, the site is confirmed with
some activation of the cursor device. The blue square at the center of the blue cross-hairs will become dark green when the system successfully targets the new landing site.
The second fuel gauge that appears during redesignation mode shows a blue fuel level, which indicates the amount of fuel that will be remaining on landing for the new redesignation site. In other words, if the user places the blue cross-hairs over the originally targeted site, the blue fuel level should match the black dotted line on the constant fuel gauge. If the blue cross-hairs are placed on the edge of the green circle, the blue fuel gauge should show an empty tank. The time associated with the redesignation mode fuel gauge is the amount of burn time associated with the level of fuel that will be remaining when the vehicle lands. For example, if the time below the redesignation fuel gauge reads 00:00:15, it indicates that the vehicle will land with approximately 15 seconds worth of fuel remaining if the landing site is redesignated to the current blue cursor position. Similar to the blue cross-hairs, once the redesignated site has been accepted by the system, the redesignation fuel gauge will disappear to indicate another mode change. The black dotted line on the nominal fuel gauge, indicating extra fuel at landing, will move to be consistent with the new landing site.
3.3.4 LZ Display Issues
There are several issues that still require some research and application in the landing zone display:
• Map-tie error. Based on the current state of maps of the lunar surface, there is a good chance that upon pitchover of the LAV, sensor data may indicate that the a priori map is not concurrent with the current position of the vehicle. Further research and discussion needs to be devoted to determining how to deal with this situation.
• Obstacle visualization. In the current display design, major obstacles such as craters are outlined in red. However, it has not been determined how point obstacles should be handled. These include small rocks that may hinder a safe landing. This decision may largely be a function of the sensor technology, namely LIDAR, which will be used to survey the landing site.
• Depth perception cues. The addition of a synthetic icon of a familiar landmark that will provide the crew with a relative size indicator straight on the landing zone display. This is to accommodate the very severe issue of depth perception and relative size outlined by the Apollo astronauts.
• View Angles. When providing the crew with the “out-the-window” forward-looking view, there is a range of view angles that could be provided inside the cockpit. The best angle for this view is another parameter that needs to be determined.
• Braking Phase View. The landing zone display currently only covers the time frame from pitchover to landing. Determining what information and in what format that information should be displayed to the crew during the braking phase is another important research area that will be focused on in the future.
3.4
Situational Awareness (SA) Display
3.4.1 SA Display Introduction
As the name implies, the purpose of the Situational Awareness (SA) Display is to provide the crew with situational awareness, connecting space and time of events during the landing process. Situation awareness is the perception of elements in the current situation, the integration and comprehension of these elements and current situation, and the projection of future status based on comprehension (Endsley, 1995). Maintaining situation awareness while executing a task, particularly when it involves using automation, is important because it promotes safety and permits operators to accurately do their job. When automation is involved, it has been shown that operators could have decreased situation awareness (Endsley, 1996; Parasuraman, 2000; Parasuraman & Riley, 1997) and an inability to maintain mode awareness (Parasuraman & Riley, 1997; Sarter & Woods, 1994). It is thus deemed critical for any human-in-the-loop interface to provide and promote situational awareness.
Previous space shuttle display research has emphasized the need for a comprehensive SA display for both current and future events. The recent Space Shuttle Cockpit Avionics Upgrade (CAU) investigation resulted in advocating a display that included both current and future status (McCandless et al., in press). Having the operator, be it on board or remotely, understand the vehicle’s state is critical for trust and for preparedness in case of future emergencies. If operators have good situation awareness, they will be able to project correctly what future states should occur and recognize when deviations from the expected take place.
In general, a LAV SA display should provide the crew with a “big picture” of events and stages occurring during the landing process thus communicating when and where the lunar lander is both currently and predicted future state, and when and how the human is assigned particular responsibilities. This display, while modular, could be shared by the commander and lunar lander pilot as well as any other controllers in the loop. The proposed preliminary LAV SA display (Figure 14) is intended to maintain situation awareness by visualizing the lander in space relative to its current and predicted trajectory, external hazards (terrain), and current and future modes (phases and events) of landing process. Moreover, it keeps the human actively engaged in the sequence of required tasks. The desired results are to enhance safety and mode awareness, and promote timely and accurate interaction with various lander systems as required, particularly when deviations from nominal operations occur.
An in-depth analysis of the Apollo landing process was conducted, focusing not only on the astronauts’ tasks but also the cognitive requirements (Appendix A Interviews, Conversations, and Meetings, Appendix F Summary of Apollo Press Kits, Appendix G Apollo Landing Sequence Storyboard, and Appendix H Apollo Landing Timeline). One of the artifacts of this analysis was an Apollo landing storyboard and timeline, summarizing the many tasks the astronaut crew had to execute in order to land safely on the Moon (Appendix G Apollo Landing Sequence Storyboard and Appendix H Apollo Landing Timeline). This provided insight as to the number of tasks that had to be done by the crew. For example, due to the limited computing capabilities in Apollo, astronauts had to load specific programs for each of the important phases of the landing sequence. As a result, the Apollo landing process was a well-orchestrated series of events that had to be executed in a timely and accurate fashion.
Future lunar landings, however, will incorporate higher levels of automation, changing the role of the astronauts in the landing process. Instead of initiating programs, which can now be automated, the crew has a larger supervisory monitoring task. As has been demonstrated in numerous studies, as humans are further removed from the control loop, they lose situation awareness (Layton, Smith, & McCoy, 1994; Newman et al., 2005; Parasuraman, Molloy, & Singh, 1993; Parasuraman, Sheridan, & Wickens, 2000) and thus a situational awareness display is needed that correlates the space and time of events. Moreover, because automation feedback is a critical element in maintaining SA, this display should reveal the activities the automation is conducting and when, where, how and why humans should and could intervene. This is critical especially when considering remote operators of the LAV, as they will lack the physical cues an astronaut crew would receive while in the vehicle.
When specifically dealing with the landing on the Moon, much of the Apollo-era documentation refers to vertical profiles of the landing sequence (e.g., Klumpp, 1968; NASA, 1966). Needless to say, the vertical component of landing is an integral part of the landing process – it is a vertical landing on the Moon. Inspired by this documentation and the fact that the human role for the majority of the landing sequence is supervisory we propose an SA display that incorporates a vertical profile view. In addition to providing SA for the crew, this display provides a common operational picture between all humans in the loop, whether it is on the lander or on the earth.
Utilizing a vertical navigation aid to provide situation awareness and timeline information for mode awareness was also suggested by human factors experts at NASA Ames Research Center (Appendix A Interviews, Conversations, and Meetings: Interview 9). This is not surprising if we consider all the published support for trend displays, similar to the proposed vertical SA display (e.g., Atkins et al., 2004; Walton, Quinn, & Atkins, 2002). Woods (1995) demonstrated the importance of trend displays for SA in a space setting in his description of Apollo 13 mishap: a trend display would have saved 54 minutes of trial and error in identifying the cause of the emergency (Woods, 1995). In general, trend displays support human operator monitoring, diagnosis, and control,
promoting, in essence, situational awareness (Guerlain, Jamieson, Bullemer, & Blair, 2002).
Furthermore, there are some clear advantages of using a vertical situation awareness display, such as ease in determining distance between lander and other features, including landing site, and ease in discriminating between vertical deviations from trajectory (adapted from SAE, 2001). A vertical trend display is especially important given the uncertainty of both the prior mapping as well as the performance of the LIDAR. Giving the crew the ability to understand how well the LIDAR is performing early in the sequence will prepare them for potential map-tie errors after pitchover. The ability to provide a prediction for a critical future state is a critical component of any technology designed to promote SA.
A horizontal situational awareness display for the LAV (for example, see McCandless et al., 2005) would only be beneficial for large lateral movements such as landing redesignation to sites not near the original landing site (i.e., a large lateral displacement needs to be implemented by the operator). Nonetheless, lateral deviations are not ignored in our display system concept. For the final descent phase, these deviations can be detected in the top-down view of the landing area, presented in the Landing Zone display; the top-down view is analogous to a horizontal situation display. For the initial phases, a horizontal display for lateral displacement is still under investigation.
Based on the cognitive task analysis, the important information relevant to maintaining situation awareness for the task of landing on the Moon is:
• Trajectory (intended, past, and predicted) • Lander’s current state
• Lander capabilities
• Trajectory parameters (or phases) • Landing site location
• Time to touchdown
• Hazards, obstacles awareness • Terrain (database information) • Information transmission (datalink) • Fuel constraints
• Feedback for any significant deviations from the nominal situation
• Notification of any expected actions expected to be performed by the human
3.4.2 SA Display Design
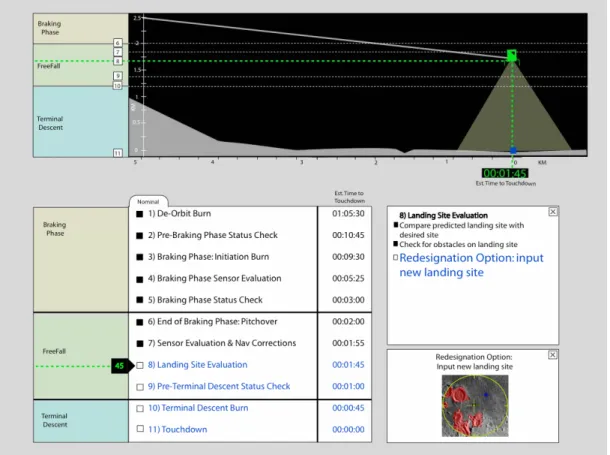
The Situational Awareness display is divided into three major sections: profile view, events list, and expansion boxes (Error! Reference source not found.). Within the profile view, the trajectory of the LAV is depicted as well as the estimated time to landing site. Both the profile view and events list have a timeline of major landing phases. The events lists current (high-level) tasks, while the expansion boxes provide further details about the specific activities done by the automation or the operator.
3.4.2.1 Profile View
The top half of the display is the profile view (Figure 15). Similar to a vertical descent display, this profile view shows the trajectory of the lunar lander as it approaches the landing site. Shown in grey (bottom) is the predicted terrain altitude. The lander icon’s orientation matches to the current pitch angle of the lander. In Figure 15, the lander has completed the pitchover maneuver and thus, would have a pitch angle of 0º. Earlier in the landing process, it would be tilted relative to the vertical, indicating a larger pitch angle (see also Figure 17).
Figure 15 Top Portion of Situational Awareness Display Profile View
It is assumed that there will be a preliminary terrain profile for the planned trajectory (see Appendix C Lunar Terrain Altitude Mapping: Past, Present, and Future Data; Section 3.1 H-SI Design Assumptions). If there are any terrain deviations from the expected based on sensor information, mainly LIDAR updates, these updates would be marked on the actual terrain profile.
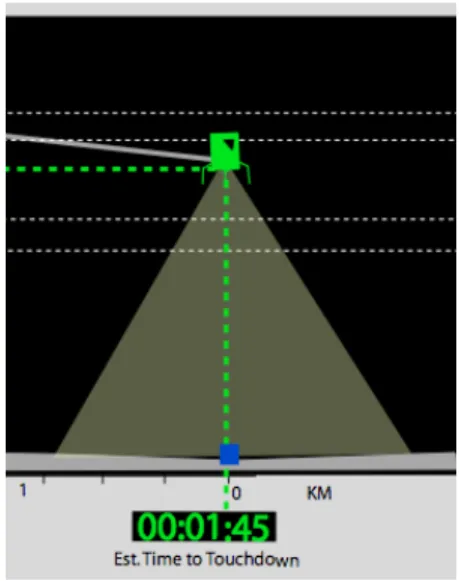
The trajectory is plotted against altitude and distance to the landing site. Both of these axes are linear, yet as the trajectory progresses, the scales change because the display should always be focused on the current landing phase (essentially, a zooming feature). For example, it is not as imperative to show the last kilometer of the trajectory when in the beginning of the braking phase; the operator will be more interested in knowing they are at the correct altitude. While there is no axis of time, there is an estimated time to touchdown below the lander icon. This countdown is the same as the one located in the System Status (SS) display. From an SA perspective, it is critical to know where you are in time. Since it is deemed as one of the critical variables during the landing process, it is repeated in the SA display (Appendix G Apollo Landing Sequence Storyboard and Appendix E Decision Ladders).
Highlighted in Figure 15 are the landing phases in “timeline” format: braking, freefall, and terminal descent. This “timeline” does not directly depict time (as there is no time axis), but it relates the position of the lander to phase of the landing process. Embedded within this “timeline” is a series of numbers that match the event numbers checklist (Figure 14). The numbered events are mapped in time to a checklist of critical events executed by humans and/or automation, while in the profile view, these same events are mapped in
space. In Figure 15, the lander happens to be in the freefall phase, specifically executing event number 8. If the crew “scrolled over” a numbered event in the profile view, the estimated time to touchdown from this event would pop up (Figure 16).
Figure 16 “Scroll Over” of Event with ETT
The current location in time and place of the lander is depicted in green dashed lines. Furthermore, the lander is green to match the lander icon in the LZ display. The future portion of the trajectory is depicted in blue (in Figure 15) the future trajectory is not visible as it is below the current position line; see Figure 17 for projected trajectory example). The destined landing site is also colored blue, which represents future states. The portion of the trajectory that has already passed is shown in grey. Blue also happens to be used for landing site redesignation in the LZ display. These color selections were driven by the LZ display and are still in development.
Figure 17 Close up of Profile View, Projected Trajectory
As seen in Figure 15, there are other horizontal lines on the profile view. The solid lines indicate when a landing phase changes, for example, from Braking Phase to Freefall. The dashed lines are connected to the numbered events, further highlighting events to space, i.e., the position of the lander. It is acknowledged that it is possible for clutter to occur when too many events are clustered together; this is solved when the profile view is enlarged through a zoom function.
Only once the Braking Phase ends, does the display show the LIDAR’s beam area (Figure 18. While the LIDAR is always on during the landing process, it only “sees” the landing site after pitchover. Thus it is important for the crew to visualize the beam area because it is one of the primary sources of sensor information that has a direct impact on landing site redesignation, a critical crew task.
Figure 18 Zoom of LIDAR Beam Representation in SA Display In summary, the information provided in the profile view (top half of SA display):
• Lander altitude and downrange from landing site • Estimated time to touchdown
• Terrain altitude
• Graphical representation of LIDAR beam area and lander’s pitch angle • Current location in space and time
• Current landing phase and event
• Relative information (space and time) about other phases and events
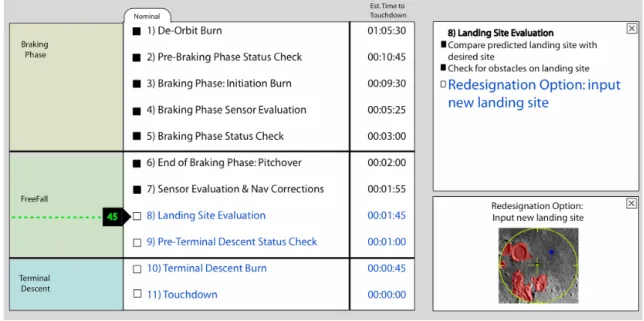
3.4.2.2 Event List
The bottom half of the SA display includes the event list and two expansion boxes (Figure 19). Two boxes (instead of one) were selected because three levels of hierarchical information were identified: high level (events list), list of activities within an event, and finally, potential details about a specific activity. On the left, the event list is similar to a checklist; the main difference is the event list is not an enumeration of tasks to be done, but rather major events in the landing process that occur. A set of eleven events are shown; however, it is worth noting that this list is based on the major events that occurred during an Apollo landing sequence, adapted to accommodate the new Draper trajectories. Each event is numbered and thus, cross-referenced in the profile view. This was done to facilitate cognitive matching between the events list and the profile view.
Figure 19 Event List and Expansion Boxes
Once an event is completed, it changes colors to black and its corresponding check box is darkened. Future events are in blue text. The current event is highlighted with a green dashed line and an arrow box. The dashed line, similar to the one in the profile view, is within the trajectory phase. The arrow box has a timer, indicating the remaining time until the event finishes; this was deemed crucial because during Apollo, events had to be executed in a very precise and timely manner, and though automation manages most of these events and activities, time is still of the essence. In Figure 19, the current event is “Landing Site Evaluation”, within the FreeFall Phase, and there are 45 seconds remaining in this event.
To the right of every event, there is a time stamp, which is the estimated time to the start of each event. This time should be calculated based on the current state and trajectory. If a change or update in the trajectory occurred, the time stamps would be refreshed, reflecting the new estimated times base on the current position and trajectory.
3.4.2.3 Expansion Boxes
To the right of the event list, there are two expansion boxes. If the crew would like to see what specific activities were taking place during an event, the event in the list can be selected and the top expansion box would contain an activities list. Most of these activities would be automated but would be highlighted if human intervention was required. While the majority of tasks are expected to be automated, it is expected that some procedures will require human interaction. Future improvements will include improving the saliency of the activity and correspondence with SS display’s functional allocation (see 3.4.3 for more explanation). The second expansion box further expands an activity to show lower level detail if needed.
3.4.2.4 Human Intervention Example: Redesignation of Landing Site
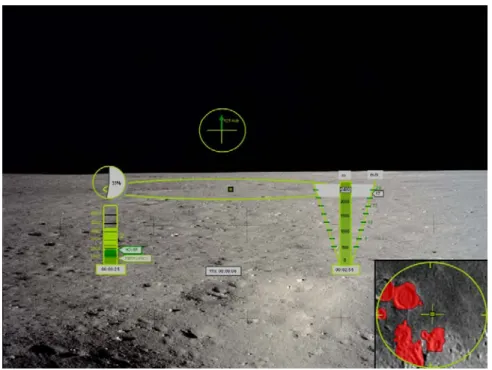
The Situational Awareness display focuses on integrating space and time information during the landing process, under nominal and off-nominal circumstances. One example of an off-nominal circumstance is the detection of an obstacle. Assuming that the detection was automated (e.g., LIDAR sensed a new hazard), this new information would be shown in the SA display as it affects the trajectory (Figure 20). Once the crew determines a new landing site (shown in blue, obstacle in red), a new trajectory, calculated and implemented by the GN & C, is shown in the profile view. Thus the LZ and SA displays would be integrated, showing changes on both in real-time.
a) Close up of Obstacle Detection b) Close up of Landing Site Redesignation Figure 20 Situational Awareness Display Details
3.4.2.5 Alternate Design Proposals
Throughout the design process, there have been several major design changes to the SA display. These will subsequently be described, including reasons for the alterations. The changes were implemented based on the many conversations, interviews, and peer-review sessions held during the design process.
In its original inception, the SA display included the top-down view of the landing site with the vertical profile. While there were some improvements to cognitively match these displays that had different points of view (Appendix A Interviews, Conversations, and Meetings: 8), it was soon determined that the top-down view was more closely related to the LZ display, where it now resides.
A time axis was once part of the profile view below the downrange axis. Since the forward velocity of the lander is not constant (decelerating towards the landing site), one of the two axes (time or distance) had to be non-linear. Common practice dictates to make the
distance linear and the time, non-linear. This would prevent a static axis in time for the profile view, which we hypothesize would be difficult for the user to understand. We prioritized space and time, and concluded that space was more important, hence it was kept as the major axis, and time is shown in other manners (specifically, in the Event List). One of our major sources of information used to understand the cognitive demands on the Apollo crew was the “Apollo Lunar Surface Journal” (Jones, 2000). The voice transcripts were critical in this respect, and inspired the vision of a digitized version of this for use in the landing process. The information datalink would provide the LAV operator a written history of all the conversations and textual information that was communicated between ground controllers and the others, such as a “command module” crew. A datalink is already in existence in aircraft and military operations, and this idea was incorporated into the SA display. It would digitize (and transcribe) all the voice transmissions between the crew, ground control (be it Earth or Moon), and the equivalent to a Command Module (likely, Crew Exploration Vehicle); it would also permit text inputs. It was eliminated in our design by an external review process, and this change gave space for two expansion boxes that our current design includes.
The most important change imposed by recently updated trajectory information occurred on the profile view. Originally, the Apollo trajectory phases were mapped horizontally, as the path was curvilinear (NASA, 1966). The Draper trajectories phases have the vertical as a more important component, greatly decreasing the time spent pitching over; many of the events occur over the landing site (a single point in the horizontal axis). The phases had to be placed vertically alongside the profile view in order to visualize them and avoid clutter. Furthermore, only the most important events, such as phase changes, could be highlighted in the vertical in order to prevent obstruction of other display elements.
3.4.3 Future SA Display Issues
There are issues that still need to be improved upon within the SA display, and are subsequently discussed in this section.
• The relationship between the vertical SA display and a horizontal SA display. A lateral error track display has not yet been integrated and this will mean that separate displays for vertical and horizontal views require the operator to integrate information across the SA and LZ displays, respectively. 3D displays can be investigated that transition seamlessly from horizontal to vertical but given the current time constraints of this project, this is not an option for at least another year. • Trajectory Updates. The guidance, navigation, and control systems will
continuously be updating the trajectory in real-time. Thus, the profile view of the trajectory should be refreshed every time the GN & C changes the trajectory. The crew, in order to maintain awareness, should be made aware of the changes and be informed of what the automation is doing. Furthermore, these changes affect the estimated times for touchdown. Should the display show every past trajectory change, just the previous one, or, in order to avoid clutter, just the current trajectory? The current design only depicts the new trajectory.
• Emergencies/Aborts. It has not been determined yet what information is most important within the SA display during an abort scenario. It is clear though that trajectory to landing site and nominal event lists is not essential during emergent situations. More likely, the SA display will show an abort checklist and abort opportunity windows visualization, with an emphasis on timing and location. This analysis has yet to be completed because there has been very limited information about abort criteria and scenarios.
• Display consistency. The human-automation allocation of activities should be consistent with the SS display. The SS display distinguishes between purely manual, purely automated, and possibly mixed control of an activity. This aspect will be incorporated in the SA display in the near future.
• Checklists/Procedures. Up to now, a list of events and checklists have been put forward based on Apollo-era documentations and trajectories, adapted to include the new Draper Lunar Access trajectories and components, such as LIDAR. Realistic checklists for the phases should be developed, but this requires a LAV simulator or model. Based on these, it can be more accurately determined what exactly the operators need to see under nominal and abort situations. These checklists are important for both the SA and SS displays.
3.5
System Status (SS) Display
3.5.1 Introduction
The many systems that needed monitoring in the Apollo missions were scattered around the Lunar Module as is seen in the pictures of the Lunar Module (Figure 3), but were critical to making the decision to abort and return to its orbit or to proceed with the mission. The crew had to prioritize the information for the different phases of the flight and had to know where to find the specific information in case of emergencies. The objective of this proposed system status display is to provide crew with immediate and prioritized health and status information, in addition to procedures/checklists in the occurrence of an event that requires intervention. To decrease the workload of the pilot/controller, automation is used to assist in monitoring the system status. Instead of displaying all information at the same time, the system status display only provides the information the pilot needs or requests. A second objective is to provide the crew with a reconfigurable space for systems management when nothing is happening that requires attention.
3.5.2 Motivation and Background Research
As part of the conduct of the cognitive task analysis, it was determined that the Lunar Module Pilot’s role in the landing sequence was to monitor all relevant aspects of the LM systems’ status (Appendix F: Summary of Apollo Press Kits), (Jones, 2000). This lead to the concept of the System Status (SS) display, designed for efficient cooperation between
the person responsible for monitoring health and status information2 and the automation. Archival Apollo research suggests that monitoring personnel must have access to a wide range of information (displayed by a multitude of gauges and meters in Apollo). From this research, a list was generated of the information requirements that the LMP could at one point wish to examine (Appendix D Preliminary System Status Information Requirements), (NASA, 1969b, 1969c).
The main challenge of the SS display was therefore to display all necessary information in a much smaller area, while avoiding clutter. This display allocation problem was solved through layering. The various information requirements were grouped in categories that make browsing intuitive and efficient. Integration of automation and human control in systems management through visualization was a central focus to both promote rapid and accurate decision making under time pressure as well as provide for high situational awareness of function allocation. The following sections will discuss the workings and purposes of each section of the display in greater detail.
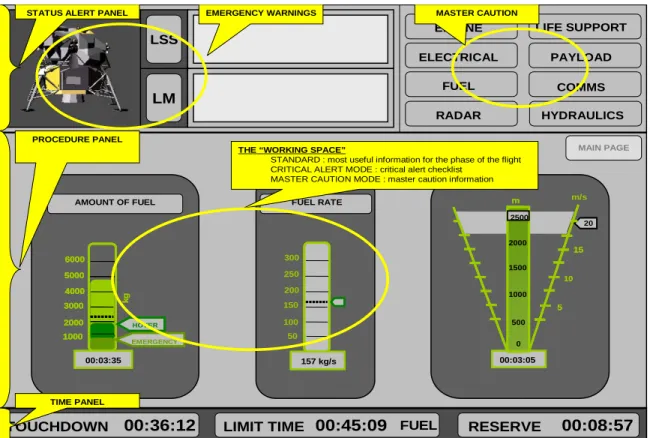
3.5.3 SS Display Design
The SS display, see Figure 21, consists of three primary components: 1) Status alert panel, 2) Procedure panel, and 3) Time panel. The status alert panel and the time panel are fixed modules because they represent critical information items that always need to be seen or are access points for lower level information. The procedure panel is a reconfigurable module which changes according to the information the LMP requests or needs in case of an event that requires intervention. See Appendix B Display Screen Shots: System Status Display; System Status Display for detailed SS display screenshots.
2
Since this position for the Lunar Access Vehicle is yet labeled, we will refer to the person monitoring health and status information as the LMP, understanding that in the LAV, this person may have a different title or may not even exist.