HAL Id: hal-01832859
https://hal-brgm.archives-ouvertes.fr/hal-01832859
Submitted on 9 Jul 2018
HAL is a multi-disciplinary open access archive for the deposit and dissemination of sci-entific research documents, whether they are pub-lished or not. The documents may come from teaching and research institutions in France or abroad, or from public or private research centers.
L’archive ouverte pluridisciplinaire HAL, est destinée au dépôt et à la diffusion de documents scientifiques de niveau recherche, publiés ou non, émanant des établissements d’enseignement et de recherche français ou étrangers, des laboratoires publics ou privés.
Monitoring of the soil depollution using geophysical
electrical methods: laboratory measurements
Mohammad Ali Iravani, Jacques Deparis, Hossein Davarzani, Alexis Maineult,
Stéfan Colombano, Roger Guérin
To cite this version:
Mohammad Ali Iravani, Jacques Deparis, Hossein Davarzani, Alexis Maineult, Stéfan Colombano, et al.. Monitoring of the soil depollution using geophysical electrical methods: laboratory measurements. 14èmes Journées d’Etude des Milieux Poreux - JEMP 2018, Oct 2018, Nantes, France. �hal-01832859�
______________________________________________________________________________________________________ FICPM - Nantes, France – October 8-10, 2018.
Monitoring of the soil depollution using geophysical electrical
methods: laboratory measurements
M. A. Iravania,b, J. Deparisa, H. Davarzania, A. Maineultb, S. Colombanoa, R. Guérinb aBRGM, 3 av. Claude Guillemin, Orléans cedex 2, 45060
bMETIS, UMR 7619, Sorbonne Université, Paris, 75005
Keywords: Spectral Induced Polarization, Time Domain Induce Polarization, Soil remediation, Complex
resistivity, Electrical methods
1. Introduction
In this decade, industrial activities in France has led to emergence some abandoned and polluted sites. After many years of research on the cleaning up the soil, the contamination of the soil because of DNAPLs (Dense Non-Aqueous Phase Liquid) is still one of the main environmental concerns.
There are some health and economic interests to clean up these sites with the innovative methods. The geophysics can be used to adjust and optimize the clean up process during the implementation work. Between all geophysical methods, the electrical methods have shown their ability to have the best performance in this issue [2]. In this study, we have chosen the Spectral Induced Polarization (SIP) method and Time Domain Spectral Polarization (TDIP) to follow up the resistivity and permittivity changes in the soil sample in the laboratory during the soil drainage-imbibition tests. The objective of this study is to link the geophysical-electrical signal with the presence of coal-tar pollutant.
2. Theory
1.1
Complex resistivity
Electrical resistivity, , is the constant of proportionality between the electrical current and the applied electric field (Ohm's Law) [1]. Variation of applied field has the main role in the current behaviour. Therefore, it should be independent on the frequency and time of the applied field. Absolutely, the electrical resistivity is complex with the form of . [1].
1.2
Mixing model
Interpretation of the study medium combined with the three different phases has the strongest connection to the understanding of the theories of the mixing models, which prepare methodology for multiphase systems. The study-mediums are the combination of three different phases (glass beads, water and DNAPLs), therefore, study about these phases and the standard method to study the relationship between the conductivity of the sedimentary rocks and its porosity is defined by an extremely important experimental law that is called generalised Archie’s law (equation (1)).
Where is the conductivity of the saturated rock (S/m), is the porosity and is the cementation factor of each phase. Generalized Archie’s law is established in the unsaturated-isothermal medium, but in the reality in some cases, we work with the non-isothermal medium. Therefore, we should take into account for this parameters as well.
3. Experimental setups
This study is based on the laboratory experiments, the laboratory tests carried out in the glass bead’s packed small cells (5.56 cm long, diameter of 5.80 cm) and 1D columns (25 cm long, diameter of 5.80 cm)
______________________________________________________________________________________________________ FICPM - Nantes, France – October 8-10, 2018.
in order to estimate residual saturations, resistivity, phase and error phase in the frequency and time domains. Packed small cells are used in order to obtain the relation between resistivity and saturation (calibration curve) and 1D columns are to validate the calibration curves obtained in small cells. Each experiment is deducted through three series of drainage and imbibition process. The glass bead’s size, temperature, and surfactants are varied for different experiments. The pollutant is a mixture of chlorinated organic compounds with the density of 1660 (kg/m3) and viscosity of 0.0045 (Pa.s).
The second part of the laboratory experiments is carried out in a 2D tank (40 cm×65 cm). The main objective of this experiment is to validate the mixing model and calibration curves during DNAPLs pumping tests within thermal enhancement (non-isothermal, two-phase flow) and to compare with what we observe from imaging technique.
4. Results and discussions
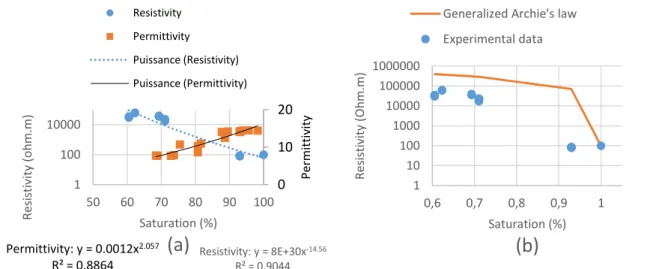
Figure 1a shows the calibration curve of saturation versus resistivity and permittivity in a small cell during the three cycles of drainage and imbibition. As water has the lower resistivity value than DNAPLs, the increase of water saturation decreases the resistivity values and the variation of saturation and permittivity is exponential (Figure 1a). The increasing of the water saturation has led to increasing of the permittivity value. Figure 2b is shown the experimental data fitting with generalized Archie’s law curve, in this figure, the generalized Archie's law overestimates the experimental results but captures well the behavior. In this study, because of very high resistivity of the pollutant, the zone of influence is reduced.
Figure 1: (a) Calibration curves for a small cell, saturation vs. resistivity for a cycle and saturation vs. permittivity, and (b) the experimental data fitting with generalized Archie’s law curve (glass beads’ dimeter=
0.5 mm, T=20 °C, f=1 Hz)
5. Conclusions and perspectives
An experiment was performed in three cycles of imbibition and drainage in a small cell, results proved that increasing of water saturation causes increasing and decreasing respectively in permittivity and resistivity. In the future, the data from all small cell experiments will be analysed in order to find a generalized multi-phase mixing model formulation. The proposed mixing model will be validated using drainage and imbibition tests in 1D columns and DNAPL pumping test in 2D tank. Moreover, the calibration curves may be used by the field data to find the saturation of each phase from the resistivity values.
6. References
[1] Wightman, W., Jalinoos, F., Sirles, P. and Hanna, K., Application of geophysical methods to highway related problems. federal highway administration, publication no,Technical report,FHWA-IF-04-021, Lakewood (2003).
Resistivity: y = 8E+30x-14.56 R² = 0.9044 Permittivity: y = 0.0012x2.057 R² = 0.8864 0 10 20 1 100 10000 50 60 70 80 90 100 Per mit ti vit y R es is ti vit y ( o h m.m ) Saturation (%)
(a)
Resistivity Permittivity Puissance (Resistivity) Puissance (Permittivity) 1 10 100 1000 10000 100000 1000000 0,6 0,7 0,8 0,9 1 R es is ti vit y ( O h m.m ) Saturation (%)(b)
Generalized Archie's law Experimental data
______________________________________________________________________________________________________ FICPM - Nantes, France – October 8-10, 2018.
[2] Vanhala, H., Laboratory and field studies of environmental and explo-ration applications of the spectral induced-polarization,