HAL Id: hal-02414160
https://hal.archives-ouvertes.fr/hal-02414160
Submitted on 16 Dec 2019HAL is a multi-disciplinary open access archive for the deposit and dissemination of sci-entific research documents, whether they are pub-lished or not. The documents may come from teaching and research institutions in France or abroad, or from public or private research centers.
L’archive ouverte pluridisciplinaire HAL, est destinée au dépôt et à la diffusion de documents scientifiques de niveau recherche, publiés ou non, émanant des établissements d’enseignement et de recherche français ou étrangers, des laboratoires publics ou privés.
Distributed under a Creative Commons Attribution - NonCommercial - NoDerivatives| 4.0 International License
Assessment of Sulfamethoxazole mobility in natural soils
and of the risk of contamination of water resources at
the catchment scale
Denisse Archundia, Celine Duwig, Lorenzo Spadini, Marie-Christine Morel,
Blanca Lucia Prado, M.P. Perez, V Orsag, Jean Martins
To cite this version:
Denisse Archundia, Celine Duwig, Lorenzo Spadini, Marie-Christine Morel, Blanca Lucia Prado, et al.. Assessment of Sulfamethoxazole mobility in natural soils and of the risk of contami-nation of water resources at the catchment scale. Environment International, Elsevier, 2019, �10.1016/j.envint.2019.104905�. �hal-02414160�
1
Assessment of Sulfamethoxazole mobility in natural soils and of the
1
risk of contamination of water resources at the catchment scale
2
D. Archundiaa,b,e*, C. Duwiga,#, L. Spadinia, M.C. Morela,c, B. Pradof, M.P. Perezd , V. Orsagg, 3
and J.M.F. Martinsa 4
a Univ. Grenoble Alpes, IRD, CNRS - IGE UMR 5001, Grenoble, France 5
b Consejo Nacional de Ciencia y Tecnología (CONACYT), México, D.F. 6
c CNAM, Laboratoire d’analyses chimiques et bioanalyses, Paris Cedex 3, France 7
d Universidad Mayor de San Andrés, Instituto de Hidrología e Hidráulica, La Paz, Bolivia 8
e Universidad Nacional Autónoma de México-Estación Regional del Noroeste 9
f Instituto de Geología, Universidad Nacional Autónoma de México, Coyoacán, Ciudad de 10
México, México 04510 11
g Universidad Mayor de San Andrés, Facultad de Agronomía, La Paz, Bolivia 12
*Present address: Estación Regional del Noroeste (ERNO), Hermosillo, Sonora, México 13
# Corresponding author: celine.duwig@ird.fr 14
Keywords: Antibiotic mobility, pollution risk, reactive transport, HYDRUS-1D, rate-limited 15
sorption 16
2
Abstract:
18
Sulfamethoxazole (SMX) is one of the antibiotics most commonly detected in aquatic and ter-19
restrial environments and is still widely used, especially in low income countries. SMX is as-20
sumed to be highly mobile in soils due to its intrinsic molecular properties. Ten soils with con-21
trasting properties and representative of the catchment soil types and land uses were collected 22
throughout the watershed, which undergoes very rapid urban development. SMX displacement 23
experiments were carried out in repacked columns of the 10 soils to explore SMX reactive 24
transfer (mobility and reactivity) in order to assess the contamination risk of water resources in 25
the context of the Bolivian Altiplano. Relevant sorption processes were identified by modelling 26
(HYDRUS-1D) considering different sorption concepts. SMX mobility was best simulated 27
when considering irreversible sorption as well as instantaneous and rate-limited reversible sorp-28
tion, depending on the soil type. SMX mobility appeared lower in soils located upstream of the 29
watershed (organic and acidic soils - Regosol) in relation with a higher adsorption capacity 30
compared to the soils located downstream (lower organic carbon content - Cambisol). By com-31
bining soil column experiments and soil profiles description, this study suggests that SMX can 32
be classified as a moderately to highly mobile compound in the studied watershed, depending 33
principally on soil properties such as pH and OC. Potential risks of surface and groundwater 34
pollution by SMX were thus identified in the lower part of the studied catchment, threatening 35
Lake Titicaca water quality. 36
37
1. Introduction
38
Antibiotics are considered as emergent contaminants, and soils can be exposed to antibiotics in 39
multiple field applications (use of sewage sludge or animal manure, irrigation with treated or 40
untreated wastewaters and polluted surface waters, outflows of sewage drains and of sewage 41
treatment plants) (Mojica and Aga, 2011; Oppel et al., 2004). 42
3 Sulfamethoxazole (SMX) belongs to the sulfonamide antibiotics family. It is used worldwide 43
since the 1960’s for the treatment of animal and human diseases. Its excretion rate varies be-44
tween 50% and 100% (Mojica and Aga, 2011) in humans and animals. It is commonly detected 45
in waste and surface waters as well as in soils and manure (Hoa et al., 2011; Hu et al., 2010; 46
Kim et al., 2011; Leung et al., 2012; Michael et al., 2013; Zuccato et al., 2010). 47
The mobility of sulfonamides in soils has been studied by a number of authors in the last decade. 48
Sulfonamides present generally high solubility in natural water. They present consequently low 49
affinity for solid surfaces and thus low solid-liquid distribution coefficients (Kd). Kd values of 50
sulfonamides in soils have been reported to fall in the range of 0.6 to 7.4 L kg-1 (Sarmah et al., 51
2006). Park and Huwe (2016) found SMX Kd values ranging between 1.1 and 1.39 L kg-1 for 52
Korean soils at soil pH (5.5). Srinivasan et al. (2013) reported Kd values for SMX in clay-loam, 53
silt, and silt-loam soils from New Zealand ranging between 2 and 4 L kg-1 with soil pH ranging 54
between 4 and 8. Boxall et al. (2002) observed Kd values of sulfachloropyridazine varying be-55
tween 0.9 and 1.8 L kg-1 (in silty-clay and sandy-loam soils, respectively). Due to these low Kd 56
values, Sulfonamides are supposed to be highly mobile in soils (García-Galán et al., 2008) with 57
high potential of groundwater contamination (Archundia et al., 2017a; García-Galán et al., 58
2010; Kümmerer, 2009; Mojica and Aga, 2011; Tamtam et al., 2008). The mobility of Sulfadi-59
azine studied with column displacement experiments by Wehrhan et al. (2007) was quite high 60
as it exhibited a retardation factor of 2 to 5 compared to a conservative tracer (Cl-). Likewise, 61
Hill et al. (2019) assessed the leaching of sulfonamides (including SMX) in undisturbed soil 62
columns under unsaturated conditions observing that all sulphonamides leached from the col-63
umns slightly after the conservative tracer. 64
Kurwadkar et al. (2011) found that sulfonamides mobility was dependent on pH, soil charge 65
density, and contact time; the effect of pH was found to be most pronounced in sandy loam 66
soils. In addition to the process of sorption with soil organic carbon, dissolved organic carbon 67
4 (DOC) content was also shown to affect antibiotics mobility. Zhang et al. (2016) observed that 68
sulfonamides are highly mobile in loamy-sand and silty-sand soils from China, and that irriga-69
tion with treated water increases their mobility as DOC increases antibiotics apparent solubility. 70
In parallel, DOC can form complexes with antibiotics thus reducing their mobility through 71
mechanisms of co-sorption on solid phases (Chefetz et al., 2008). 72
For organic and charged compounds such as SMX, a large variety of interaction mechanisms 73
is possible, such as complexation, ion bridging or covalent binding, polar interactions as well 74
as hydrophobic interactions, which can modify their sorption and mobility (Morel et al., 2014; 75
Srinivasan et al., 2014). SMX is characterized by two acid dissociation constants (pK1=1.6 and 76
pK2=5.7 (Boreen et al., 2004)). SMX anionic (SMX-) and cationic (SMX-H2+) forms dominate 77
at pH>pK2 and pH<pK1, respectively. At pK1 < pH < pK2 the neutral form (SMX-H) domi-78
nates. Overall, SMX speciation significantly affects its tendency to react with solid surfaces 79
and to chelate metal ions, and to undergo biodegradation or photolysis (Calvet, 1989; Dı́az-80
Cruz et al., 2003; Kim et al., 2011; Srinivasan et al., 2014; Srinivasan and Sarmah, 2014a). 81
Tamtam et al. (2011) reported that SMX can be associated with clay-iron complexes through 82
electrostatic adsorption, while neutral SMX can be easily adsorbed to soil organic carbon (Kur-83
wadkar et al., 2011). 84
Mechanistic studies on the mobility of sulfonamides in natural soils remain still limited. They 85
are rarely associated with a modelling approach, essential for identifying the relevant sorption 86
processes controlling the observed transport behaviour. One way of explaining solute transfer 87
that deviates from classical convection dispersion equation is to consider physical and/or chem-88
ical nonequilibrium. Generally, physical nonequilibrium transport models assume a two-region 89
or dual-porosity type formulation that partitions the liquid phase into mobile and immobile re-90
gions, while chemical nonequilibrium transport models assume kinetic interactions between 91
solutes in the liquid and solid phases (Simunek et al., 2013). 92
5 For example, Wehrhan et al. (2007) observed that kinetic sorption including two reversible 93
kinetics and one type of irreversible sorption sites was the most relevant process for the 94
transport of sulfadiazine in a silty loam soil. Martínez-Hernández et al. (2017) observed that 95
SMX transport in a sandy-loam soil can be well described with an equilibrium sorption model 96
accounting for non-linear sorption. Engelhardt et al. (2015) observed that sulfadiazine transport 97
in undisturbed and unsaturated sandy and silty-clay soils is efficiently modelled with a dual-98
permeability model in relation with the presence of preferential flow pathways. 99
However, we lack a global understanding of SMX mobility in different types of soils. A limited 100
number of studies have been conducted to date to evaluate its the mobility in natural soils, but 101
none in particular in arid soils from the Altiplano in the central Andes and at a catchment scale. 102
The objective of the present study was to evaluate and model the potential mobility of the sul-103
fonamide antibiotic SMX in natural soils with contrasted properties and land uses by identifying 104
the more relevant processes leading to SMX retention or retardation. Displacement experiments 105
were conducted in repacked columns of 10 soils, of variable mineralogical and physico-chem-106
ical characteristics, collected throughout the Bolivian Altiplano (Katari watershed). The Katari 107
watershed supports one of the fastest growing cities in Latin America (El Alto city). SMX was 108
detected in soils at concentrations ranging from 0 to 18 µg kg-1 (Archundia et al., 2017a). Ex-109
perimental and field work permitted to evaluate the potential of dissemination of SMX in the 110
studied zone and the vulnerability of surrounding water bodies such as the Lake Titicaca and 111
groundwater. Inverse modelling performed with HYDRUS-1D was efficiently applied to fit 112
SMX column transport results considering different reactivity and hydrodynamic concepts. 113
114
2. Material and methods
115
2.1. Soils
116
2.1.1. Soils description and sampling 117
6 Soils description was conducted in April 2014 during the wet season, when soil profiles were 118
opened at nine locations along the four main rivers of the studied watershed (Seke, Seco, Pallina 119
and Katari rivers, described in Archundia et al. (2017b) according to the methodology proposed 120
in the Guidelines for Soil Description (FAO, 2006). They represent the variety of soil types and 121
soil use in the catchment. Soils 1 and 2 correspond to high altitude soils of non-urban influence. 122
Soil 3 corresponds to a soil of low-urban influence. Soils 4 and 5 were collected at the vicinity 123
of the wastewater treatment plant (WWTP) of Puchukollo, but only the profile of soil 5 was 124
described. Soil 4 permanently receives untreated wastewater, and soil 5 is part of an agricultural 125
trial receiving treated wastewater every week for 2 months. Soil 6 was sampled in the lower 126
Pallina River in a cropped barley plot. Soils 7 and 8 were sampled in a barley plot located in 127
the upper and lower zones of the Katari River, respectively. Soils 9 and 10 were sampled on the 128
shores of Lake Titicaca, in cropped quinoa and potato plots respectively, which are partially 129
flooded when the lake level is high. According to Bolivian FAO soil maps (FAO, 1998), soils 130
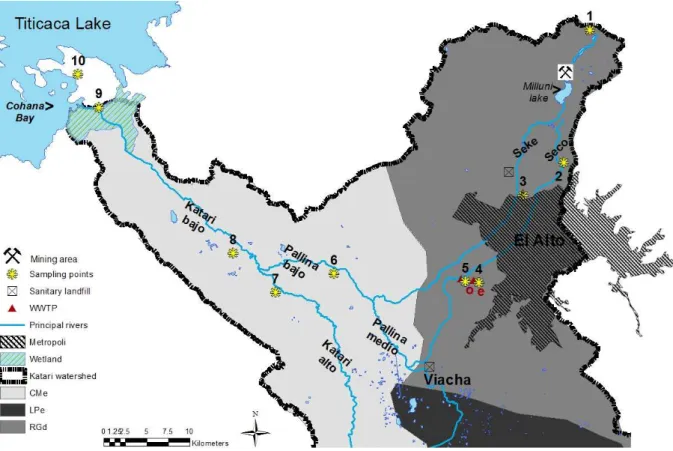
1 to 5 are classified as Distric Regosols and soils 6 to 10 as Eutric Cambisols (Figure 1). 131
At each profile, soil samples were taken in each horizon and composite soil samples were taken 132
at the surface layer (0–15 cm) for the column experiments, with the same amount of soils col-133
lected at 5 different points separated by 5 m within the same plot. In the laboratory, composite 134
soil samples were air-dried and sieved (2-mm). 135
7 136
Figure 1. Study site and sampling points. e: refers to the entrance of the wastewater treatment
137
plant (WWTP) of Puchukollo. o: refers to the outlet of the WWTP. CMe (Eutric Cambisol), RGd 138
(Distric Regosol) and LPe (Eutric Leptosol) refer to soil types (FAO, 1998). 139
140
2.1.2. Soil chemical characteristics 141
For the topsoil composite samples, chemical analyses were performed at the INRA Analysis 142
Laboratory (Arras, France). The soil analysis for lower horizons was performed at IBTEN La-143
boratory (Bolivia). Total nitrogen (N) was analysed by dry combustion (norm NF ISO 13878). 144
Organic carbon (OC) was determined by direct determination by dry combustion (norm NF 145
ISO 10694). For iron oxides (Feoxy) contents, an extraction was conducted by the Mehra and 146
Jackson method (Mehra and Jackson, 1960), and the determination of Fe concentrations was 147
conducted by ICP-AES. pH was measured with a Mettler Toledo electrode at a soil to water 148
ratio of 1/5 (v/v) (norm NF ISO 10390). Cu extraction was performed based on the US EPA 149
3052 method by microwave-assisted extraction (MAE) as described in Archundia et al. 150
8 (2017b). Final suspensions were analysed by ICP-AES with external calibration (Limit of de-151
tection, LD: 1.2 µg L-1 and Limit of Quantification, LQ: 3.7 µg L-1). Quality assurance and 152
control (QA/QC) of the analysis were performed with Tibet Sediment (NIM GBW07323) cer-153
tified reference material (CMR). Recovery for Cu was of 71.6%. 154
155
2.1.3. Soil physical characteristics 156
Soil texture analysis was carried out at the INRA Laboratory (France) with a five particle size 157
fractions granulometer without further decarbonization (norm NF X 31-107). Mineralogy was 158
determined by X-ray diffraction (Siemens D5000 and Bruker Axs D8). Bulk density was deter-159
mined from 3 soil surface samples carefully recovered with a 140 cm3 metal ring, after drying 160
at 105°C for 24h. 161
To determine the in situ saturated hydraulic conductivity (Ksat), we used a tension disc infitrom-162
eter of 20 cm diameter set to subsequent pression head, h, of -10, -5, and -0.5 cm at the surface 163
of soils representative of the upper (soils 2 and 3) and the lower (soils 6, 7 and 8) Katari catch-164
ment. Following the protocol described in Müller et al. (2012), we determined the relationship 165
between hydraulic conductivity and tensions by assuming that the Darcy flux (q, cm min-1) 166
under the disc was given by Wooding’s equation (Wooding, 1968) and that the hydraulic con-167
ductivity followed an exponential function with pression head (Gardner, 1958): 168
K = Ksat e(αh) (1) 169
where Ksat is the saturated hydraulic conductivity (cm min-1), h the pressure head (cm) and α a 170
soil-dependent parameter (cm-1). We derived the parameters Ksat and α through a linear regres-171
sion of the data points (h, ln q). 172
9
2.2. Column transport experiments
174
2.2.1. Column experiments 175
The methodology was adapted from the OECD guideline “Leaching in Soil Columns” (OECD, 176
2003). Experiments were done in duplicate for each soil on the topsoil composite samples, un-177
der steady state and near-saturated conditions, using bromide (Br−) as nonreactive solute to 178
estimate soil hydrodynamic transport parameters. Experiments were done at constant ionic 179
strength with a 0.01M CaCl2 background solution and at soil pH. 180
The main experimental conditions are shown in SI.II. Air-dried sieved soils were packed into 181
glass columns of 2.6 cm internal diameter to a depth of about 10 cm at a bulk density close to 182
the field ones, except for soils from the upper watershed, where it was impossible to reach the 183
field bulk density because of the high organic carbon content. The column was then weighed 184
and the soil bulk density calculated. At the bottom of the column a peristaltic pump pushed the 185
solutes towards the top of the column. The column was first saturated by injecting a background 186
solution of 0.01M CaCl2 at a low flow rate of 0.03 cm3 min-1 during 1 pore volume (PV). Water 187
flow was then increased to 0.3 cm3 min-1 (equal to a Darcy flow of 0.9 10-5 m s-1). This flow 188
was adjusted to field soil saturated hydraulic conductivities. At the outlet of the column, the 189
leachates were sampled with an automatic fraction collector (Gilson FC203B). At the beginning 190
of a column transfer experiment, about two PVs of 0.01M CaCl2 solution were leached through 191
the column using a peristaltic pump to reach a steady-state flow rate and a stable electrical 192
conductivity in the effluent. The column was weighed to determine the volumetric water con-193
tent. Then 0.01 M bromide was injected during ~0.5 PV and leached with 2.5 PVs of 0.01M 194
CaCl2. Then, one PV of 0.25 mg L-1 SMX solution with a final content of 0.1% MeOH (diluted 195
from 1 g L-1 SMX-methanol using 0.01M aqueous CaCl2) was injected and leached with 3 to 196
10 PVs of 0.01M CaCl2 solution depending on the soil types. 197
10 During steady-state conditions, the flow rate was fixed at 0.3 cm3 min-1 and the working pres-198
sure was consequently highly variable between soils: the bottom-up flow ensured working in 199
near-saturation conditions. The Eluted Mass (EM) was controlled by weighing both the input 200
solution container (continuous measurement) and the collector tubes. Br− and SMX were meas-201
ured in each tube, and pH in each 5th tube. 202
2.2.2. Chemical analysis 203
Br− was measured by ion chromatography (Metrohm 732/733 separation center, Metrosep-204
ASupp 16 – 150mm, and Metrosep C2-150 mm anion column) based on the USEPA Method 205
300.0. Calibration standards were prepared from an Anion Multi-Element Standard (Roth). 206
Limits of detection (LD) and of quantification (LQ) were determined based on a signal to noise 207
ratio of 3 for both LD (2.66 10-3 mg L-1) and LQ (7.97 10-3 mg L-1). 208
After samples filtration (Chromafil Xtra PVDF, 0.45 µm) SMX was analysed by HPLC-UV 209
(Spectra system UV 100, Thermo Separation Products) equipped with a C-18 (EC 125/3 NU-210
CLEOSIL 100-5 C18, 5 µm) column. The detection wavelength was 269 nm and the tempera-211
ture was maintained at 40° C. The mobile phase was composed of ACN (15%), MeOH (15%), 212
ultrapure water (70%) and formic acid (0.02%) with a fixed flow rate of 0.5 ml min-1. Time 213
analysis was fixed to 10 min, with an injection volume of 20 μL and three injections per sample. 214
Quantification was carried out by external calibration and measurement of peak areas. The LD 215
and LQ of SMX were 0.1 mg L-1 and 0.5 mg L-1, respectively(signal to noise ratio of 3 for 216
both). The analytical method was validated by the method of accuracy profiles (Feinberg and 217
Laurentie, 2010). No SMX and Br were detected in the leachates of non-contaminated soils. 218
219
2.2.3. Reactive transfer parameters 220
In modelling, the soil saturation condition was assumed. To confirm the saturated condition, 221
the soil water content was compared to the porosity n (SI.II), which was determined as: 222
11
= 1 − (2)
223
where is the solid particle density (g cm-3) and is the soil bulk density (g cm-3). To con-224
sider the wide range of organic carbon content (Corg) of our soils, which can affect the value of 225
solid density, the following equation to estimate the solid particle density was taken from Rühl-226
mann et al. (2006): 227
= 2.583 − 0.025 (3)
228
The reactive transfer parameters (dispersivity, distribution coefficient, sorption/desorption rate, 229
fraction of instantaneous sorption sites, irreversible sorption first-order constant) were obtained 230
by fitting a numerical solution of the convection dispersion equation (CDE) to the experimental 231
breakthrough curve (BTC) (SI.I Eq. (7)). The degradation constant was fixed with experimen-232
tally obtained values from batch experiments realized in 250 mL glass bottles with soil slurry 233
(data not published, Table 2) using experiments performed following the procedure described 234
by (Martins and Mermoud, 1998). 235
The finite element code HYDRUS-1D (Simunek et al., 2008) has already been successfully 236
used to study the fate and transport of pharmaceuticals (García-Santiago et al., 2017; Martínez-237
Hernández et al., 2017). We used it in inverse modelling mode. The dispersion coefficient D 238
(SI.I Eq. (7)) was first determined by fitting the numerical solution of the CDE to the experi-239
mental bromide BTC. The bromide was assumed to be inert and considered as a water tracer. 240
The fitting of the bromide BTC allowed the determination of the dispersivity,
λ
(cm), for each 241column experiment: 242
λ=D/
ν
(4)243
where v is the average pore water velocity (cm min-1). 244
This equation considers that molecular diffusion is negligible compared to hydrodynamic dis-245
persion, which is valid for Peclet numbers (Pe =
ν
L/D) larger than five, according to Kutilek 24612 and Nielsen (1994). For the velocity flux range used in this study, the Peclet number was always 247
larger than five. 248
The second step was to adjust the numerical solution of the convection-dispersion equation 249
(CDE) with reactive solute transport to the experimental SMX BTC. 250
To evaluate the fit goodness , we used different statistical criteria (Loague and Green, 1991): 251
The coefficient of determination (R²) was calculated as shown by Eq. (5): 252
R²= ∑ !" − / ∑ !" − (5)
253
Model efficiency (EF) is given by Eq. (6). Perfect agreement of the model and experimental 254
data is given by EF =1. 255
#$ = %∑ !" & − ∑ ' − ( !" ) / ∑ !" & (6)
256
where P are the predicted values; O are the observed values; n is the number 257
of samples; and is the mean of the observed data. 258
259
3. Results and discussion
260 261
3.1. Soil properties
262
For the upper Katari catchment a Ksat of 0.5 (± 0.1) 10-5 m s-1 was obtained and the average bulk 263
density was 1.2 g cm-3. These values were attributed to soils 1 to 5. In the lower Katari water-264
shed, we found a Ksat 1.7 (± 1.5) 10-5 m s-1 for freshly ploughed soils and 0.3 (± 0.1) 10-5 m s-1 265
for soils left fallow, with an average bulk density of 1.3 g cm-3. These values were attributed to 266
soils 6 to 10. 267
Soil profiles description can be found in SI.III. Soils 1, 2 and 3 superficial horizons (0–15 cm) 268
are organic of granular structure with high porosity, with extremely acid to highly acid pH (pH 269
from 4.6 to 5.4) due to the high OC content (3.6 to 8.2 %). Below the upper 15–20 cm layer, 270
the sand, gravel and stones contents increase considerably, favouring vertical water infiltration 271
13 as well as lateral water flow in the slope direction. For soils 4, 5, 6, 7 and 8, the pH in the 272
superficial horizon varies from highly acidic (5.4) to slightly alkaline (8.5). These soils are 273
moderately deep and the A horizon has loamy or loamy/sandy texture, with low OC content. 274
Only soil 4 presents a high OC content, due to continuous arrival of waste waters from the 275
WWTP. The sand and gravel contents increase with depth in soils 5 and 6, favouring potentially 276
a good vertical water transfer. In contrast, in profiles 7 and 8, an increase of the clay content 277
with depth may limit water infiltration. Superficial horizons of soils 9 and 10 are of loamy 278
texture and have moderate fertility and slightly alkaline pH (8.3 and 8.4). Finer materials such 279
as silt and clay increase in lower horizons of which soils, which could limit water infiltration 280
compared to topsoil horizons. 281
282
3.2. Bromide transport
283
Table 1 presents the model estimated and calculated parameters as well as EM (eluted mass) 284
fractions of bromide BTCs. The bromide (Br-) mass balance varied between 97% and 110% 285
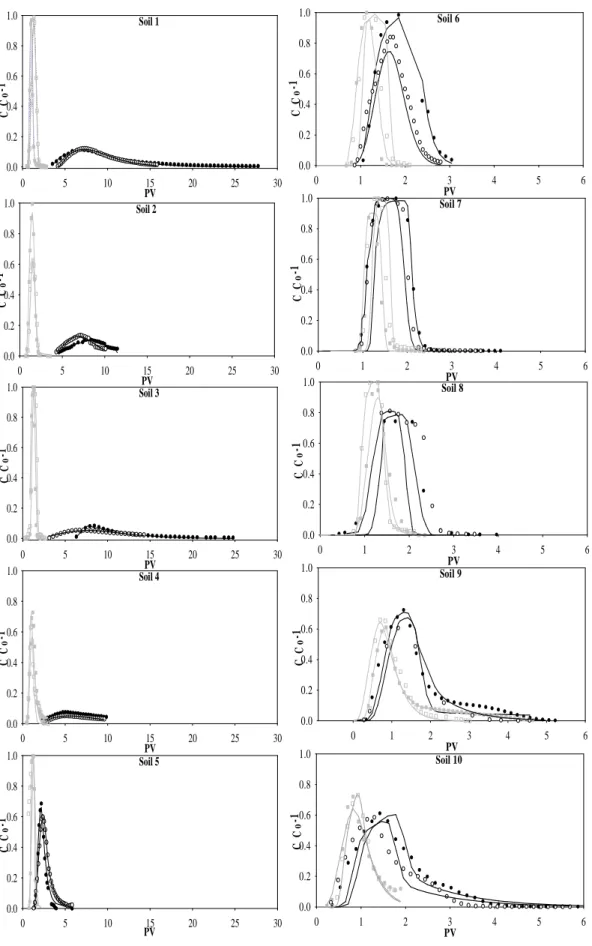
(Table 1). No tailings were observed in bromide BTCs except in soils 9 and 10 (Figure 2). The 286
absence of significant tailings indicates the presence of physical equilibrium, i.e. a mono-modal 287
flow. In the case of soils 9 and 10, bi-modal flow (or physical non-equilibrium) could have 288
slightly affected bromide transport. Transport parameters derived from the bromide conserva-289
tive tracer BTCs are shown in Table 1. The determination coefficients (R²) always indicated a 290
good fit of the data (R² ranging between 0.9 and 0.99). Dispersivity values, λ, calculated for the 291
10 soils, varied between 0.02 and 1.64 cm. Due to packing differences, column duplicates from 292
the same soil did not have the same bulk density, leading to differences in the fitted dispersivity 293
values. For soils 1 to 4, with high organic carbon contents, the process of packing was difficult 294
and the soil bulk density in the columns did not reach the field ones (SI.II). As found by Perfect 295
et al. (2002) observed OC contents and
λ
values were well correlated (R² = 0.5). This correlation 296could be due to the fact that organic carbon is involved in the binding of small soil particles 297
14 into larger particles, which increases soil aggregation and thus soil tortuosity for water path-298
ways. 299
300
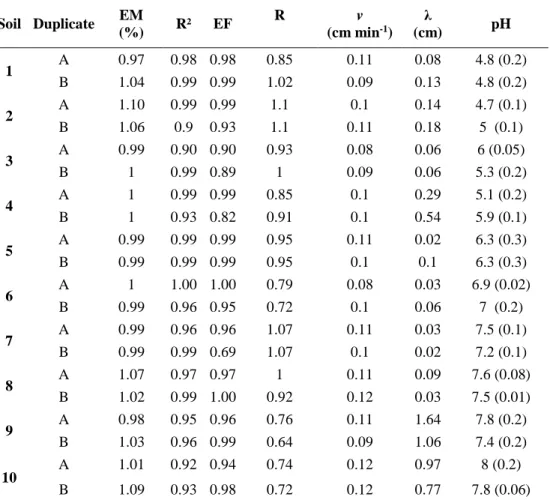
Table 1. Transport parameters, Eluted mass (EM) fractions of bromide-tracer BTCs and average 301
pH of leachates during the experiment (standard deviation is given in parenthesis). 302 Soil Duplicate EM (%) R² EF R v (cm min-1) λ (cm) pH 1 A 0.97 0.98 0.98 0.85 0.11 0.08 4.8 (0.2) B 1.04 0.99 0.99 1.02 0.09 0.13 4.8 (0.2) 2 A 1.10 0.99 0.99 1.1 0.1 0.14 4.7 (0.1) B 1.06 0.9 0.93 1.1 0.11 0.18 5 (0.1) 3 A 0.99 0.90 0.90 0.93 0.08 0.06 6 (0.05) B 1 0.99 0.89 1 0.09 0.06 5.3 (0.2) 4 A 1 0.99 0.99 0.85 0.1 0.29 5.1 (0.2) B 1 0.93 0.82 0.91 0.1 0.54 5.9 (0.1) 5 A 0.99 0.99 0.99 0.95 0.11 0.02 6.3 (0.3) B 0.99 0.99 0.99 0.95 0.1 0.1 6.3 (0.3) 6 A 1 1.00 1.00 0.79 0.08 0.03 6.9 (0.02) B 0.99 0.96 0.95 0.72 0.1 0.06 7 (0.2) 7 A 0.99 0.96 0.96 1.07 0.11 0.03 7.5 (0.1) B 0.99 0.99 0.69 1.07 0.1 0.02 7.2 (0.1) 8 A 1.07 0.97 0.97 1 0.11 0.09 7.6 (0.08) B 1.02 0.99 1.00 0.92 0.12 0.03 7.5 (0.01) 9 A 0.98 0.95 0.96 0.76 0.11 1.64 7.8 (0.2) B 1.03 0.96 0.99 0.64 0.09 1.06 7.4 (0.2) 10 A 1.01 0.92 0.94 0.74 0.12 0.97 8 (0.2) B 1.09 0.93 0.98 0.72 0.12 0.77 7.8 (0.06)
EM: eluted mass fractions. EF: model efficiency. RMSE: root mean square error. R2: coefficient of determination.
303
R: retardation factor for bromide (fitted). v: pore water velocity (obtained experimentally). λ: dispersivity (fitted). 304
305
The degree of water saturation varied between 0.8 and 1 (i.e. saturation conditions for most of 306
the columns, SI.II) except for column 1A (0.72), for which this low water saturation level may 307
have induced the presence of immobile water (trapped by air bubbles) explaining the observed 308
low Retardation factor of Br-. Variations in water saturation are due to specific behaviour of 309
the soils and/or water content estimation errors, in the case of the column 1A water saturation 310
was not reached. 311
15 As a fixed retardation factor of 1 (value for a water tracer) did not lead to good fits of the 312
experimental bromide BTC for some soils, a retardation factor had to be fitted for all soils. The 313
retardation factor varied within 15% of the unit value for almost all columns indicating an ac-314
ceptable conservative tracer behaviour of the bromide ion. 315
However, for soils 6, 9 and 10, the fitted retardation factor of Br- was particularly low (0.64 to 316
0.76). It can be assumed that these low R values relate to anionic exclusion or exchange pro-317
cesses, which are known to affect the mobility of negatively charged chemicals in soil. Repul-318
sion of Br- by negative surface charges (from organic matter sites ionised at high pH and clay 319
exchanger sites) prevents Br– ions from approaching the slowly flowing surface water layers, 320
thus reducing the effective porosity seen by Br-. Significant reduction of effective porosities 321
for Br- were observed (10 to 50%; James and Rubin, 1986, Melamed et al., 1994, Gvirtzman 322
and Gorelick, 1991). This reduction generates a corresponding diminution of fitted R values 323
below one. Within the alkaline soils (soils 6 to 10), Br- in the soils 6, 9 and 10 may had encoun-324
tered this situation as they have high OC and high clay content, compared to soils 7 and 8. 325
3.3. Sulfamethoxazole transport
326
3.3.1. Experimental SMX breakthrough curves 327
The recorded pH values in column leachates (Table 1) were comparable to the pH of bulk soils 328
(SI.III) and remained stable during the whole displacement experiment (standard deviations 329
ranging between 0.05 and 0.2). 330
The centre of gravity of the SMX BTCs was delayed relatively to the bromide BTC in all stud-331
ied soils (Figure 2), with much higher SMX retardation in soils 1 to 4 than in soils 5 to 10. This 332
is indicative of the presence of retention processes linked with the reactivity of SMX and with 333
soils properties. Tailings were observed in all SMX BTCs except in those for soils 6, 7 and 8. 334
The BTCs tailings were generally much more extended in soils 1 to 4 in which SMX retardation 335
was higher, suggesting the existence of hysteresis in the desorption process. 336
16 337
3.3.2. Simulated SMX breakthrough curves 338
The model estimated parameters as well as the EM fractions and model statistics (Eq. (5) and 339
(6)) are presented in Table 2. 340
The EM fractions were calculated from simulated BTCs, the EM fractions varied strongly be-341
tween 35% and 99%. They were higher (between 67% and 99%) for the weakly SMX-binding 342
soils 5 to 10 than for soils 1 to 4 (between 67% and 35%). This mass deficit was considered to 343
be related to: (1) biodegradation and (2) irreversible sorption. From independent microcosm 344
experiments (Archundia, 2016), first-order degradation rates (µ) were determined as ranging 345
between 7.6 10-7 to 7.8 10-6 min-1, depending on the soil (Table 2). However, these rates were 346
too small to explain the mass balance deficit. Consequently, the experimentally determined 347
SMX depletion (i.e. the mass balance deficit) was represented as a sum of two parameters in 348
the HYDRUS-1D modelling: a fixed biodegradation rate µ (fixed; minor contribution) and an 349
irreversible sorption rate β3 (fitted, major contribution; Table 2). 350
Table 2 shows the best model explaining SMX sorption behaviour for each soil column. SMX 351
BTC in soil 1 was best represented by the 3 sites-2 rates- Freundlich sorption model (3-2-F in 352
Table 2). SMX BTCs in soils 2 to 4 were best represented by the 3 sites-2 rates- linear sorption 353
model (3-2-L in Table 2). SMX BTC in soil 5 was best represented by the 2 sites-2 rates- Freun-354
dlich sorption model (2-2-F in Table 2). SMX BTCs in soils 6 to 10 were best represented by 355
the 2 sites-2 rates- linear sorption model (2-2-L in Table 2). In the 2 sites-2 rates- Freundlich/lin-356
ear and irreversible sorption models, the instantaneous sorption sites (S1) were omitted 357
(Wehrhan et al., 2007), while the 3 sites-2 rates- Freundlich/linear sorption models consider the 358
three types of sorption sites, considered to exist independently (i.e. instantaneous, rate-limited 359
and irreversible sorption as described in the theory of reactive solute transport section of SI.I). 360
Observed differences could be attributed to the elevated OC contents of soils 1-4 (6 to 10%) 361
17 which makes the sorption process more complex. Elevated OC content contributes to the het-362
erogeneous distribution of SMX adsorption sites between the soil aggregates where instantane-363
ous sorption will take place and the aggregates internal pores where rated-limited sorption will 364
exist thus retarding their migration (Pignatello, 2000). 365
Despite the good fittings with model 2-2-L-I (see Table 2 for detailed description) it failed to 366
describe extended tailings of SMX BTCs for soils 9 and 10, as shown by the lower R² and EF 367
values for columns 9A, 10A and 10B (Figure 2, Table 2). For these two soils, the SMX BTCs 368
tails might be rather due to the addition of multi-modal flow processes, as detected in the bro-369
mide BTCs tailings. The observed SMX tails for soils 9 and 10 may thus be related to diffusive 370
exchange between highly mobile solutes in preferential flow pathways and solutes in relatively 371
stagnant water (Johnston et al., 2005). 372
18
Table 2. Fitting parameters of the best fitting model of SMX BTCs. 373
Soil Duplicate Best Model
EM (%)
Model sta-tistics
Fitted parameters Fixed
pa-rameter R² EF Kd (L kg-1) R F * (min-1) + 3 (min-1) µ (min-1)
1 A 3-2-F-I 50.6 0.98 1 4.16 8.35 3.6E-01 (0.01) 7.5E-03 (5.E-04) 6.1E-03 (2.3E-04) 0
B 3-2-F-I 59.8 0.99 0.99 5.30 8.33 5.0E-01 (0.08) 8.4E-03 (3.E-04) 4.4E-03 (1.9E-02) 0
2 A 3-2-L-I 58.8 0.91 0.90 3.12 7.73 4.6E-04 (5.E-05) 3.9E-02 (3.E-03) 7.4E-03 (3.8E-04) 5.6E-6
B 3-2-L-I 66.7 0.96 0.96 2.90 7.02 1.1E-02 (0.4) 4.1E-02 (2.E-02) 4.9E-03 (2.6E-02) 5.6E-6
3 A 3-2-L-I 40.0 0.97 0.95 4.41 7.69 5.9E-01 (0.01) 7.2E-03 (6.E-04) 8.9E-03 (2.9E-04) 7.8E-6
B 3-2-L-I 48.0 0.89 0.89 4.24 6.90 4.3E-03 (4.E-03) 1.1E-02 (1.E-04) 6.4E-03 (9.9E-05) 7.8E-6
4 A 3-2-L-I 42.0 0.95 1 3.87 6.84 1.1E-01 (0.02) 8.6E-03 (5.E-04) 5.4E-03 (8.1E-04) 6.6E-6
B 3-2-L-I 35.0 0.96 0.96 3.93 7.11 3.0E-01 (9E-03) 7.8E-03 (4.E-04) 7.5E-03 (1.8E-04) 6.6E-6
5 A 2-2-F-I 67.0 0.88 0.90 0.31 1.81 0 1.5E-01 (5.E-02) 3.9E-03 (7.1E-04) 2.6E-6
B 2-2-F-I 82.5 0.99 0.99 0.4 2 0 9.2E-02 (4.12E-03) 1.7E-03 (1.7E-04) 2.6E-6
6 A 2-2-L-I 99.0 0.97 0.97 0.06 1.11 0 8.19E-02 (3.7E-02) 1.2E-04 (3.2E-04) 3.5E-6
B 2-2-L-I 82.7 0.97 0.97 0.4 2 0 1.56E-01 (2.4E-02) 1E-06 (6.01E-17) 3.5E-6
7 A 2-2-L-I 98.0 1 1 0.04 1.10 0 2.E-01 (3.E-02) 2.1E-04 (3.5E-04) 7.6E-7
B 2-2-L-I 90.0 0.99 0.98 0.06 1.14 0 1.E-01 (2.E-02) 1E-06 (4.1E-04) 7.6E-7
8 A 2-2-L-I 94.0 0.99 0.99 0.12 1.31 0 1 (1) 3.1E-03 (4.5E-04) 9.7E-7
B 2-2-L-I 90.0 0.99 0.99 0.08 1.25 0 8.8E-01 (3.E-01) 3.7E-03 (4.4E-04) 9.7E-7
9 A 2-2-L-I 98.0 0.9 0.60 0.19 1.47 0 7.2E-03 (5.E-02) 2.6E-03 (1.8E-03) 9.7E-7
B 2-2-L-I 96.0 1 0.78 0.07 1.18 0 1.1E-01 (9.E-03) 3.4E-04 (2.8E-04) 9.7E-7
10 A 2-2-L-I 82.9 0.86 0.86 0.19 1.57 0 1.29E-02 (5.2E-03) 2.6E-03 (1.2E-03) 3.8E-6
B 2-2-L-I 83.0 0.80 0.76 0.11 1.32 0 1.8E-02 (2.E-03) 4.E-03 (9.7E-04) 3.8E-6
Model refers to the model that best fits the observed data. Names of models are composed as follows: number of sorption sites-number of rates-sorption concept (L: linear and 374
F: Freundlich)-reversibility of sorption process (irreversible: I and reversible: R). EM: Eluted mass fraction, R2: coefficient of determination, EF: model efficiency, R: retardation
375
factor calculated with Kd value, Kd: distribution coefficient for the linear model, F: Fraction of adsorption sites available for instantaneous sorption, ß3: Irreversible adsorption
376
rate coefficient, α: First order coefficient rate for one site or two sites non-equilibrium adsorption, µ: first-order degradation rate coefficient determined from batch experiments 377
(Archundia, 2016). Standard deviation is given in brackets. 378
19 Soil 6 PV 0 1 2 3 4 5 6 C C o -1 0.0 0.2 0.4 0.6 0.8 1.0 Soil 7 PV 0 1 2 3 4 5 6 C C o -1 0.0 0.2 0.4 0.6 0.8 1.0 Soil 8 PV 0 1 2 3 4 5 6 C C o -1 0.0 0.2 0.4 0.6 0.8 1.0 Soil 9 PV 0 1 2 3 4 5 6 C C o -1 0.0 0.2 0.4 0.6 0.8 1.0 Soil 10 PV 0 1 2 3 4 5 6 C C o -1 0.0 0.2 0.4 0.6 0.8 1.0 379
Figure 2. Duplicate experimental (dots) and fitted (lines) BTCs for Br- tracer (gray line) and 380
for SMX (black lines). The corresponding fitting parameters are presented in Table 1 and 2. 381 Soil 1 PV 0 5 10 15 20 25 30 C C o -1 0.0 0.2 0.4 0.6 0.8 1.0 Soil 2 PV 0 5 10 15 20 25 30 C C o -1 0.0 0.2 0.4 0.6 0.8 1.0 Soil 3 PV 0 5 10 15 20 25 30 C C o -1 0.0 0.2 0.4 0.6 0.8 1.0 Soil 4 PV 0 5 10 15 20 25 30 C C o -1 0.0 0.2 0.4 0.6 0.8 1.0 Soil 5 PV 0 5 10 15 20 25 30 C C o -1 0.0 0.2 0.4 0.6 0.8 1.0
20 There is considerable evidence that the sorption of organic compounds such as SMX has an 382
instantaneous equilibrium component and a slower time-dependent component (Martins and 383
Mermoud, 1998 ; Pignatello, 1989), leading to BTCs with tailings. Diffusion of SMX molecules 384
at the surface of soil organic carbon (for short times) and intra-organic carbon diffusion (for 385
longer times) are possibly responsible mechanisms for rate-limited sorption, as has been already 386
observed for a wide range of other organic compounds such as the herbicide simazine (Fortin 387
et al., 1997) or the pesticide parathion (Leenheer and Ahlrichs, 1971). Furthermore, the contri-388
bution of mineral surfaces to the observed rate-limited sorption has to be taken into account, as 389
it is well known that polar compounds, such as SMX, can have significant interactions with 390
inorganic soil components (Martins and Mermoud 1998). However, it cannot be excluded that 391
at least a part of the observed tailing was caused by slow (rate-limited) SMX desorption (Car-392
rillo et al., 2016). Drillia et al., (2005) reported similar results for SMX while Wehrhan et al., 393
(2007) observed that the sorption of sulfadiazine was also rate-limited. 394
For all BTCs, the best fits were obtained with the models that partly consider irreversible sorp-395
tion (I term in the names of models in Table 2), which is in accordance with the calculated EM 396
fractions (Table 2). Irreversible sorption can be attributed to the formation of organic complexes 397
between the chemicals in the irreversible compartment and the colloidal organic carbon of the 398
soil. Furthermore, Kan et al. (2000) proposed that at least a part of the irreversible sorption of 399
hydrophobic organic compounds can presumably be caused by entrapment in soil organic car-400
bon increasing the constrictivity of the solid phase to chemical diffusion. 401
402
3.4. Relation between transport parameters and soil properties 403
To facilitate the determination of the retardation factor for soils 1 and 5, which were best de-404
scribed by the Freundlich model we fitted it again by imposing a linear isotherm. The obtained 405
21 Kd values are shown in Table 2. The fits were still acceptable, with R2 and EF varying between 406
0.9 and 0.99, whereas they varied between 0.94 and 0.99 with the Freundlich isotherm. 407
The comparison of SI.III and Table 2 shows that compared to soils 5–10, SMX in soils 1-4 408
presents a markedly higher retardation factor (6.9 to 8.4 vs 1.1 to 1.8) probably related to the 409
markedly higher OC content (3.6 to 10.3 % vs 0.4 to 1.8 %) and lower pH (4.6 to 5.6 versus 6.7 410
to 8.5) of these soils. These findings indicate that the variable retention time of SMX in the soils 411
is essentially a function of soil pH and OC content. 412
At pH > 5.7 the SMX is dominantly negatively charged. SMX contains complexing amine 413
groups, which suggests the preferred formation of inner-sphere surface complexes over weaker 414
charge exchange related sorption processes (e.g. anion exchange). A specific process concerns 415
ion bridging, i.e. the complexation of SMX by positively charged trace metals sorbed on solid 416
surfaces. This was observed with Cu(II) by Morel et al. (2014), who found that the sorption of 417
SMX in soil increases strongly in the presence of copper, supporting the assumed formation of 418
ternary SMX–Cu–soil complexes. All strongly sorbing and poorly soluble bivalent/trivalent 419
surface cations (Fe(III), Al(III), Zn(II), Ni(II), Cd(II)…) may be involved in SMX ternary sur-420
face complexation formation, but the complexation constants of copper for organics are known 421
to be particularly high. Therefore, the formation of Cu bridging complexes could be specifically 422
developed in soil 4, which presents the highest content of Cu, originating from wastewater ef-423
fluents, or for soil 2, which has a high content of geogenic Cu. At pH < 5.7, i.e. in soils 1 to 4, 424
the sorption of SMX is relatively strong. Accordingly, SMX sorption is found in the literature 425
to increase at decreasing soil pH (Boxall et al., 2002; Thiele-Bruhn and Aust, 2004). This is an 426
expected behaviour for negatively charged ligands, such as the negatively charged SMX species 427
whatever the binding mode – surface complexation or anion exchange (Stumm, 1992). But in 428
this pH range neutral aqueous SMX-H species dominate the deprotonated ones. This could lead 429
to specific hydrophobic interactions with soil organic carbon, meaning an even higher sorption 430
22 at low pH. Dissolved organic carbon (DOC) could potentially increase ligand mobility as sug-431
gested for Naproxen (Chefetz et al., 2008). We did not measure DOC but expect its concentra-432
tion to be too low to become significant in this respect. 433
Altogether, these results are in accordance with Srinivasan and Sarmah (2014b) and Kurwadkar 434
et al. (2011), who found that SMX sorption is greatly enhanced in soils with low pH and high 435
CEC, OC and clay contents. Overall, pH and OC contents are the parameters that better ex-436
plained the observed SMX retardation factors in all soils (R²=0.83 for both). 437
Concerning the other fitted parameters, marked differences were also noted between soils 1–4 438
and soil 5–10. In soils 1 to 4, F, the fraction of adsorption sites available for instantaneous 439
sorption, varied between 4.6 10-4 and 5.9 10-1 and were highly variable between duplicate col-440
umns for soils 2 and 3, showing the complexity of building real duplicates of repacked soil 441
columns. These values varied in the same range as in Wehrhan et al. (2007) studying sulfadia-442
zine transport in Eutric Cambisol. For soils 5 to 10, F was equal to 0, meaning that instantaneous 443
SMX sorption was negligible. The irreversible sorption rate factor,
β
3, varied from 4.4 10-3 to 4448.9 10-3 min-1 for soils 1 to 4, and from 1 10-6 to 4 10-3 min-1 for soils 5 to 10, and was negatively 445
correlated with the EM fraction (R2=0.74).
β
3 was higher than µ by a factor of 102 to 104, 446demonstrating that irreversible SMX sorption (
β
3) was the main process explaining the EM 447fractions lower than 100%, and that biodegradation was negligible during the time of the ex-448
periment. However, if we consider experimental and analytical uncertainty, the EM of soils 5 449
to 8 can be potentially equated to 100%. 450
451
3.5. SMX mobility at the watershed scale. 452
The variable pedology in the studied watershed is reflected in a variable mobility of SMX. In 453
the soils above El Alto city (soils 1, 2 and 3) SMX showed low mobility (i.e. high retardation 454
factors ̴ 7 to ̴ 8), suggesting low vulnerability of groundwater to SMX contamination. According 455
23 to the observed EM fractions, 40 to 66% of SMX are irreversibly retained in the surface soil 456
horizon. Nevertheless, infiltration to lower horizons and to the aquifers remains possible, espe-457
cially in relation with the sandy and gravel texture of the deeper layers (see SI.III Soil profiles 458
properties), although deep SMX transport will be mostly controlled by its persistence in soil 459
profile. This is especially critical for the recharge zone of the El Alto Aquifer (soils 1, 2 and 3). 460
In soils near the WWTP (soils 4 and 5), SMX showed relatively low mobility (retardation fac-461
tors of ̴ 2 to ̴ 7). Here, SMX mobile fractions ( ̴ 35 and ̴ 80% in soils 4 and 5, respectively) are 462
likely to be transported below the soil surface layer in the dry season and at the beginning of 463
the wet season. In this season, cracks are indeed often formed in soils down to lower horizons 464
due to their high contents of smectite clay, which induce soil shrinking phenomena and the 465
establishment of preferential flows, which are known to favour pollutant transport (Keesstra et 466
al., 2012; Martins et al., 2013). 467
In soils 6, 7, and 8 (Figure 1), SMX is expected to be highly mobile (mean retardation factor 468
of 1.3 and mean SMX mobile fraction: 92.2%). However, the higher clay content in lower ho-469
rizons (see SI.III Soil profiles properties) suggests that in wet season, SMX leaching towards 470
the groundwater could be slowed down but could speed up when cracks form in clayey lower 471
horizons, as similar to soils 4 and 5. 472
SMX also present high mobility in soils located on the shore of Lake Titicaca (soils 9 and 10) 473
(mean retardation factor of 1.38 and mean SMX mobile fraction: 89.9%). In this zone, the vul-474
nerability of groundwater to SMX pollution is clearly very high because of the shallow ground-475
water levels in relation with to the lake’s level fluctuation. 476
477
4. Conclusions 478
The transport of SMX in a variety of high altitude soils from the Bolivian Altiplano was inves-479
tigated using dynamic displacement experiments in repacked laboratory soil columns. 480
24 SMX eluted mass fractions were lower than 100% for all the studied soils, suggesting the ex-481
istence of irreversible sorption and/or degradation processes during the antibiotic transport in 482
soil. This was supported by HYDRUS modelling, as the best data fits were always obtained 483
when considering irreversible sorption for all studied soils in the modelling. In addition to irre-484
versible sorption, considering rate-limited sorption with two sorption sites of variable affinity 485
for SMX was required to properly describe SMX transport These results indicate that the 486
transport of SMX involves different chemical non-equilibrium and time-dependent sorption 487
processes, which are related to soil properties and SMX pH-dependent speciation. 488
At the watershed scale, in soils located upstream (Regosols) SMX presented low mobility as 489
the consequence of its higher retention, enhanced by higher soil OC contents and acidic pH. 490
Nevertheless, an important SMX fraction can potentially migrate to deep layers due to the pres-491
ence of coarse material in the lower horizons and to the high smectite content, know to favour 492
cracks formation in dry season and preferential water flow paths. In soils located downstream 493
(Cambisols) SMX showed high mobility in relation with a low retention capacity of these soils 494
due to both their texture and OC content. In these soils, the presence of clayey layers subject 495
the formation of cracks in dry season, as well as the shallow groundwater levels enhance the 496
risks of groundwater contamination by SMX. Our results also suggest that SMX complexation 497
with metal ions (such as Cu+) also plays an important role in SMX retention in soil and conse-498
quently on its mobility. 499
Altogether, these results suggest that SMX can be classified as a moderately to highly mobile 500
compound in the Bolivian Altiplano context, in agreement with its behaviour in other regions 501
of the world. In the case of Altiplano, this important SMX mobility potential is clearly under 502
the control of soil’s texture, clay type and content, pH and OC content. Nevertheless, hydrolog-503
ical modelling at the watershed scale is required to properly estimate the pollution risk of sur-504
face waters and groundwater. The important role of all these factors in SMX reactive transport 505
25 makes its prediction quite complex although the modelling work conducted in the present study 506
gave good results. 507
508
Acknowledgements
509
This work was supported by the French national program EC2CO "Ecosphère Continentale et 510
Côtière", the LABEX OSUG@2020, ANR grant # ANR-10-LABX-56" (financed on the Future 511
Investments program launched by the French government and implemented by the ANR) and 512
the National Council for Science and Technology (CONACYT, Mexico). We also thank IBTEN 513
(Instituto Boliviano de Tecnologia Nuclear, Bolivia) for soil analysis. 514
515
References
516
Archundia, D., 2016. Etude du devenir et de l’impact des antibiotiques à l’échelle d’un bassin versant : 517
application au bassin versant du Katari (Bolivie) (Thèse de doctorat en Sciences de la terre et 518
de l’univers, et de l’environnement). Université Grenoble Alpes, Grenoble, France. 519
Archundia, D., Duwig, C., Lehembre, F., Chiron, S., Morel, M.-C., Prado, B., Bourdat-Deschamps, M., 520
Vince, E., Aviles, G.F., Martins, J.M.F., 2017a. Antibiotic pollution in the Katari subcatchment 521
of the Titicaca Lake: Major transformation products and occurrence of resistance genes. Sci. 522
Total Environ. 576, 671–682. https://doi.org/10.1016/j.scitotenv.2016.10.129 523
Archundia, D., Duwig, C., Spadini, L., Uzu, G., Guédron, S., Morel, M.C., Cortez, R., Ramos Ramos, O., 524
Chincheros, J., Martins, J.M.F., 2017b. How Uncontrolled Urban Expansion Increases the 525
Contamination of the Titicaca Lake Basin (El Alto, La Paz, Bolivia). Water. Air. Soil Pollut. 228. 526
https://doi.org/10.1007/s11270-016-3217-0 527
Boreen, A.L., Arnold, W.A., McNeill, K., 2004. Photochemical Fate of Sulfa Drugs in the Aquatic 528
Environment: Sulfa Drugs Containing Five-Membered Heterocyclic Groups. Environ. Sci. 529
Technol. 38, 3933–3940. https://doi.org/10.1021/es0353053 530
Boxall, A., Blackwell, P., Cavallo, R., Kay, P., Tolls, J., 2002. The sorption and transport of a 531
sulphonamide antibiotic in soil systems. Toxicol. Lett. 131, 19–28. 532
Calvet, R., 1989. Adsorption of Organic Chemicals in Soils. Environ. Health Perspect. 83, 145–177. 533
Carrillo, M., Braun, G.C., Siebe, C., Amelung, W., Siemens, J., 2016. Desorption of sulfamethoxazole 534
and ciprofloxacin from long-term wastewater-irrigated soils of the Mezquital Valley as 535
affected by water quality. J. Soils Sediments 16, 966–975. https://doi.org/10.1007/s11368-536
015-1292-2 537
Chefetz, B., Mualem, T., Ben-Ari, J., 2008. Sorption and mobility of pharmaceutical compounds in soil 538
irrigated with reclaimed wastewater. Chemosphere 73, 1335–1343. 539
https://doi.org/10.1016/j.chemosphere.2008.06.070 540
Dı ́az-Cruz, M.S., López de Alda, M.J., Barceló, D., 2003. Environmental behavior and analysis of 541
veterinary and human drugs in soils, sediments and sludge. TrAC Trends Anal. Chem. 22, 340– 542
351. 543
Drillia, P., Stamatelatou, K., Lyberatos, G., 2005. Fate and mobility of pharmaceuticals in solid 544
matrices. Chemosphere 60, 1034–1044. https://doi.org/10.1016/j.chemosphere.2005.01.032 545
26 Durán–Álvarez, J.C., Prado, B., Ferroud, A., Juayerk, N., Jiménez-Cisneros, B., 2014. Sorption,
546
desorption and displacement of ibuprofen, estrone, and 17β estradiol in wastewater irrigated 547
and rainfed agricultural soils. Sci. Total Environ. 473–474, 189–198. 548
https://doi.org/10.1016/j.scitotenv.2013.12.018 549
Engelhardt, I., Sittig, S., Šimůnek, J., Groeneweg, J., Pütz, T., Vereecken, H., 2015. Fate of the antibiotic 550
sulfadiazine in natural soils: Experimental and numerical investigations. J. Contam. Hydrol. 551
177–178, 30–42. https://doi.org/10.1016/j.jconhyd.2015.02.006 552
FAO, 2006. Guidelines for soil description, 4th ed. ed. Food and Agriculture Organization of the United 553
Nations, Rome. 554
FAO, 1998. Land and Water Digital Media Series n5; Soil and Terrain Database for Latin America and 555
the Carribean - 1:5 Million scale (SOTERLAC). Food and Agriculture Organization of the United 556
Nations, Rome, Italy. 557
Feinberg, M., Laurentie, M., 2010. Le cahier des techniques de l’Inra. Validation des méthodes 558
d’analyse quantitative par le profil d’exactitude. 559
Fortin, J., Flury, M., Jury, W.A., Streck, T., 1997. Rate-limited sorption of simazine in saturated soil 560
columns. J. Contam. Hydrol. 25, 219–234. 561
García-Galán, M.J., Garrido, T., Fraile, J., Ginebreda, A., Díaz-Cruz, M.S., Barceló, D., 2010. 562
Simultaneous occurrence of nitrates and sulfonamide antibiotics in two ground water bodies 563
of Catalonia (Spain). J. Hydrol. 383, 93–101. https://doi.org/10.1016/j.jhydrol.2009.06.042 564
García-Galán, M.J., Silvia Díaz-Cruz, M., Barceló, D., 2008. Identification and determination of 565
metabolites and degradation products of sulfonamide antibiotics. TrAC Trends Anal. Chem. 566
27, 1008–1022. 567
García-Santiago, X., Garrido, J.M., Lema, J.M., Franco-Uría, A., 2017. Fate of pharmaceuticals in soil 568
after application of STPs products: Influence of physicochemical properties and modelling 569
approach. Chemosphere 182, 406–415. https://doi.org/10.1016/j.chemosphere.2017.05.049 570
Gardner, W.R., 1958. Some steady-state solutions of unsaturated moisture flow equations with 571
application to evaporation from a water table. Soil Sci 85, 228–232. 572
Hoa, P.T.P., Managaki, S., Nakada, N., Takada, H., Shimizu, A., Anh, D.H., Viet, P.H., Suzuki, S., 2011. 573
Antibiotic contamination and occurrence of antibiotic-resistant bacteria in aquatic 574
environments of northern Vietnam. Sci. Total Environ. 409, 2894–2901. 575
https://doi.org/10.1016/j.scitotenv.2011.04.030 576
Hu, X., Zhou, Q., Luo, Y., 2010. Occurrence and source analysis of typical veterinary antibiotics in 577
manure, soil, vegetables and groundwater from organic vegetable bases, northern China. 578
Environ. Pollut. 158, 2992–2998. 579
Johnston, P.B., Atkinson, T.C., Odling, N.E., Barker, J.A., 2005. Models of tracer breakthrough and 580
permeability in simple fractured porous media. Geol. Soc. Lond. Spec. Publ. 249, 91–102. 581
Kan, A.T., Chen, W., Tomson, M.B., 2000. Desorption kinetics of neutral hydrophobic organic 582
compounds from field-contaminated sediment. Environ. Pollut. 108, 81–89. 583
Keesstra, S., Geissen, V., Mosse, K., Piiranen, S., Scudiero, E., Leistra, M., van Schaik, L., 2012. Soil as a 584
filter for groundwater quality. Curr. Opin. Environ. Sustain. 4, 507–516. 585
https://doi.org/10.1016/j.cosust.2012.10.007 586
Kim, K.R., Owens, G., Kwon, S.I., So, K.H., Lee, D.B., Ok, Y.S., 2011. Occurrence and environmental fate 587
of veterinary antibiotics in the terrestrial environment. Water. Air. Soil Pollut. 214, 163–174. 588
Kümmerer, K., 2009. Antibiotics in the aquatic environment – A review – Part I. Chemosphere 75, 589
417–434. https://doi.org/10.1016/j.chemosphere.2008.11.086 590
Kurwadkar, S.T., Adams, C.D., Meyer, M.T., Kolpin, D.W., 2011. Comparative mobility of sulfonamides 591
and bromide tracer in three soils. J. Environ. Manage. 92, 1874–1881. 592
https://doi.org/10.1016/j.jenvman.2011.03.018 593
Kutilek M, Nielsen, D.R., 1994. Soil Hydrology. Geoscience Publisher, Catena Verlag, Cremlingen. 594
Leenheer, J.A., Ahlrichs, J.L., 1971. A kinetic and equilibrium study of the adsorption of carbaryl and 595
parathion upon soil organic matter surfaces. Soil Sci Soc Am Proc 35, 700–705. 596
Leung, H.W., Minh, T.B., Murphy, M.B., Lam, J.C.W., So, M.K., Martin, M., Lam, P.K.S., Richardson, B.J., 597
27 2012. Distribution, fate and risk assessment of antibiotics in sewage treatment plants in Hong 598
Kong, South China. Environ. Int. 42, 1–9. https://doi.org/10.1016/j.envint.2011.03.004 599
Loague, K., Green, R.E., 1991. Statistical and graphical methods for evaluating solute transport 600
models: Overview and application. J. Contam. Hydrol. 7, 51–73. 601
Martínez-Hernández, V., Meffe, R., Kohfahl, C., de Bustamante, I., 2017. Investigating natural 602
attenuation of pharmaceuticals through unsaturated column tests. Chemosphere 177, 292– 603
302. https://doi.org/10.1016/j.chemosphere.2017.03.021 604
Martins, J.M., Mermoud, A., 1998. Sorption and degradation of four nitroaromatic herbicides in 605
mono and multi-solute saturated/unsaturated soil batch systems. J. Contam. Hydrol. 33, 187– 606
210. 607
Martins, J.M.F., Majdalani, S., Vitorge, E., Desaunay, A., Navel, A., Guiné, V., Daïan, J.F., Vince, E., 608
Denis, H., Gaudet, J.P., 2013. Role of macropore flow in the transport of Escherichia coli cells 609
in undisturbed cores of a brown leached soil. Env. Sci Process. Impacts 15, 347–356. 610
https://doi.org/10.1039/C2EM30586K 611
Mehra, O.P., Jackson, M.L., 1960. Iron oxide removal from soils and clays by a dithionite-citrate 612
system buffered with sodium bicarbonate. 613
Michael, I., Rizzo, L., McArdell, C.S., Manaia, C.M., Merlin, C., Schwartz, T., Dagot, C., Fatta-Kassinos, 614
D., 2013. Urban wastewater treatment plants as hotspots for the release of antibiotics in the 615
environment: A review. Water Res. 47, 957–995. 616
https://doi.org/10.1016/j.watres.2012.11.027 617
Mojica, E.-R., Aga, D., 2011. Antibiotics Pollution in Soil and Water: Potential Ecological and Human 618
Health Issues. Elsevier. 619
Morel, M.-C., Spadini, L., Brimo, K., Martins, J.M.F., 2014. Speciation study in the sulfamethoxazole– 620
copper–pH–soil system: Implications for retention prediction. Sci. Total Environ. 481, 266– 621
273. https://doi.org/10.1016/j.scitotenv.2014.02.040 622
Müller, K., Duwig, C., Prado, B., Siebe, C., Hidalgo, C., Etchevers, J., 2012. Impact of long-term 623
wastewater irrigation on sorption and transport of atrazine in Mexican agricultural. J. Environ. 624
Sci. Health Part B 47, 30–41. 625
OECD, 2003. OECD Guidelines for the testing of chemicals: Leaching in Soil Columns. 626
Oppel, J., Broll, G., Loffler, D., Meller, M., Rombke, J., Ternes, T., 2004. Leaching behaviour of 627
pharmaceuticals in soil-testing-systems: a part of an environmental risk assessment for 628
groundwater protection. Sci. Total Environ. 328, 265–273. 629
https://doi.org/10.1016/j.scitotenv.2004.02.004 630
Park, J.Y., Huwe, B., 2016. Effect of pH and soil structure on transport of sulfonamide antibiotics in 631
agricultural soils. Environ. Pollut. 213, 561–570. 632
https://doi.org/10.1016/j.envpol.2016.01.089 633
Perfect, Sukop M.C, Haszler G.R, 2002. Prediction of Dispersivity for Undisturbed Soil Columns from 634
Water Retention Parameters. Environ. Pollut. 213, 561–570. 635
Pignatello, J.J., 2000. The measurement and interpretation of sorption and desorption rates for 636
organic compounds in soil media. Advances in Agronomy. 637
Pignatello, J.J., 1989. Sorption Dynamics of Organic Compounds in Soils and Sediments. Soil Sci. Soc. 638
Am. Inc Madison WI, SSSA Special Publication No. 22. 45–80. 639
Rühlmann, J., Körschens, M., Graefe, J., 2006. A new approach to calculate the particle density of soils 640
considering properties of the soil organic matter and the mineral matrix. Geoderma 130, 641
272–283. https://doi.org/10.1016/j.geoderma.2005.01.024 642
Simunek, J., Jacques, D., Langergraber, G., Bradford, S.A., Šejna, M., van Genuchten, M.T., 2013. 643
Numerical modeling of contaminant transport using HYDRUS and its specialized modules. J. 644
Indian Inst. Sci. 93, 265–284. 645
Simunek, J., Sejna, M., Saito, H., Genuchten, M.Th.V., 2008. The HYDRUS-1D Software Package for 646
Simulating the One-Dimensional Movement of Water, Heat, and Multiple Solutes in Variably-647
Saturated Media. Dep. Environ. Sci. Univ. Calif. RIVERSIDE RIVERSIDE Calif. 648
Srinivasan, P., Sarmah, A.K., 2014a. Dissipation of sulfamethoxazole in pasture soils as affected by soil 649
28 and environmental factors. Sci. Total Environ. 479–480, 284–291.
650
https://doi.org/10.1016/j.scitotenv.2014.02.014 651
Srinivasan, P., Sarmah, A.K., 2014b. Assessing the sorption and leaching behaviour of three 652
sulfonamides in pasture soils through batch and column studies. Sci. Total Environ. 493, 535– 653
543. https://doi.org/10.1016/j.scitotenv.2014.06.034 654
Srinivasan, P., Sarmah, A.K., Manley-Harris, M., 2014. Sorption of selected veterinary antibiotics onto 655
dairy farming soils of contrasting nature. Sci. Total Environ. 472, 695–703. 656
https://doi.org/10.1016/j.scitotenv.2013.11.104 657
Srinivasan, P., Sarmah, A.K., Manley-Harris, M., 2013. Co-contaminants and factors affecting the 658
sorption behaviour of two sulfonamides in pasture soils. Environ. Pollut. 180, 165–172. 659
https://doi.org/10.1016/j.envpol.2013.05.022 660
Stumm W, 1992. Chemistry of the Solid-Water Interface: Processes at the Mineral-Water and Particle-661
Water Interface in Natural Systems. Wiley. 662
Tamtam, F., Mercier, F., Le Bot, B., Eurin, J., Tuc Dinh, Q., Clément, M., Chevreuil, M., 2008. 663
Occurrence and fate of antibiotics in the Seine River in various hydrological conditions. Sci. 664
Total Environ. 393, 84–95. https://doi.org/10.1016/j.scitotenv.2007.12.009 665
Tamtam, F., van Oort, F., Le Bot, B., Dinh, T., Mompelat, S., Chevreuil, M., Lamy, I., Thiry, M., 2011. 666
Assessing the fate of antibiotic contaminants in metal contaminated soils four years after 667
cessation of long-term waste water irrigation. Sci. Total Environ. 409, 540–547. 668
https://doi.org/10.1016/j.scitotenv.2010.10.033 669
Thiele-Bruhn S, Aust MO, 2004. Effects of pig slurry on the sorption of sulfonamide antibiotics in soil. 670
Env. Contam Toxicol 47. 671
Wehrhan, A., Kasteel, R., Simunek, J., Groeneweg, J., Vereecken, H., 2007. Transport of sulfadiazine in 672
soil columns — Experiments and modelling approaches. J. Contam. Hydrol. 89, 107–135. 673
https://doi.org/10.1016/j.jconhyd.2006.08.002 674
Wooding, R., 1968. Steady infiltration from a shallow circular pond. Wat Resourc Res 4, 1259–1273. 675
Zhang, H., Zhou, Y., Huang, Y., Wu, L., Liu, X., Luo, Y., 2016. Residues and risks of veterinary antibiotics 676
in protected vegetable soils following application of different manures. Chemosphere 152, 677
229–237. https://doi.org/10.1016/j.chemosphere.2016.02.111 678
Zuccato, E., Castiglioni, S., Bagnati, R., Melis, M., Fanelli, R., 2010. Source, occurrence and fate of 679
antibiotics in the Italian aquatic environment. J. Hazard. Mater. 179, 1042–1048. 680
https://doi.org/10.1016/j.jhazmat.2010.03.110 681
682 683