HAL Id: tel-01494749
https://pastel.archives-ouvertes.fr/tel-01494749
Submitted on 23 Mar 2017
HAL is a multi-disciplinary open access
archive for the deposit and dissemination of
sci-entific research documents, whether they are
pub-lished or not. The documents may come from
teaching and research institutions in France or
L’archive ouverte pluridisciplinaire HAL, est
destinée au dépôt et à la diffusion de documents
scientifiques de niveau recherche, publiés ou non,
émanant des établissements d’enseignement et de
recherche français ou étrangers, des laboratoires
trade
Esther Delbourg
To cite this version:
Esther Delbourg. Achieving water security through cooperation and food trade. Economics and
Finance. Université Paris-Saclay, 2016. English. �NNT : 2016SACLX077�. �tel-01494749�
THÈSE
pour l’obtention du grade de
DOCTEUR DE L’UNIVERSITÉ PARIS SACLAY préparée à l’ ÉCOLE POLYTECHNIQUE
École doctorale no578 (Sciences de l’Homme et de la Société) Spécialité: Sciences Économiques
Par
ESTHER DELBOURG
ACHIEVING WATER SECURITY THROUGH COOPERATION AND FOOD TRADE
ASSURER L’AVENIR DE NOS RÉSERVES EN EAU À TRAVERS LA COOPÉRATION ET LE COMMERCE INTERNATIONAL
December 7th, 2016 AX, Paris
Thèse rédigée en Anglais
Thesis Advisor
DR. ERIC STROBL
Jury
Robert Elliott Professor Reviewer
University of Birmingham
Holger Görg Professor Reviewer
Kiel Institute for the World Economy
Augustin Perez-Barahona Professor President of the Jury INRA, Ecole Polytechnique
I would like to express my sincere gratitude to my advisor Eric Strobl, Professor at the Ecole Polytechnique and at the Aix-Marseille School of Economics, for his precious guidance, patience and immense knowledge. Eric always left me free to explore the literature and the topics that I was passionate about, all the while keeping me on a straight path and providing essential advice on rigorous econometrics, analysis and writing. He guided me both through my masters’ thesis and my Ph.D. and I am incredibly grateful to him.
Along with my advisor, I would like to thank my thesis committee: Professor Robert Elliott, Professor Görg and Professor Perez-Barahona. Their time and contributions have been invalu-able for my thesis. They gave insightful comments, offered encouraging suggestions and also posed the hard questions which drove me to widen my research from various perspectives.
I wish to thank the Axa Research Fund who generously funded my thesis and gave me com-plete freedom to pursue my research and explore its many tempting topics. The ARF is an exceptionally dynamic, fascinating and major actor within the world of research thanks to its wonderful team led (at the time) by Godefroy de Beauvallet with Isabelle Delaporte, Isabelle Jubelin, Raphaëlle Lalo and Isabelle Bergeron.
It was a wonderful experience to co-write my second chapter with Professor Shlomi Dinar, Professor of International Relations at Florida International University. Water management is all about pooling academic disciplines and I was lucky to benefit from his knowledge and experience. Thanks to our passionate discussions and exchanges, we wrote an article which I am very proud of. My most and warm thank you to Professor Ezra Suleiman, a mentor, who gave me the most invaluable academic and career advice.
I am also proud to have written my Ph.D. within the prestigious Ecole Polytechnique and benefited from top researchers and facilities. Particular thanks to Professor Yukio Koriyama, Isabelle Méjean, Raicho Bolijov and Guy Meunier who helped me throughout the thesis, took the time to read my research and provide precious recommendations. My warmest thoughts to the staff at Polytechnique, Lyza Racon, Eliane Nitiga-Madelaine and Chantal Poujouly who always took care of us, Ph.D. students, supported and helped us through all the important steps, even the ones we could not see back at the time.
Those years at Polytechnique would not have been the same without my teammates to discuss research, drink coffee at the Bobar and beers at the Academy de la Bière. I wish them all the best for their academic career: Dr. Robert Somogyi, Dr. Raphaël Treibich, Dr. Antonin Macé, Dr. Gwenaël Roudaut, Dr. Mathias André, Dr. Alena Kotelnikova and Dr. Guilhem Lecouteux
and soon to be Doctors Jeanne Commault, Sebastian Franco, Alexis Louaas, Reda Aboutajdine, Margot Hovsepian, Anaïs Goburdhun, Anasuya Raj, Aymeric Guidoux and Christine Lavaur. Very special thanks to Dr. Arnaud Goussebaïle, an amazing researcher and friend as he helped me get through the thesis since the beginning and who I cannot thank enough.
I also owe a great deal to the researchers at the School of International and Public Affairs and the Earth Institute at Columbia University. In particular, I wish to thank Professors John Mutter and Scott Barrett who invited me to visit Columbia University. This exchange would not have been the same without my frequent discussions with Professor Upmanu Lall, Director of the Water Centre. My stay in New York was a perfect stay thanks to many hours spent at Butler and the Avery libraries with Dr. Anna Ray and Dr. Clément Feger.
My thesis has also been influenced by influential researchers I met throughout the years: Professor Tony Allan from King’s College who introduced me to the main topic of virtual water. Professor Ariel Dinar, who took the time to discuss my research; Kaitlin Cordes from Columbia Law School with whom we discussed the topics of water economic rights vs rights to water and trusted me to teach several times at Columbia.
Last but not the least, and not without great emotion, I would like to thank my wonderful parents, Therese and Denis. They are outstanding people, parents, mentors and (sometimes) friends who have always been supportive of my dreams, from being a violinist and a wine maker to writing a Ph.D. thesis. I owe them all the extraordinary things I’ve experienced up to now and I hope they know how much I love them. They were also brilliant when suggesting I should get advice from other people such as Catherine Fahri, who convinced me that I should do a Ph.D. An incredible thank you to my close friends and family who supported me throughout: Esther and Antoine, Julien, Marie-Anne, Victor, Jean, Timothy, Anne and to those who know what it’s like to write a thesis or support someone who is: Elodie, soon to be Dr. Charles, Dr. Sarah, Dr. Clarisse, William and my aunt Anne-Claude. To my inspirational cousins, both researchers, Dr. Pierre and soon to be Dr. Marianne. And my last thank you goes to Jean-Yves (Faff). He experienced the thesis on a daily basis, discussed the results and kept me going through the end all the while building our future home with his bare hands. I owe him a wonderful and unexpected last year of thesis, and years of more amazing unexpectedness to come.
Introduction 1 1 Water conflicts and cooperation up and down African rivers 13
1.1 Introduction . . . 1
1.2 Data and Summary Statistics . . . 4
1.2.1 Region and Unit of Analysis . . . 4
1.2.2 The Basins At Risk scale . . . 4
1.2.3 Upstream vs downstream relationships . . . 5
1.2.4 Streamflow/Runoff . . . 7
1.2.5 Evapotranspiration . . . 8
1.2.6 Population, GDP, Dams, Bilateral Trade and Lagged Values . . . 8
1.2.7 Summary Statistics . . . 9
1.3 Methodology . . . 14
1.3.1 Modeling interaction . . . 14
1.3.2 Modeling the outcome of interaction: cooperation or conflict . . . 15
1.3.3 Extension to the baseline setting . . . 16
1.4 Regression results . . . 17
1.4.1 Results for interaction . . . 17
1.4.2 Results for the outcome of interaction: conflict or cooperation . . . 18
1.5 Conclusion . . . 21
1.6 Appendix . . . 23
1.6.1 BARscale as described in Wolf’s database . . . 23
1.6.2 Description of the African basins studied in this paper . . . 25
1.6.3 Extract from a query for the Nile basin in the Barscale database . . . 26
1.6.4 The Pfafstetter numbering system . . . 26
2 The Globalization of Virtual Water Flows: Explaining Trade Patterns of a Scarce Resource 27 2.1 Introduction . . . 28
2.2 Explaining Virtual Water Flows: Water Endowments versus Water Productivity 29 2.3 Data . . . 31
2.3.1 Bilateral trade flows . . . 31
2.3.2 Relative water endowments and footprints . . . 32
2.3.3 Gravity and control data . . . 33
2.3.4 Summary Statistics . . . 34
2.4 Econometric Methodology . . . 37
2.6 Sectoral Analysis . . . 48
2.7 Conclusion . . . 53
2.8 Appendices . . . 55
2.8.1
World Customs Organization - HS Nomenclature 2012
. . . 553 Food production and cursed water resources: challenging trade diversification mechanisms 57 3.1 Introduction . . . 58
3.2 Virtual Water flows and concentrated exports . . . 60
3.3 Export concentration, agricultural dependence and water resources . . . 62
3.3.1 Data . . . 62
3.3.2 The Theil and Water Theil index . . . 63
3.3.3 Descriptive statistics . . . 64
3.4 Regression results . . . 68
3.4.1 Theil, Water Theil and water-dependence . . . 68
3.4.2 Food export diversification and water efficiency . . . 73
3.5 Conclusion . . . 77
3.6 Appendices . . . 79
3.6.1 World Customs Organization - HS Nomenclature 2012 . . . 79
3.6.2 Additional regression results . . . 79
3.6.3 The Oil Seeds and Sugars sector in Ethiopia . . . 80
Conclusion 83 References . . . 85
L’eau pour l’agriculture est un bien économique comme les autres
Il y a deux catégories de ressources en eau: la première désigne l’eau essentielle à la vie et qui répond à nos besoins domestiques (boire, hygiène, cuisine). L’accès à l’eau domestique a été reconnu en 2010 par l’ONU comme un droit fondamental alors que 40% de la population était alors en situation de stress hydrique (World Water Development, Rapport 4, 2012). Ce chiffre n’a pas baissé aujourd’hui car cette situation de grande précarité n’est pas le résultat d’une rareté des ressources mais d’une mauvaise allocation des investissements. En effet, l’eau domes-tique ne représente que 10% de nos prélèvements en eau et c’est donc l’absence d’infrastructures d’assainissements, d’acheminement et de services en eau qui pénalise les populations les plus pauvres.
La deuxième catégorie des ressources en eau est aujourd’hui la plus menacée et désigne l’eau que nous utilisons pour l’agriculture. A l’échelle de la planète, 80% de l’eau que nous prélevons sert à produire des biens alimentaires et la disponibilité de cette eau est menacée par le change-ment climatique, l’accroissechange-ment de la population et une demande toujours plus forte pour des biens diversifiés et peu chers. Les pays moins riches en eau sont d’autant plus vulnérables aux variations du climat et des prix du marché car ils n’ont généralement aucune gestion efficace et économe de l’eau pour garantir leur sécurité alimentaire.
Bien que les deux types d’eau aient exactement les mêmes caractéristiques physiques, l’eau pour la production alimentaire ne devrait pas avoir le même statut. Les économistes avancent que c’est précisément ce manque de distinction avec l’eau domestique qui empêche l’eau agricole d’être reconnue comme un bien économique et fait ainsi obstacle à une logique de gestion au coût marginal, au même titre que la main d’œuvre ou le capital. Pourquoi cette distinction est-elle si importante? Tout simplement parce que l’inégalité des ressources en eau n’est jamais reflétée dans le coût de la production ou dans le prix final du bien. L’eau étant considérée comme un droit humain fondamental, nous ne pouvons nous résoudre à y attacher un prix, ainsi nous ne payons que les infrastructures permettant d’y accéder. Cependant le coût d’opportunité d’un litre d’eau dans une région sèche est bien plus élevé que s’il provenait d’une région abondante et c’est pourquoi la gestion de l’eau agricole ne peut reposer sur l’hypothèse d’un bien commun. De fait, les pays et leurs agriculteurs sont inégaux face à la ressource et c’est précisément cette asymétrie qui peut, à terme, être source de tensions.
Comment assurer la sécurité de l’eau pour assurer la sécurité alimentaire?
L’eau est donc un facteur de production, au même titre que la main d’œuvre ou le capital. Il nous est désormais possible de comptabiliser précisément la productivité-eau d’un bien en
mesurant la quantité nécessaire à la production de ce bien: c’est le concept de l’eau virtuelle, ainsi nommé par Tony Allan en 1991. Ce concept permet de mesurer l’empreinte eau de chaque bien, dans chaque pays, en m3/tonne; c’est aussi l’inverse de la productivité de l’eau qui se mesure en tonne produite par m3 d’eau utilisé. Grâce à ces données, nous pouvons envisager deux façons d’assurer notre sécurité en eau.
La première est d’augmenter notre productivité en eau (ou de diminuer notre empreinte). Grâce aux technologies de l’eau, au suivi de consommation (smart-metering) et à des stratégies de production sensibles au sol et au climat, nous pouvons désormais produire les biens les plus adaptés, au bon endroit et au bon moment. Nous avons des moyens toujours plus efficaces pour améliorer notre productivité en eau - et donc d’en utiliser moins pour produire autant, voire plus. Parce que cette productivité dépend de facteurs endogènes (le capital, le savoir-faire, la technologie) mais aussi exogènes (climat, sol, géographie), la productivité de l’eau sera différente entre fermiers, entre régions, entre pays. En France, un kilo de bœuf coûtera, en moyenne, près de 16 000 litres d’eau, soit l’équivalent de 3,5 mois de consommation d’eau en France ou de 2 mois aux Etats-Unis. La sécurité de l’eau pour l’agriculture est donc cruciale pour la sécurité alimen-taire et les pays ayant réussi à améliorer leur productivité-eau ont même une sorte d’avantage comparatif dans la ressource.
C’est ainsi que la discipline économique a progressivement formulé l’argument selon lequel le commerce international alimentaire peut, à terme, permettre aux pays pauvres en eau d’économiser leurs ressources en important des biens plutôt qu’en les produisant localement (Allan, 1993). Le commerce international est donc la deuxième option, complémentaire, pour assurer notre sécurité en eau.
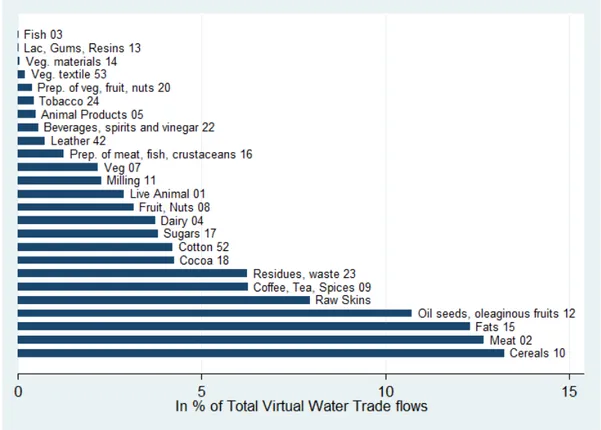
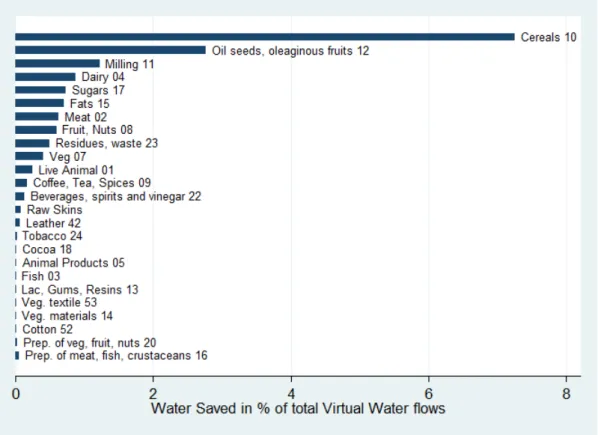
Le graphe en Figure 1 présente la quantité d’eau que nous aurions pu épargner en 2007, à l’échelle du monde, si l’ensemble des pays avaient produit exactement la même quantité de biens agricoles avec la meilleure productivité-eau existante. Nous utilisons les données Comtrade de l’ONU sur les biens alimentaires entre 1994 et 2007 ainsi que les données sur l’empreinte eau issues du Water Footprint Network (Hœkstra et Hung, 2002 et Chapagain et Hœkstra en 2004) et trouvons que 37 à 40% de l’eau aurait pu être économisée. Le deuxième graphe détaille ces économies d’eau par secteurs: plus de 60% de toute l’eau utilisée pour l’industrie animale aurait pu être économisée à travers une meilleure gestion de la ressource. Plus de 40% aurait pu être épargnée dans l’industrie laitière, le café, le thé et les épices.
Il se trouve que la plupart de ces produits proviennent de pays en voie de développement, certains riches en eau (Brésil, Chine, Inde) et d’autres en situation de stress hydrique (Pérou, Chili, Mexique et Kenya). Mais ils ont tous en commun une gestion encore sous-optimale de l’eau, voire une gestion qui menace l’accès à l’eau potable dans un futur proche. Qui plus est, le monde produit plus de nourriture que nécessaire aujourd’hui, seulement la distribution des produits est inefficace et les déficiences du marché et le commerce internationale dirigent les flux alimentaires dans le "mauvais sens". Les pays riches en eau reçoivent bien plus de nourriture alors que les pays pauvres en eau ont parfois du mal à accéder aux marchés internationaux. Il semblerait donc souhaitable de repenser notre stratégies de production et d’import-export en fonction de nos disponibilités en eau.
Malheureusement, l’eau n’est pas encore un critère de décision stratégique (Wichelns, 2010). La production et l’échange de bien alimentaires sont le fruits de bien d’autres facteurs économiques, tels le capital, la disponibilité de la main d’œuvre et les opportunités commerciales. Ces facteurs appartiennent à des marchés qui sont eux-mêmes régulés, ce qui n’est pas le cas de l’eau. En
Figure 1: Potentiel d’économie de l’eau dans la production alimentaire mondiale en 2007
effet, pour l’instant il n’y a pas de consensus général sur la régulation des ressources ou sur l’accès à l’eau. Dans la plupart des pays, le fermier est propriétaire des ressources qui coulent le long ou sous ses terres: la propriété de la terre implique donc la propriété de l’eau. Il existe des exceptions notables en Afrique du Sud, en Californie et en Australie notamment. L’eau y a été dissociée de la terre et peut ainsi être vendue à différents agents, même à des kilomètres de là. Ces "marchés de l’eau" sont déjà de véritables laboratoires pour une solution plus globale mais ils peuvent avoir leur défauts, comme lorsqu’ils incitent les fermiers à utiliser le maximum de leurs quotas, faute de quoi ils en auront moins l’année suivante. Les systèmes de marchés de l’eau ne sont encore que peu adaptés aux aléas climatiques, de plus en plus fréquents. Beaucoup de temps et d’eau ont été perdus lors des récentes sécheresses en Californie notamment à cause des négociations sur les règles d’allocation pour hiérarchiser et équilibrer l’approvisionnement en eau. Les pertes sont donc largement dues à une absence de règles et de droits sur l’accès et l’utilisation des ressources en eau.
Malgré cette absence de règles, les débats sur l’utilisation des biens communs ne sont pas récents, comme le montre la Tragédie des biens communs d’Hardin en 1969. Les mécanismes institutionnels font également l’objet de grandes études et la première femme à recevoir le prix Nobel d’économie en 2006, Elinor Ostrom, a même défini une nouvelle approche de la gestion des ressources. Elle propose une alternative entre la privatisation des ressources - considérée par l’économie comme le meilleur moyen d’assurer une gestion optimale sans free-riding - et une gestion par l’Etat, parfois perçu comme seul garant d’une ressource aussi fondamentale que l’eau. Ostrom propose une gestion locale des ressources, où les parties prenantes ainsi que leur pouvoir seraient déterminés par le contexte géographique, économique et social. Comme évoqué précédemment, la rareté de l’eau est une notion relative. Les meilleurs méthodes de gestion seront celles qui s’adaptent au contexte, et non celles qui cherchent à s’appliquer de force. Os-trom a légitimé cette approche et ainsi ouvert une voie peut-être plus durable pour la gestion des ressources en eau. Alors que la discipline économique joue un rôle dans notre compréhension des mécanismes d’allocation et de gestion grâce aux méthodes quantitatives, elle doit également prendre en compte le contexte local.
Cette thèse de doctorat en économie s’inscrit dans le grand débat sur la rareté des ressources en eau et des impacts potentiels sur nos économies et notre sécurité alimentaire. Avec l’usage d’outils quantitatifs et économétriques, elle étudie les mécanismes de répartition de l’eau d’abord lorsqu’elle doit être partagée par plusieurs pays et ensuite lorsqu’elle est utilisée par l’agriculture et expédiée à travers les aliments sous forme virtuelle par le commerce international alimentaire. Les chapitres sont présentés dans l’ordre chronologique de leur écriture.
Chapitre I
Le premier chapitre, co-écrit avec Prof. Eric Strobl, s’intitule "Coopérations et Conflits le long des basins Africains". Il étudie les conflits de l’eau entre pays Africains situés en amont-aval d’un fleuve et contraints de partager la ressource entre 1949 et 2007. Cet article contribue de deux façons à la littérature existante: d’abord par l’étude d’une variable jusqu’ici inutilisée, à savoir le flux annuel d’eau traversant les pays et mesuré en m3/seconde. Ensuite, par le calcul des positions amont-aval entre pays grâce à l’utilisation des bases de données Hydro1K (USGS) et du système de chiffrage Pfaffstetter (1989).
Notre premier modèle de regression s’intéresse à l’existence ou l’absence d’interaction entre deux pays sur des sujets liés à l’eau. Le deuxième modèle regarde ensuite l’intensité de cette
interaction selon une variable dépendante ordonnée allant de -6 (conflit) à +6 (coopération). Entre 1949 et 2007 nous trouvons peu de traces de conflits, même si la paix est souvent con-tingente à une situation égalitaire en termes d’accès à l’eau. En effet, les pays qui interagissent et coopèrent le plus sont ceux qui connaissent peu d’asymétrie en termes d’accès à l’eau. Le pays en aval, défavorisé par sa position, est clairement à l’origine des interactions, et préfère interagir lorsqu’il est en position de force. S’il est en position de faiblesse, le peu d’interactions sera conflictuel. Le pays en aval arrive souvent à contre-carrer ce désavantage par une pression économique (comme dans le cas de l’Egypte, en aval, face à l’Ethiopie). Nos analyses montrent également que les barrages sont plutôt un facteur de coopération que de conflit, étant donné le grand nombre d’avantages qu’ils apportent dans la maÃőtrise et le stockage des flux amont-aval. Par ailleurs l’absence de coopération ne présage en rien des coopérations futures, un résultat encourageant pour les basins transfrontaliers où l’entente est encore difficile.
Ce premier article a également dévoilé le peu d’interactions des pays sur les problèmes d’accès à l’eau domestique. La plupart des coopérations s’appliquent à la gestion de l’eau pour des com-munautés de fermiers. C’est à la suite de nombreuses conversations avec les Professeurs Tony Allan et Shlomi Dinar que le deuxième article de cette thèse s’est tourné vers la gestion de l’eau pour l’agriculture et les relais du commerce international alimentaire.
Chapitre II
Le deuxième chapitre est co-écrit avec Prof. Shlomi Dinar et s’intitule "La mondialisation des flux d’eau virtuelle". Il s’intéresse à la théorie des avantages comparatifs liés à l’eau dans le com-merce international alimentaire entre 1994 et 2007, à une échelle globale et à travers l’ensemble des secteurs alimentaires. L’analyse porte sur deux types d’avantages entre des pays exporta-teurs et importaexporta-teurs: ceux à la "Hecksher-Ohlin", à savoir la quantité relative des ressources en eau et ceux à la "Ricardo", soit la productivité relative en eau entre deux pays. L’objectif est de comprendre si les pays échangent des biens alimentaires en accord avec leurs deux avantages comparatifs en utilisant les données de BACI (Gaulier et Zignago, 2010).
Les résultats montrent que les pays les plus pauvres en eau sont obligés d’importer les produits qu’ils ne peuvent eux-mêmes produire sur place, faute d’eau. Il y a un bien un avantage com-paratif à la ressource. En revanche, nous montrons qu’en termes de productivité-eau (la quantité produite par litre d’eau utilisé), les pays s’échangent des biens pour lesquels ils n’ont pas néces-sairement d’avantage, voire bien le contraire. L’eau est donc négligée dans l’équation lorsqu’il s’agit des stratégies de production et d’exports. Nous recommandons deux types d’actions: la réallocation des flux commerciaux dans le cas de biens alimentaires produits dans des pays pau-vres en eau uniquement pour des raisons de main d’œuvre; l’augmentation de la productivité eau pour les biens nécessitant un contexte géo-climatique bien particulier dans des pays souvent secs.
Ce deuxième chapitre éclaire donc la position des ressources en eau dans la théorie du com-merce international et des avantages comparatifs. Le troisième chapitre vient compléter cette analyse en s’intéressant aux paniers de biens produits par chaque pays en relation avec leurs avantages en eau.
Chapitre III
en relation aux ressources en eau". Il se penche sur ces pays pauvres en eau et pourtant sou-vent dépendants du secteur agricole. En particulier, il s’inspire des théories qui prédisent que le développement économique va de pair avec la diversification de la production et des exportations. Or un manque d’eau contraint nécessairement les pays dans leur stratégie de diversification. Nous analysons les paniers de biens exportés par les pays à l’échelle du monde entre 1994 et 2007 et utilisons une mesure transformée de l’index Theil qui incorpore les flux d’eau virtuelle contenus dans les aliments exportés.
Contrairement à la littérature qui montre que la diversification des exportations est corrélée au développement, nous trouvons que la concentration dans le secteur agricole a tendance à nourrir la croissance. En effet, les pays les plus riches se sont concentrés sur un petit nombre de produits avant de se diversifier. Ce résultat vient conforter l’hypothèse selon laquelle les avantages comparatifs en eau sont importants pour le développement de l’activité agricole. Nous trouvons également que les produits exigeant le plus d’eau survivent moins longtemps dans les paniers d’exportations des pays les plus pauvres ou les moins productifs en eau. Le manque d’eau semble donc être un obstacle à la diversification et donc, à terme, au développement.
Les pays avec une eau rare et une productivité-eau faible ne peuvent donc se développer par l’agriculture, à moins de se concentrer sur un petit nombre de produits. Investir dans des technologies de l’eau pour un nombre restreint de produits permet d’intensifier la production et d’avoir des externalités positives sur d’autres cultures potentielles. La concentration est donc souhaitable avant la diversification. Une meilleure gestion de l’eau (dans sa quantité et sa pro-ductivité) peut ainsi, à terme, être bénéfique pour le développement économique.
Water resources for agriculture should be treated as an economic good
There are two kinds of water resources: the first one, water for drinking and sanitation, re-sponds to a vital human need. Domestic water has been explicitly recognized by the UN as a human right since 2010 to tackle the challenge of 40% of world population currently undergoing water stress (World Water Development, Report 4, 2012). However, failure to access safe water is rather the result of inefficient or inexistent water infrastructures than that of absolute scarcity. Indeed, domestic water only accounts for 10% of total water withdrawn and we should less be concerned about water availability, as there is plenty, but rather about the lack of equipment to treat, sanitize and carry the resource to people in need.
The second kind, water for food production, is the one facing the most imminent threats. Water for agriculture accounts for over 80% of global consumption and population growth cou-pled with climate change and exploding demand for diversified and cheap food is increasing water scarcity. Water-scarce nations are relatively more vulnerable to variations in climate and in market prices than their water-abundant counterparts and as such, water management will be crucial to achieve food security. Efficient allocation methods, production and water-productivity strategies are key to alleviating the pressure of water scarcity and using water wisely.
Although not physically distinguishable from the first, water for food production is a com-pletely different good. Economists even argue that the lack of distinction with the first kind is precisely what prevents it from being recognized as an economic good, thus hampering all efforts towards efficient allocation and sustainable use. Why is that? To start with, every country needs water to produce food and every nation has water - except that some have more than others. This would not be a problem if the relative scarcity of water resources was reflected in the final price of food products. Yet precisely because water is a human right, there is still no consensus on whether it should be priced. As such, we are only billed for the infrastructures required to access it - but a liter of water will carry the same value in a water-scarce or abundant region, although the opportunity cost of the latter is much lower. Water scarcity thus creates asymme-tries between farmers, consumers and counasymme-tries in their ability to produce, trade and consume food. This is what politicians are implicitly referring to when making statements about "water wars" as tensions over water rarely occur over domestic consumption but often arise in situations with competing uses for food production.
Without a water price, how can we achieve secure supply of water for agriculture?
We have established that water is main factor of production for the food we eat. Through different transformation or consumption processes, water is embedded within our food, hence the term "Virtual Water"coined by Tony Allan (1991) which allows us to keep track of our water footprint (the amount of water consumed in m3). Tracking the amount of water used for food is what enables us to measure their water footprint, measured in m3 per ton produced, which is the inverse of water productivity, measured in ton per m3 of water. It provides us with two interesting solutions to help achieve water security.
The first solution is to improve water productivity. This is done through the use of water-saving technologies, monitoring and wiser crop strategies by planting the right crop at the right time in the right place, taking local climatic and soil conditions into account. Improved water productivity will provide at least as much food all the while saving water. Because it depends both on exogenous (climate, soil) and endogenous (knowledge, capital, technology) factors,
farm-Figure 3: Potential water savings in global food production, 2007
ers, regions and countries will have different water footprints for the same products. In France, a kilo of beef will cost you, on average, about 16 000L of water, that is about 3,5 months’ worth of domestic water (drinking, sanitation, cooking, toilets) or 2 months’ worth in the United States. As such, countries with water-saving technologies have succeeded in increasing their water pro-ductivity even obtaining a sort of comparative advantage in the production of food.
The idea of comparative advantage gradually brought the idea that by importing food, water-scarce countries could be relieved from using the little resource they have (Allan, 1993). As such, international trade is the second, complementary option to save water globally by re-reallocating flows of agricultural goods - and thus flows of virtual water from water abundant to water scarce countries. Figure 1 shows how much water, in percentage, could have been saved globally in 2007 if countries had produced and exported the same amounts of food using the optimum level of water currently achieved through technologies. Using the UN Comtrade data on food trade between 1994 and 2007 and data on water productivity provided by the Water Footprint Network (Hoekstra and Hung, 2002 and further elaborated by Chapagain and Hoekstra, 2004), 37-40% of our water resources could have been saved each year. Figure 2 details all water savings by sector: over 60% of water consumed specifically for animals products can be saved through enhanced water management. Over 40% could have been saved for diary, coffee, tea spices and meat products.
Most of these products are produced in developing nations, a majority of which are either water abundant (Brazil, China, India) or water scarce (Peru, Chile, Mexico, Kenya) but a com-mon feature acom-mong these countries is that water use is largely inefficient and threatening future supplies. What is more, the amount of food being produced globally is largely enough to feed the world, but inefficient allocation of production, market discrepancies and international trade are directing trade flows in the wrong way: too much food goes to wealthy and water-abundant nations while the rest of the world is struggling to access subsistence crops at affordable prices. It would seem natural to rethink our production and export-import mechanisms by taking water availability into account.
Figure 4: Potential water savings per sector, 2007
intuitive, in practice, water scarcity has yet to become a relevant criterion for production and export strategies (Wichelns, 2010). Indeed, food production and trade are determined by many other types of economics factors (capital, labor, trade opportunities). These other factors have the power to affect trade because they are generally regulated. Unfortunately, there is no consen-sus over regulation and rights to water for agriculture. In most countries, farmers own the water beneath the land; in South Africa, California or Australia, water has been de-bundled from land and can be sold separately. These so-called "water markets" are an improvement, although they have their flaws, such as the "use it or lose it" rule, giving farmers incentives to excessively use the water so they do not lose their rights the following year. The system is also not designed to adapt to increasingly frequent climate change events and in the case of droughts, such as California, time and water are lost in the process of deciding on new allocation mechanisms. Inefficient or inexistent allocation rights and rules are thus largely responsible for water depletion around the world.
Despite our lack of immediate solutions, the debate over common pool resources is far from recent, as pointed in the Tragedy of the Common by Hardin in 1969. Institutional mechanisms are still being heavily debated and the first female Nobel laureate in economics in 2006, Elinor Ostrom (Governing the commons, 1990), redefined our approach of resource management, sug-gesting an alternative way between state control and privatization of resources. While liberal economics would advocate that private property is the best incentive to avoid free-riding and degradation of goods, other theories state that only the welfare state can be trusted to own and manage common resources. Ostrom’s work has legitimated new and different ways to govern our resources and her contribution is especially important for water resources, which should be ana-lyzed from a local perspective. Water scarcity is indeed relative to its surroundings and people’s ability to access it hence our slow adjustments towards better water practice at a global level. Management methods and techniques are not easily transferable from one region to the other and
international institutions have limited power over local management of water. Water economics can play a role in enhancing our understanding of the mechanisms behind international trade, water availability and food security through the use of quantitative methods and empirical anal-ysis. While economists should be cautious in making global recommendations, results of such analysis should be used to make thought-out decisions on the sustainable allocation of water within local frameworks.
This thesis sets out to contribute to these pressing issues with quantitative and econometric analyses. It will deal with two major issues in water economics: water conflicts when resources are shared between countries, and food production and security when water is scarce. The chap-ters are presented in the order that they were written and I briefly provide explanations on how each chapter led to the next.
First chapter
The first chapter of this thesis, co-authored with Dr. Eric Strobl, is entitled "Water conflicts and cooperation up and down African rivers" and investigates the impact of water availabil-ity over cooperation and conflict from 1949 to 2007 between African transboundary countries sharing a common water basin. Our first contribution is to explicitly take account of relative water scarcity within a basin, as measured in m3/second by historical river flow between nations and computed by Blanc and Strobl (2013). Our second innovation is the computation of up-stream/downstream relations using the Hydro1K (USGS) dataset and the Pfaffstetter number system (1989).
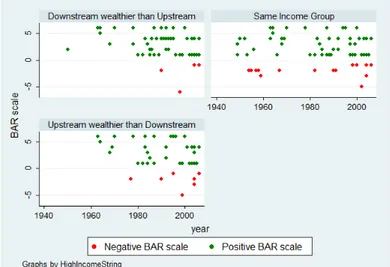
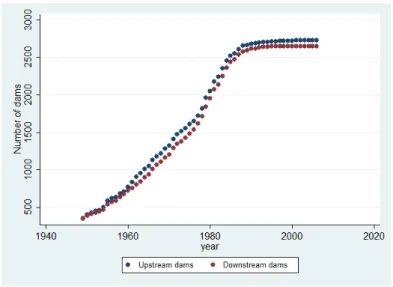
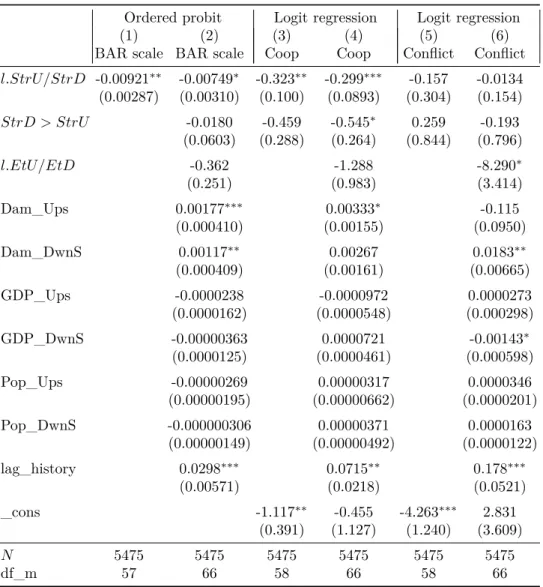
Our first model explains what triggered countries interact in the first place; the second model features an ordered dependent variable (range from -6 to +6) representing the outcome of that interaction (cooperative or negative). We find that interaction and cooperation are mostly the doing of the strategically weaker country, namely the downstream one. Transboundary water management is successful when there is little asymmetry between both countries and when the downstream country is at least as well off as the year before in terms of water availability. Fur-thermore, cooperation occurs when downstream nations are relatively wealthier, suggesting that relative economic strength can offset geographical disadvantage. We also find that the building of dams upstream has been a factor of cooperation rather than conflict and that the likeliness of cooperation between countries does not suffer from past conflicts, giving hope to many African nations with conflictive history.
In analyzing the treaties from the Basins at Risk dataset, a simple observation quickly came up: cooperation or conflict over water almost never occurred over domestic consumption. Most treaties concerned water access for small farm-holders to grow crops or breed their cattle. A coincidental meeting with Pr. Tony Allan and a summer school with Pr. Shlomi Dinar were decisive in taking the next step of this thesis by tackling water resources from a pure economic perspective within the scope of international trade.
Second chapter
Pursuing on the empirical path, the second chapter of this thesis, co-authored with Prof. Shlomi Dinar, is entitled "The Globalization of Virtual Water Flows: Explaining Trade Patterns of a Scarce Resource". The paper addresses the determinants of bilateral trade of virtual water, namely the water embedded in food and virtually traded between countries. We investigate
using the BACI dataset (Gaulier and Zignago, 2010).
We show that there is a positive correlation between exports and relative exporter-importer water endowments, suggesting that the driest countries use trade as a means to alleviate water scarcity. We also find that relative water productivity and food trade display an inverted u-shape, suggesting a threshold effect in demand in developed countries and a disregard for water resources relative to the lack of other inputs (such as capital, technology or qualified labor) in relatively water-scarce countries. In fact, for very water-inefficient exporting countries, we recommend two types of action: reallocating trade flows for products that only benefit from cheaper labor and enhancing water productivity for products that do require a specific climate-land context and cannot be produced elsewhere.
This second chapter provided an in-depth study into bilateral trade strategies and relative water endowments and productivity between exporters and importers. The third chapter com-pletes this study by investigating the basket of goods available for each country and the products that they chose to produce and export in relation to their water footprint and water endowments.
Third chapter
The last chapter of this thesis is entitled "Food production and cursed water resources: chal-lenging trade diversification mechanisms" and deals with diversification of food exports in relation to water endowments and productivity. Building on the abundant literature relating trade di-versification, resource curse and growth, we analyze food exports from 1994 to 2007 at a global level. We compute an adapted measure of the Theil index to incorporate flows of embedded (virtual) water instead of quantities of food.
Contrary to traditional results in the literature that export diversification goes hand in hand with development, we find that the food sector goes in the opposite way. Food exports con-centrate in countries as they grow richer; on the other hand, they diversify along with water availability. Because food is mostly constrained by land and water, countries do focus on prod-ucts for which they have some sort of water comparative advantage.
Furthermore, we find that water-intensive goods display lower subsistence in time when coun-tries are water-scarce and have lower water efficiency than world average. In fact, water-scarce countries have unstable diversifying trade patterns with water-intensive goods disappearing and re-appearing throughout our period of study, revealing that the inefficient use of water resources is a main obstacle to trade diversification. We conclude that inefficient water management and insufficient investments in water efficiency are an obstacle to exiting water dependency by in-ducing similar economic impacts as those caused by "traditional" cursed resources such as oil, natural gas or minerals. We recommend that water-scarce countries focus on improving the water footprint of a small number of goods in order to trigger positive spillovers to other crops and other sectors of the economy before attempting to diversify.
Water conflicts and cooperation
up and down African rivers
Esther Delbourg & Eric Strobl
"Why go to war over water? For the price of one week’s fighting, you could build five desalination plants. No loss of life, no international pressure and a reliable
supply you don’t have to defend in hostile territory".
This study investigates the impact of water endowments over cooperation and conflict be-tween African transboundary countries from 1949 to 2007. Using the Basins at Risk database (Wolf, Yoffe and Giordano, 2003), we make two contributions to the literature: first, we take account of an aspect largely ignored which is relative water scarcity within transboundary river basins, namely streamflow. Second, we concentrate our study on upstream-downstream country pairs to understand how exogenous power asymmetries over water can affect the mechanisms of water cooperation and/or conflict. Our results show that over the last 50 years, downstream nations have played a decisive role in triggering interaction and cooperation with their upstream counterpart, often allowing geographical asymmetries to be offset by economic leverage over the region. In particular, the availability of water seems to increase cooperation (or conflict) only when the downstream nation is at least as well (worse) off than in the previous years. Results indicate that dams are a factor of cooperation rather than conflict and that cooperation is cor-related with past interaction, meaning that transboundary basins with a history of cooperation over water are likely to keep cooperating in the near future. On the other hand, past conflicts do not affect likeliness of cooperation today.
JEL classification: C10, O13, Q17, Q34, Q54
1.1
Introduction
Over half of the African population lives along major river basins shared with at least one or two countries, making transboundary water management a key policy issue for water security. Sharing a common river basin implies that any use of the resource will affect, in some way, any possible use by others. As major rivers such as the Congo/Zaire, the Nile or the Niger are shared by more than ten riparian countries, it becomes inevitable for them to interact and find common grounds regarding the management of their resource (Yoffe et al., 2004; Uitto and Duda, 2002; Yoffe et al., 2003; Kameri-Mbote, 2005; Lindemann, 2005; Turton, 2005; Dinar, 2008, 2009).
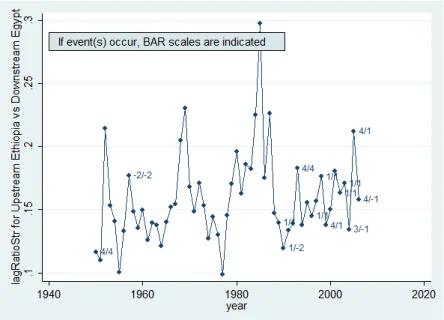
A major obstacle to smooth cooperation over water is the fact that countries are not equal in accessing the resource and their ability to use it. Countries are first and foremost constrained by their geographical features, such as relative position within a basin, soil and climatic conditions. Second, economic and political leverage can overturn those geographical advantages, enabling less advantaged countries to enforce their own rules of water allocation. For instance, the 1959 bilateral sharing agreement between downstream Egypt and Sudan over the Nile waters was enforced because of the economic and military force they could exert on upstream nations. As upstream Ethiopia is now growing stronger and gaining international support, a new power balance is settling in the region. In 1992, Zimbabwe avoided serious economic drawbacks when the RDC (former Zaire) accepted to forgo part of its hydroelectricity share to offset power shortages due to important droughts. In this case, Zaire was undoubtedly advantaged by its upstream position within the basin and higher potential for hydroelectricity production. Recent allegations of downstream Mozambique cutting hydroelectric supplies to Zimbabwe over unpaid debts in 2008 is, on the other hand, a case of economic leverage overtaking geographical asymmetries.
All three examples, taken from many cases in Africa, show that the very nature of trans-boundary management is affected by exogenous and endogenous asymmetries between countries. Understanding what drives countries to interact and determines whether the outcome is cooper-ative or conflictive thus requires to disentangle these various mechanisms. This article addresses the determinants of water interactions and their outcome, by building upon an important liter-ature in the disciplines of economics, geography and international relations.
Starting with the popular mindset that water will become a source of conflict in the coming century (Starr, 1991; Gleick, 1993; Lowi, 1993; Homer-Dixon, 1994; Ismail Serageldin, World Bank, 1995; Klare, 2001), the international relations and economic literature agree that the very nature of transboundary water management provides higher incentives for states to enter into a cooperative mode. They also argue that the history of water politics is one of cooperation rather than one of confrontation (Allan, 1997; Wolf, 1998; Yoffe et al., 2003 and Turton, 2005). Yet this does not imply that water agreements are fully cooperative or that tensions have not occurred before giving way to efficient collaboration.
To understand such cooperative outcomes, the literature first turned to politics and the absence of relevant and efficient institutions (Kameri-Mbote, 2005; Bhaduri and Babier, 2008; Dinar, 2008; Brochmann, 2012) and how they shaped the very perception of potential economic and political gains from cooperating instead of acting unilaterally (Sadoff and Grey, 2002, 2005; Whittington et al., 2005, 2006; Ambec and Ehlers, 2008). In particular, Sadoff and Grey (2002) argue that identifying the inter-related benefits of cooperation beforehand1is central to succesful
1There are four types of benefits: benefits to and from the river, cost reducations and benefits beyond the
transboundary management schemes2.
Recent models even started to account for hydro-geographic variables and how they would affect hydropower and irrigation potentials. The Nile Economic Optimization Model (NEOM) computed by Whittington, Wu and Sadoff (2005) and Wu and Whittington (2006) determines the annual pattern of water use that will maximize the sum of economic benefits from irrigated agriculture and hydropower. Their results suggest that Egypt would gain tremendous value in outsourcing hydroelectricity to upstream Ethiopia where production potential is higher given its position in the basin. This would, in turn, increase Ethiopia’s share of the Nile waters with positive externalities for domestic, agricultural and industrial consumption of water. Neverthe-less such a recommendation, based on hydro-geographical and cost-benefit analysis, was until recently incompatible with Egyptian economic and political considerations.
The previous results directly stem from the upstream-downstream asymmetry between Egypt and Ethiopia, giving an economically weaker country (Ethiopia) an undeniable advantage over a more economically powerful one (Egypt). Upstream-downstream configurations are particularly challenging because of the unidirectional (Rogers, 1997; Dombrowski, 2007) and/or reciprocal externalities (Barrett, 1994) they induce. Negative externalities in an upstream/downstream configuration can derive from upstream storage, through the use of dams or water pollution. Positive externalities can include upstream wastewater treatment or provision of retention area. Although Turton (2005) explains how availability of water has dictated economic development and induced positive externalities within the Orange basin in the last 50 years, no study has proved it empirically.
Indeed, these externalities heavily rely on the issues that countries are willing to address together. For instance, it is initially more complicated to get countries to act upon water alloca-tion issues than in the area of environmental protecalloca-tion, an area which easily obtains consensus (OECD/CSAO, 2009). The Basins at Risk project (Wolf et al., 2003), which we use in this study, finds that treaties over water quantity, quality, joint management and hydropower tend to be highly cooperative while conflictive relations tend to center around quantity and infras-tructure concerns. Yet they still conclude that no single indicator can clearly explain conflict or cooperation (among climatic, water stress, government type, dependence variables), arguing that willingness and ability to cooperate are relative to a historical context where different types of leverages are at work3.
The complexity of isolating causes of cooperation drove researchers towards another set of explanations, the first pertaining to the types of country pairs and river configurations likelier to interact and cooperate. Song and Whittington (2004) show that transboundary rivers that cross riparian countries with countervailing powers, population and economic hegemon are more likely to cooperate. They also find that river types appear more important in determining cooperative treaties than do country pair types, suggesting that cooperation is easier to achieve when there is little history of it4. Based on Shlomi Dinar’s finding (2009) of an inverted U-shape relationship 2In doing so, they assume that countries can anticipate the finality of cooperative or conflictive agreements
but do not address what can actually trigger them.
3The patterns they find are partly issued from summary statistics of their data, partly from linear regressions
models to test the level of international conflict/cooperation over water to a set of quantifiable independent variables (GDP, population density, overall relations, rate of population growth, number of dams, dam density, basin area, water stress, HDI, agriculture as % of GDP and hydropower).
4By using the same database as this article - the Basins At Risk project conducted by Aaron T. Wolf at the
Oregon University in 2003 described later on - they develop a typology of rivers according to different criteria, mainly civilization, size of population and GDP with different combinations of the three. Their study is at the global level and they only consider the existence of treaties and not their intensity.
between water scarcity and cooperation, Dinar, Dinar and Kurukulasuriya (2011) study three cooperation variables for the whole of each basin (interaction, number of treaties signed and share of water-allocation issues) and show that more developed states use economic incentives to stir cooperation when they need it.
Lastly, a growing literature has also sought to relate climate change to conflicts, mainly by exploring the rivalry induced by the degradation of available resources, forcing populations to migrate internally or to cross borders (Homer-Dixon, 1994; Hauge and Ellingsen, 1998; de Soysa, 2002; Miguel et al., 2009; Dinar et al., 2014).
Although the literature has addressed geographical and economic asymmetries, surprisingly little attention has been given to the decisive exogenous features of geography, climate and water availability together, arguably constituting an important gap in the literature. First of all, the upstream-downstream feature has never been specifically exploited when analyzing water events. Second, a most relevant variable that is directly affected by upstream/downstream relative po-sitions - the quantity of water running through countries, namely streamflow - has not been studied within the scope of water agreements.
Our paper contributes to the literature on the determinants of water cooperation by empiri-cally investigating how streamflow and evapotranspiration - a measure of plant transpiration and a main climatic parameter - can trigger water cooperation or conflict between African nations that specifically display an upstream-downstream relationship. Using the Basins At Risk data (Wolf et al., 2003) which lists and grades all the water events according to their cooperative or conflictive nature, we build our dataset to determine relative position of countries within basins and use it to understand how economic asymmetries are at play when interacting with geographical features.
Our first innovation in this approach is to explicitly take account of actual relative water scarcity within a basin, as measured by historical river flow between nations. Streamflow is computed on an annual basis by Blanc and Strobl (2013) from 1949 to 2007 and contains infor-mation on land cover type, soil characteristics, daily precipitation and network coverage. Our second contribution is the computation of upstream/downstream relations coupling the Hydro1K (USGS), a dataset containing topographically derived data sets of streams and drainage basins with the Pfaffstetter numbering system (1989) for watershed identification which describes the regional anatomy and enables us to identify the direction of streams. Combined with geograph-ical, spatial and climatic data, this water event database offers a resource for a qualitative and quantitative exploration of African water issues.
Our results show that the likeliness of interaction over transboundary waters and the coop-erative outcome of such water agreements are greatly the doing of downstream nations. Their relatively weaker position provides incentives to interact when they need to and agreements turn out to be more cooperative when they are relatively better off in terms of streamflow than the previous year. In particular, the availability of water seems to increase cooperation when there is little asymmetry between upstream and downstream availability of water. Furthermore, wa-ter inwa-teraction and cooperation are likelier to occur when the downstream nation is relatively wealthier, suggesting that they use their relative economic strength to initiate interaction and influence the outcome of the agreement. We also find that the building of upstream dams has been a factor of cooperation rather than conflict and that the history of cooperation between two nations does trigger further interaction, providing hope for many African nations and basins for which transboundary water management is fairly recent.
literature. We then discuss the complex nature of our different data base and out variables before explaining our identification strategy and displaying our results.
1.2
Data and Summary Statistics
1.2.1
Region and Unit of Analysis
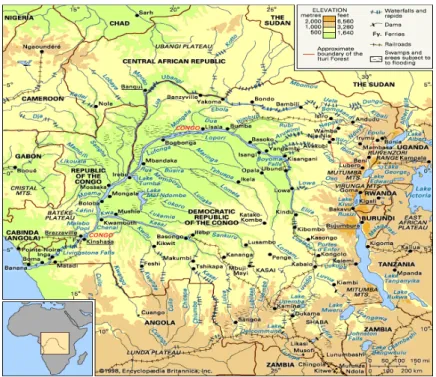
This study will focus on 16 river basins in the African continent, namely: the Awash, the Congo/Zaire, the Gambia, the Incomati, the Juba-Shibeli, the Kunene, the Lake Chad, the Limpopo, the Niger, the Nile, the Okavango, the Orange, the Ruvuma, the Senegal, the Volta and the Zambezi. The basins are represented in Figure 1.1 and Appendix 1.6.2 provides further economic and demographic details.
We choose our unit of study to be country pairs to specifically observe the upstream vs down-stream unilateral relationship and enquire into bilateral mechanisms of cooperation and conflict. Our database thus comprises every possible country pair for each basin of study, regardless of whether countries share a common border or not.
Figure 1.1: International River Basins of Africa - Copyright Transboundary Freshwater Dispute Database, 2000
1.2.2
The Basins At Risk scale
The Transboundary Freshwater Dispute Databse (TFDD, Wolf et al., 2003) and the BAR scale, taken from the Basins At Risk project, covers historical incidents of international water cooper-ation and conflict from 1950 to 2008. The events are ranked by intensity from -6 to +6 using precise definitions of conflict and cooperation as defined in Appendix A. Formal water events
can occur between two or more countries and the dataset attributes the same BAR scale to each of the countries involved in a specific water-related event (see Appendix C for an example of a query for the Nile basin). As such, water treaties can include countries that do not share a river basin but we limit ourselves to country interactions within river basins and not between them. Studying such interactions goes beyond the scope of this paper because countries are no longer constrained by their relative positions within a specific basin.
The difficulty of assessing the intensity of water events lies in the very complexity of defining conflict and cooperation. In the database, water conflicts can be understood as a series of tensions or specific non-cooperative acts perpetrated by one of the countries regarding the others. On the other hand, cooperation will designate a series of agreements and events fostering bilateral or multilateral action for the sake of the common resource. A main issue is that the popular approach that conflict ends when cooperation begins is limited as both of them can co-exist at the same time (Allan, 2012). Also, conflict and cooperation are not to be understood locally in time but rather widespread over several periods which are difficult to identify. The 1959 bilateral agreement between Egypt and Sudan over the Nile waters was still being informally enforced until recently even though this conflictive event was never officially renewed and does not appear again in the database. The dataset does not take into account such a time effect, as it lists agreements or events in the year they took place and will consider years to follow as empty of such events, almost as if the interaction had ceased existing. This aspect will play a role in interpreting our results.
Also, we might be tempted to acknowledge the absence of conflict rather than the existence of cooperation. This was described by Johan Galtung (1969) as "negative peace", namely the absence of violence without further constructive collaboration. In fact, when nothing is happening on a formal basis that is the absence of cooperation or conflict for a given year or basin -it does not imply that countries are not interacting. It may mean that countries are currently satisfied with the status quo, working on future regulations or following previous treaties; it can also mean that certain forms of cooperation do not require formal agreements.
We use the BAR scale in two different ways: first, by observing whether an event has occurred or not in a given year for a specific country pair, with a dependent binary variable. Second, by taking its value (from -6 to +6) when country pairs have interacted at least once, according to Wolf’s terms, over the years 1949 to 2006. We built our database in order for each water event to appear once in the database if it only involved two countries and as many times as there are country-pairs if it involved more than two countries.
1.2.3
Upstream vs downstream relationships
Given the complexity of basin and river configurations, there is no international database avail-able that precisely determines upstream-downstream relationships for country pairs with complex configurations. Figures 1.2 and 1.3 illustrate the difficulty of determining the type of hydro-geographic relation that exists between two countries, in the whole of the African continent, and in the specific case of the Congo/Zaire river basin. Indeed, a great number of riparian countries do not feature a clear downstream/upstream relationship: rivers can form a perfect border be-tween both countries or flow from country A to country B, with part of it being fed by a tributary source that comes from country B and flows itself into country A.
A main contribution of this article is that we built our upstream-downstream variable through the comprehensive use of Geographic Information Systems (GIS) and exploitation of the Hy-dro1K database from the U.S. Geographical Survey (USGS)5. Making extensive use of Arcgis,
Figure 1.2: Africa’s major river basins cross political borders - Source: UNEP 2002
a geographic information system (GIS) for working with maps and geographic information, we overlaid African river maps with basins and countries, thus disaggregating our maps into the smallest units of basins possible as defined by the Pfafstetter numbering system. The Pfafstetter numbering system, as developed by the Brazilian engineer Otto Pfafstetter in 1989, describes the regional anatomy of stream networks using a hierarchical arrangement of decimal digits. Watersheds are distinguished between basins, interbasins and internal basins. Basins are the headwater of rivers and do not receive any inflow from other water areas; interbasins receives flow from upstream watersheds and internal basins are closed. The Pfafstetter system attributes levels of classification from 1 to 5 which help identify the direction of inflows and outflows. We provide complete details of our methodology in Appendix D.
Level 1 classification is the highest one and is attributed to major river basins, level 5 being the lowest and attributed to minor rivers or streams. At each level, the four largest basins are identified and assigned Pfafstetter digits 2, 3, 6 and 8 in a clockwise direction. The five largest interbasins are assigned digits 1, 3, 5, 7 and 9, clockwise. Internal basins are assigned the number 0. Basins continue to be subdivided and numbered as before at levels 2 to 5. Interbasins continue to be divided into the 4 largest basins at levels 2 to 5 but instead of numbering the resulting basins in a clockwise direction, the basins are numbered from the most downstream basin to the most upstream. We use this method to determine whether each watershed, at the smallest level, is upstream or downstream from its nearest neighbor.
1.2.4
Streamflow/Runoff
Our second main innovation comes from using a measure of the water resources over which coop-erative/conflictive events occurs and proxying this by a measure of streamflow. More precisely, streamflow is a component of the water runoff and the main mechanism by which water moves from the land to the oceans. It is measured in m3.s−1 and is mainly formed by precipitation runoff in the watershed and the contribution of other tributary rivers or water bodies. As such, streamflow is shared by countries and crosses borders. It has the particularity of changing from day to day, mostly because of natural6 or human-induced mechanisms and increases as it flows further downstream7. It is a mostly relevant and useful indicator for our study as streamflow will determine both the amount of water available to a country but then also its leverage on or its dependency regarding the whole of the basin.
We use the streamflow computed by Blanc and Strobl (2013) where they compute streamflow data per year and per country using the GeoSFM model (Geospatial Stream Flow Model) built by the USGS (U.S. Geographical Survey). It is a semidistributed physically based hydrologi-cal model, with particular relevance for Africa’s hydrology (Asante et al., 2007a; Asante et al., 2007b). It stimulates the dynamics of runoff processes using spatial information on river basin and network coverage, land cover type, soil characteristics and daily precipitation and evapo-transpiration data. Blanc and Strobl then use the HYDRO1k data to delineate basins and river network.
and drainage basins derived from the USGS30 arc-second digital elevation model (DEM) of the world (GTOPO30). It allows scale modeling and analyses of African rivers.
6Runoff from rainfall and snowmelt, evaporation from soil and surface-water bodies, evapotranspiration,
ground-water discharge from aquifers, sedimentation of lakes and wetlands, etc.
7Surface-water withdrawals and transbasin diversions (through dams), construction, removal, and
1.2.5
Evapotranspiration
Evapotranspiration combines normal evaporation and plant transpiration from land surface to atmosphere and is measured in millimetres (mm) per unit of time. It represents an evaporative demand of the air within a basin. Because plants will transpire more as soils are liquid, such a measure is important in order to manage catchments for water supply and irrigation. Contrary to streamflow which flows from country A to country B, evapotranspiration is a purely local variable. It is also a comprehensive weather indicator as it is a combination of solar radiation and temperature.
We use the data computed by Blanc and Strobl (2013)8 where they follow the computation in Hargreaves and Samani (1985):
ET = 0.0023(T avg + 17.8)(T max − T min)0.5Ra (1.1)
where Tavg, Tmax and Tmin are mean, maximum and minimum temperature, respectively and Ra is the extraterrestrial radiation calculated following Allen et al. (1998)9.
1.2.6
Population, GDP, Dams, Bilateral Trade and Lagged Values
We control for country-specific features that are likely to play a role in whether countries interact over water management and whether the outcome is cooperative or conflictive. We introduce three variables: population, gdp per capita from the Penn World Table (PWT) 7.010and number of dams per country.
Countries that build dams over the years are more likely to be involved in water events although this information cannot help predict the intensity of such events. Investments in dams will show concern for water management and water access as they affect the shared resource as a whole. It fosters discussion over water issues and increases the likelihood of interaction. On the other hand, an increase in the number of dams also increases the likeliness of non-compatible projects upstream vs downstream. Controlling for the number of dams enables to understand interaction ahead of time. These issues will be further discussed along with the results. The number of dams per country and per year is provided by Strobl and Strobl (2010) where they use the FAO’s African Dams Database, a georeferenced database of large dams11.
Because we assume that the number of dams will affect water events, we also have to assume that formal water agreements will arise with those changes. Taking the lagged values of both those variables will enable us to incorporate their effects over time. Indeed, building a dam upstream or downstream requires public concern for water-related issues and so perhaps a higher
8Evapotranspiration data is obtained from the CRU TS 2.1 dataset (Mitchell and Jones, 2005) compiled by
the Climatic Research Unit (CRU) at the University of East Anglia. Strobl and Blanc (2009) use monthly data on mm of precipitation and degrees of average, minimum and maximum temperature, all of which were given at the 0.5 degree resolution globally for land surface areas over the period 1901-2002, to calculate annual river basin level measures of these weather factors.
9The rate expresses the amount of water lost from a cropped surface in units of water depth. The time
unit here is year. As one hectare has a surface of 10000 m2 and 1 mm is equal to 0.001 m, a loss of 1 mm of
water corresponds to a loss of 10m3 of water per hectare. In other words, 1 mm.day−1 is equivalent to 10 m3
.ha−1.day−1.
10It is provided by Alan Heston, Robert Summers and Bettina Aten, Penn World Table Version 7.0, Center for
International Comparisons of Production, Income and Prices at the University of Pennsylvania, May 2011. It is derived from growth rates at 2005 constant prices.
11It contains information about the date of construction and was completed using updated data from the
International Commission on Large Dams (ICOLD), internet searches and a list of dams and their characteristics provided by the South African Department of Water and Forestry.
and compelled commitment to transboundary management. Building a dam will also affect the shared basin and foster cooperation or tensions.
We follow the same reasoning for real gdp. As a control variable for economic development, it can be highly correlated with unobserved factors influencing the intensity of water events. African economies rely heavily on farming and irrigation, and are thus easily affected by lack of water, harsh climatic conditions and poor water infrastructures. Enhanced climatic conditions may steer local economy and increase real gdp per capita, making the country either less or more cooperative according to the benefits it can reap out of a formal water agreement. Taking the lag value of real gdp per capita enables us to get round this contemporary correlation.
We will also be using a lagged historical variable representing the lagged sum of events a country pair has been involved in since 1949. This is helpful in analyzing the frequency of a country pair in water events, moreover as water events between two countries generally follow each other closely in time, thus supposedly increasing the likeliness of having an event occur as the years go by.
1.2.7
Summary Statistics
Our dataset comprises 33 countries that display an upstream-downstream relationship over a span of 58 years. Table 1.1 shows the main summary statistics of our variables of interest. "Et" stands for evapotranspiration. The letters "U" and "D" at the end of the variables stand for "upstream" and "downstream". Note that upstream streamflow has a slightly lower average value than downstream streamflow. As mentioned earlier, the size of rivers and their streamflow increase naturally as it moves downstream given the construction of the streamflow variable.
Table 1.1: Summary statistics
Variable Mean Std. Dev. Min. Max.
BAR scale 0.204 0.959 -5 6 StreamflowU 1200.049 1951.627 5.698 16079.916 StreamflowD 1497.713 2409.28 5.698 16079.916 etU 11.433 1.801 7.497 15.169 etD 11.408 1.744 8.539 15.169 DAMU 14.032 50.144 0 433 DAMD 13.397 50.133 0 433 rgdpU 1423.18 1812.781 151.18 22956.973 rgdpD 1580.052 2300.41 151.18 22956.973 popU 10427.293 12898.722 415.767 140397.766 popD 12583.563 16982.324 271.369 140397.766 Source: Author computations
Table 1.2 displays some statistics on formal water events according to geographical configu-rations. Together they show that from 1949 to 2006, upstream-downstream country pairs have interacted, on average, 3.5 times vs 1.9 for other types of country pair configurations.
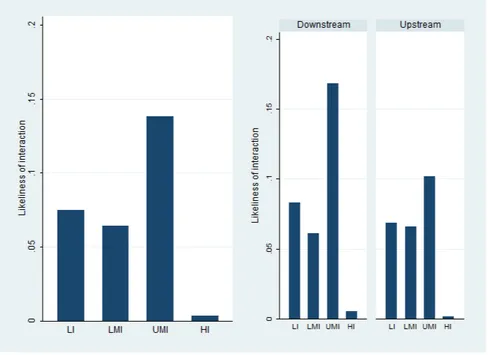
Likeliness of interaction
Figure 1.4 shows the likeliness of a country interacting with its upstream or downstream counterpart, according to its income group (LI: Low-income, LMI: Low-Middle income, UMI: