HAL Id: inserm-00451995
https://www.hal.inserm.fr/inserm-00451995v2
Submitted on 10 May 2010
HAL is a multi-disciplinary open access
archive for the deposit and dissemination of
sci-entific research documents, whether they are
pub-lished or not. The documents may come from
teaching and research institutions in France or
abroad, or from public or private research centers.
L’archive ouverte pluridisciplinaire HAL, est
destinée au dépôt et à la diffusion de documents
scientifiques de niveau recherche, publiés ou non,
émanant des établissements d’enseignement et de
recherche français ou étrangers, des laboratoires
publics ou privés.
acquisition in two non-mammalian vertebrates.
Maella Gohin, Julien Bobe, Franck Chesnel
To cite this version:
Maella Gohin, Julien Bobe, Franck Chesnel.
Comparative transcriptomic analysis of
follicle-enclosed oocyte maturational and developmental competence acquisition in two non-mammalian
ver-tebrates.. BMC Genomics, BioMed Central, 2010, 11 (1), pp.18. �10.1186/1471-2164-11-18�.
�inserm-00451995v2�
R E S E A R C H A R T I C L E
Open Access
Comparative transcriptomic analysis of
follicle-enclosed oocyte maturational and developmental
competence acquisition in two non-mammalian
vertebrates
Maella Gohin
1,2, Julien Bobe
2*, Franck Chesnel
1*Abstract
Background: In vertebrates, late oogenesis is a key period during which the oocyte acquires its ability to resume meiosis (i.e. maturational competence) and to develop, once fertilized, into a normal embryo (i.e. developmental competence). However, the molecular mechanisms involved in these key biological processes are far from being fully understood. In order to identify key mechanisms conserved among teleosts and amphibians, we performed a comparative analysis using ovarian tissue sampled at successive steps of the maturational competence acquisition process in the rainbow trout (Oncorhynchus mykiss) and in the clawed toad (Xenopus laevis). Our study aimed at identifying common differentially expressed genes during late oogenesis in both species. Using an existing transcriptomic analysis that had previously been carried out in rainbow trout, candidate genes were selected for subsequent quantitative PCR-based comparative analysis.
Results: Among the 1200 differentially expressed clones in rainbow trout, twenty-six candidate genes were selected for further analysis by real-time PCR in both species during late oogenesis. Among these genes, eight had similar expression profiles in trout and Xenopus. Six genes were down-regulated during oocyte maturation
(cyp19a1, cyp17a1, tescalcin, tfr1, cmah, hsd11b3) while two genes exhibited an opposite pattern (apoc1, star). In order to document possibly conserved molecular mechanisms, four genes (star, cyp19a1, cyp17a1 and hsd11b3) were further studied due to their known or suspected role in steroidogenesis after characterization of the orthology relationships between rainbow trout and Xenopus genes. Apoc1 was also selected for further analysis because of its reported function in cholesterol transport, which may modulate steroidogenesis by regulating cholesterol bioavailability in the steroidogenic cells.
Conclusions: We have successfully identified orthologous genes exhibiting conserved expression profiles in the ovarian follicle during late oogenesis in both trout and Xenopus. While some identified genes were previously uncharacterized during Xenopus late oogenesis, the nature of these genes has pointed out molecular mechanisms possibly conserved in amphibians and teleosts. It should also be stressed that in addition to the already suspected importance of steroidogenesis in maturational competence acquisition, our approach has shed light on other regulatory pathways which may be involved in maturational and developmental competence acquisitions that will require further studies.
* Correspondence: Julien.bobe@rennes.inra.fr; Franck.chesnel@univ-rennes1.fr
1CNRS/IGDR (UMR 6061), IFR140 GFAS, Université de Rennes I, 2, Avenue du
Pr. Léon Bernard, 35043 Rennes Cedex, France
2Institut National de la Recherche Agronomique, INRA SCRIBE, UR1037,
IFR140 GFAS, Campus de Beaulieu, 35000 Rennes Cedex, France
© 2010 Gohin et al; licensee BioMed Central Ltd. This is an Open Access article distributed under the terms of the Creative Commons Attribution License (http://creativecommons.org/licenses/by/2.0), which permits unrestricted use, distribution, and reproduction in any medium, provided the original work is properly cited.
Background
Late oogenesis is a key period in the complex process ultimately leading to the release of the female gamete from the ovary. During this period, the oocyte under-goes meiotic maturation (also known as oocyte matura-tion), a process leading to an oocyte that will remain arrested in metaphase II until fertilization. The ovulatory process that allows the release of the oocyte from the ovarian follicle also takes place during late oogenesis. Both oocyte maturation and ovulation have been exten-sively studied in vertebrates [1-4]. However, other key biological processes that also occur in the ovary during late oogenesis have received far less attention. During this time period, the oocyte acquires not only its ability to resume meiosis, once hormonally stimulated, but also its ability to develop, once fertilized, into a normal embryo. These two processes are referred to as matura-tional competence acquisition and developmental com-petence acquisition, respectively. They both rely on events that could occur very early in the oogenetic pro-cess. For example, the accumulation of maternally-inherited mRNAs into the oocyte that can occur very early during oogenesis is known to support embryonic development until the activation of the zygotic genome [2,5,6]. It is also noteworthy that oocyte-somatic cell interactions and communications participate, at least in mammals, in the acquisition of the ability of the oocyte to resume meiosis, to be ovulated, to be fertilized, and to subsequently develop into a normal embryo [7]. Nevertheless, maturational and developmental compe-tence acquisitions remain poorly understood, especially in non-mammalian vertebrates in which available data remain scarce. This problem is further complicated by the large variety of ovarian development types found among those species. In teleosts for instance, the dynamics of follicular recruitment can be extremely variable in comparison to what is seen in mammals [8]. It should however be stressed that amphibians and tele-osts share a common ovarian follicular structure that is also very different from the mammalian follicle in which an antrum is formed during late folliculogenesis [2]. This common feature could suggest that conserved mechanisms may exist among these two non-mamma-lian vertebrate groups. In an attempt to identify con-served molecular mechanisms underlying oocyte development, the present study was designed to identify common genes that are differentially expressed by the ovarian follicles during late oogenesis in a teleost fish and an amphibian. The rainbow trout (Oncorhynchus mykiss) and the south-African clawed toad (Xenopus lae-vis) were selected because both species have significant genomic resources and a large background in oocyte maturation studies [9,10]. Moreover, Xenopus ovarian
development is asynchronous and follicles of all stages (I-VI) can be found in the same ovary at any time [11]. While this type of ovarian development can also be found in numerous teleosts, the rainbow trout has, in contrast, a group-synchronous ovarian development type and all follicles of a single clutch develop simulta-neously once a year [12]. Thus, we aimed at identifying molecular mechanisms that would be conserved among the two studied vertebrate groups despite existing differ-ences in ovarian development types. Indeed, it should be stressed that amphibians and teleosts share common mechanisms such as the predominant role of progester-one or a progestin, the maturation-inducing steroid, in the induction of meiosis resumption [10,13]. To achieve our goal, differentially expressed genes were selected from an existing microarray study previously carried out in rainbow trout [14] and subsequently studied in both species using quantitative PCR (QPCR). The compara-tive QPCR-based analysis was carried out during late oogenesis at successive steps of maturational compe-tence acquisition in both species. Finally, the nature of some common molecular mechanisms was highlighted through a deeper analysis of specific genes encoding proteins with known or suspected functions in steroidogenesis.
Results
Candidate genes selection
In a previous study, a microarray analysis was carried out during rainbow trout late oogenesis [14] and data subsequently deposited in Gene Expression Omnibus database (GEO Series accession number GSE4871). This existing dataset was reanalyzed and used to select candi-date genes for the QPCR-based comparative analysis carried out hereafter. A Significance Analysis of Micro-array (SAM) procedure with a false discovery rate (FDR) of 5% was performed in the present study and resulted in the identification of 1200 differentially expressed genes (Fig. 1A). The clustering analysis of these 1200 clones resulted in the identification of two major clus-ters of genes. The first cluster contained 891 clones that were down-regulated throughout post-vitellogenesis and oocyte maturation. In contrast, the second cluster con-tained 309 clones that were up-regulated during oocyte maturation. Among the 1200 differentially expressed genes, 88% were annotated with at least one GO biologi-cal process term (Table 1). Among the most enriched biological processes associated with cluster 1 genes, sev-eral ones appeared to be involved in DNA/RNA meta-bolism and post-translational modifications [see Additional file 1]. When considering cluster 2 genes, the enrichment analysis brought up biological processes involved in the regulation of transcription, cell cycle
progression, cell adhesion and cell communication [see Additional file 2].
Together, these functions are consistent with the var-ious physiological processes undergone by the follicle-enclosed oocyte during the preovulatory period (i.e. ovu-lation, fertilization and embryo development) [1].
Twenty-three genes exhibiting at least a two-fold change in expression between late/post-vitellogenesis and oocyte maturation were selected among the differ-entially expressed genes (Table 2) for the QPCR-based comparative analysis. In addition, three genes (11b 3-hydroxysteroid dehydrogenase hsd11b3, the connexin cx32.2and the transcription factor etv5) that exhibited a lower differential expression were also kept for further analysis based on their putative role in oocyte matura-tional and developmental competence acquisition [15,16]. A total of 26 genes was thus kept for further QPCR-based comparative analysis (Table 2). Xenopus sequences were identified by a reciprocal best blast hit strategy using the rainbow trout sequence as a query. Accession number and symbol of Xenopus genes are also shown in table 2. These genes are involved in dif-ferent cellular functions such as metabolic processes, trafficking, proteolysis, transcription, cell cycle, and post-translational protein modifications.
QPCR-based comparative analysis during late oogenesis
In rainbow trout, a differential expression was demon-strated for 24 genes out of 26 (Fig. 2). For those 24 genes, the expression ratios calculated from QPCR and microarray data are consistent even if some limited dif-ferences exist, mostly due to the underestimation of highest differential expression by nylon array technology (Table 2). Six genes belonging to cluster 1 (cyp19a1a, cyp17a1, tescalcin, tfr1, cmah, hsd11b3) showed a decreased expression during maturation. Eighteen genes belonging to cluster 2 exhibited an increased mRNA expression throughout late oogenesis. These genes are mostly related to proteolysis, regulation of transcription, cell cycle and cellular junctions. Contrarily to the results of the microarray analysis, two genes (rbm39a and rgs18) showed a stable expression profile throughout late oogenesis. In Xenopus, 24 among the 26 assayed genes were down-regulated during late vitellogenesis and/or maturation whereas only 2 genes (the apolipo-protein apoC1, and the STeroidogenic Acute Regulatory protein star-A) showed a sharp increase of mRNA expression during late vitellogenesis or at the time of oocyte maturation, respectively (Fig. 2). In summary, eight genes shared similar expression profiles in both rainbow trout and Xenopus during late oogenesis. Among these genes, six were down-regulated during oocyte maturation (cyp19a1a, cyp17a1, tescalcin, tfr1, cmah, hsd11b3) while two exhibited an opposite pattern (apoc1, star). Expression level Cluster 1 (891 genes) Cluster 2 (309 genes) LV PV Mat. Low High -0.85 -0.57 -0.28 0.00 0.28 0.57 0.85
Figure 1 Gene expression profiling during rainbow trout late oogenesis Supervised average linkage clustering analysis of 1200 clones in rainbow trout ovary during late vitellogenesis (LV, n = 3), post-vitellogenesis (PV, n = 4) and during maturation (Mat., n = 6). Each row represents a gene and each column an ovarian RNA sample. The 13 samples are supervised according to the natural time-course of oogenesis. Data were log2-transformed and median-centered prior to the clustering analysis. For each gene the expression level within sample set is indicated using a color density scale. Red and green are used for over- and under-expression respectively, while black is used for median expression.
Table 1 Number of Gene Ontology (GO) functional annotation terms associated with differentially expressed genes using DAVID software
Number of differentially expressed genes GO annotated genes genes with associated GO biological process Total 1200 1059 (88.25%) 1056 (88%) Cluster 1 891 764 (85.75%) 759 (85.18%) Cluster 2 309 304 (98.38%) 297 (96.12%)
The number of differentially expressed genes, the number and percentage of genes associated with at least one GO functional annotation term, and the number and percentage of genes associated with at least one GO biological process term are indicated. Clusters 1 and 2 correspond to the gene clusters presented in fig. 1.
Table 2 Genes assayed by QPCR in ovarian samples fromOncorhynchus mykiss and from Xenopus laevis
Oncorhynchus mykiss Xenopus laevis
target genes symbol GenBank# LV/ PV LV/ MAT PV/ MAT LV/ PV LV/ MAT PV/ MAT
symbol GenBank# IV/ VI
IV/ MAT
VI/ MAT
microarray ratio QPCR ratio QPCR ratio
*Aromatase cyp19a1a BX083177 2.58 25 9.67 2.6 182 76 P450arom-A
NM_001085653 313 1237 3.95 *Cytochrome P450
17A1
cyp17a1 BX072662 0.84 2.46 2.92 1.15 4.7 4.5 cyp17a1 AF325435 2.41 3.77 1.56 * RNA-binding region-containing protein 39 rbm39a BX081888 1.77 3.06 1.73 0.59 0.52 0.99 rbm39 BC077813 1.68 2.25 1.34 * A disintegrin and metalloproteinase domain 8 adam8a BX871415 0.50 0.23 0.45 1.18 0.10 0.18 A disintegrin and metalloproteinase domain 13 adam13 NM_001087445 2.28 2.94 1.29 * A disintegrin and metalloproteinase domain 22 adam22 CA363158 1.00 0.42 0.42 0.47 0.14 0.30 A disintegrin and metalloproteinase domain 11 mdc11b NM_001087444 1.41 1.65 1.17 * Protein kinase C delta type prkcd CA372310 1.02 0.52 0.51 0.77 0.09 0.12 pkc-delta2 NM_001090993 1.43 2.19 1.52 * Serum/ glucocorticoid related kinase 2 sgk2 CA387850 0.99 0.24 0.24 0.01 0.0007 0.08 sgk1a NM_001090340 2.97 1.72 0.58 * Serine protease 23 prss23 BX087643 0.53 0.26 0.49 0.21 0.07 0.35 prss23 CD255705 2.79 7.85 2.82 * Regulator of G-protein signaling 18 rgs18 BX876662 1.04 0.42 0.40 0.94 0.98 1.18 rgs18 NM_001092321 1.95 2.17 1.11 * Forkhead box O5 foxo5 BX885992 0.91 0.32 0.35 0.55 0.10 0.19
Forkhead box O3 foxo3 NM_001092949 1.94 1.85 0.95 * Cytidine monophosphate-N-acetylneuraminic acid hydroxylase cmah BX878414 1.28 5.88 4.58 1.26 10.57 9.26 cmah NM_001086828 7.26 6.16 0.85 *Steroidogenic acute regulatory protein
star BX079021 0.81 0.34 0.41 0.56 0.20 0.35 star-A AF220437 0.23 0.02 0.10
* Growth arrest and DNA-damage-inducible protein beta
gadd45bii CA363171 0.83 0.36 0.43 0.59 0.14 0.26 gadd45b DT070441 2.41 2.89 1.20
*Apolipoprotein CI apoc1 CA353171 0.27 0.14 0.53 0.26 0.13 0.52 apoc1 DQ096911 0.23 0.40 1.75 *11-beta 3-hydroxysteroid dehydrogenase hsd11b3 CA348069 0.83 1.2 1.45 1.29 3.69 2.97 hsd11b3 BC106472 2.18 3.09 1.41 * Receptor-type tyrosine-protein phosphatase F ptprf CA360891 0.68 0.38 0.56 0.69 0.28 0.43 xptp-d NM_001090381 2.71 8.97 3.31 * Dystrophin dmd CA377239 0.83 0.11 0.13 0.53 0.55 0.84 dmd X99700 2.11 2.38 1.13 * Cyclin L1 ccnl1 BX863114 0.79 0.55 0.70 1.01 0.65 0.64 ccnl1 BC073707 1.40 1.66 1.19 *Transferrin receptor protein 1 tfr1 BX860777 1.36 3.07 2.26 1.47 3.41 2.50 tfr1 CA790915 1.98 7.12 3.58 * C-ETS-2 protein ets2 CA368141 0.99 0.39 0.39 1.11 0.36 0.34 ets2b X52635 1.40 1.96 1.40 * ETS translocation
variant 5
etv5 BX870637 0.98 0.71 0.74 0.59 0.62 1.18 XER81 xer81 AF057565 1.38 1.69 1.22
A. Oncorhynchus mykiss cyp19a1a / p450-aromA cmah tesc hsd11b3 tfr1 cyp17a1 rgs18 rbm39a / rbm39 etv5 / xer81 ccnl1 dhcr7 ets2 / ets2b prkcd / pkc-delta2 tjp1 cldn11 ptprf / xptp-d gadd45bii / gadd45b Sgk2 / Sgk1a foxo5 / foxo3 adam22 / mdc11b adam8a / adam13 star / star-A apoc1 dmd prss23 cx32.2 LV PV Mat. B. Xenopus laevis IV VI PI VI MII -3.00 -2.00 -1.00 0.00 1.00 2.00 3.00 -2.98 -1.98 -0.94 0.00 0.94 1.98 2.83
Figure 2 Expression of 26 genes assessed by real-time PCR in Oncorhynchus mykiss and Xenopus laevis ovarian samples. QPCR analysis of the 26 candidate genes in rainbow trout (A) ovary during late vitellogenesis (LV, n = 6), post-vitellogenesis (PV, n = 14) and during
maturation (Mat., n = 8), and in Xenopus (B) ovarian follicles at stage IV, stage VI and after oocyte maturation (metaphase-II arrested oocytes) from six adult females. Data were normalized to the abundance of 18S, log2-transformed, and median-centered prior to the clustering analysis. The expression data sets have been supervised according to oogenesis stage. Genes with similar expression profiles in both species are bolded. The dendrograms on the left represent correlation distances between the profiles of studied trout genes. For each gene the expression level within sample set is indicated using a color density scale. Red and green are used for over- and under-expression respectively, while black is used for median expression (grey boxes, not determined).
Table 2: Genes assayed by QPCR in ovarian samples fromOncorhynchus mykiss and from Xenopus laevis (Continued) * Gap junction Connexin-32.2 protein cx32.2 BX082081 0.96 1.2 1.25 0.17 0.13 0.82 cx32 DQ096928 1.28 2.45 1.91 * Tight junction protein ZO-1 tjp1 BX872029 0.87 0.48 0.55 0.85 0.45 0.54 tjp1 BC088825 2.36 2.84 1.21 * Claudin-11 cldn11 BX301535 0.77 0.37 0.48 0.43 0.16 0.39 cldn11 CB591807.1 1.90 2.66 1.40 *Tescalcin tesc BX877446 0.71 2.34 3.27 0.84 13.19 13.90 tesc NM_001095029 2.44 2.34 0.96 *
7-dehydrocholesterol reductase
dhcr7 BX884545 0.87 0.48 0.55 1.17 0.26 0.25 dhcr7 NM_001087087 1.96 1.79 0.91
For each gene, official name, official symbol, GenBank accession number, and expression ratio among studied stages deduced from microarray and QPCR analyses are indicated. Target gene names are bolded when their expression profile during late oogenesis is similar in both species. Thirteen rainbow trout females were used for the transcriptomic analysis (FV, n = 3; PV, n = 4; females; Mat., n = 6) [14], while 28 females (FV, n = 6; PV, n = 14 females; Mat., n = 8) were used for QPCR, including the females used for the transcriptomic analysis.
Characterization of genes with known or suspected functions in steroidogenesis
Among the eight genes exhibiting similar expression profiles in both species, four genes encode proteins with known or suspected functions in steroidogenesis and were further studied here. In addition, the apolipopro-tein C1 (apoC1) may also be linked to steroidogenesis as the cholesterol necessary for ovarian steroidogenesis may come either from de novo synthesis or from lipo-protein cholesterol uptake. ApoC1 was therefore selected for further analysis. In vertebrates, including rainbow trout and Xenopus, the orthology relationships of cyto-chrome P450 19A1 (cyp19a1) and STeroidogenic Acute Regulatory protein (star) are well characterized [17-20] (although star-A is the Xenopus official symbol, we will use star hereafter for both trout and Xenopus genes for clarity reason). In contrast, Xenopus orthologs of
cyp17a1, hsd11b3and apoC1 had not been previously
identified clearly. We thus performed specific phyloge-netic analyses that are reported in additional files 3, 4 and 5 for cyp17a1, hsd11b3 and apoC1 respectively, to demonstrate orthology relationships between rainbow trout and Xenopus sequences.
The rainbow trout and Xenopus Cyp17a1 protein sequences exhibit 47% overall sequence identity with the cognate human protein. The rainbow trout Cyp17a1 protein sequence exhibits 61% sequence identity with cyp17a1 Xenopus sequence (Fig. 3). Three conserved domains have been characterized [21]. The domain I is composed of a heme-binding domain [22] and displays 71% of identity between human and trout sequences, and 79% of identity between trout and Xenopus sequences. The domain II is a conserved tridecapeptide, with a putative steroid-binding domain [23]. This domain is 77% identical between human and trout sequences and 87% between trout and Xenopus sequences. The domain III has been described as a CYP17 specific domain [21] and shows 62% of identity between human and trout sequences and 90% of identity between trout and Xenopus sequences. Finally, a muta-tion of the human ser-106 or a delemuta-tion of the three amino acids asp-487, ser-488 and phe-489 abrogate CYP17 activity [24,25]. Interestingly, these amino-acids are poorly conserved in non-mammalian vertebrates.
Fish Hsd11b3 is orthologous to Xenopus, chicken and human hsd11b3, also referred as hsd11b1-like (Addi-tional file 4). Rainbow trout Hsd11b3 shares 49% and 47% identity with human and Xenopus proteins respec-tively (Fig. 4) while Xenopus and human sequences are 42% identical. Hsd11b proteins possess a superfamily Rossmann-fold NAD(P)H/NAD(P)(+) binding domains composed of a glucose/ribitol dehydrogenase domain and a short chain dehydrogenase domain.
Finally, our phylogenetic analysis clearly demonstrated the orthology relationship of rainbow trout and Xenopus ApoC1 genes [see Additional file 5]. At the amino acid level, rainbow trout and Xenopus sequences share 36% of identity. The trout sequence is 23% identical to the human protein, while Xenopus sequence is 29% identical to the human protein (Fig. 5).
Ovarian expression and tissue distribution of star in rainbow trout and Xenopus
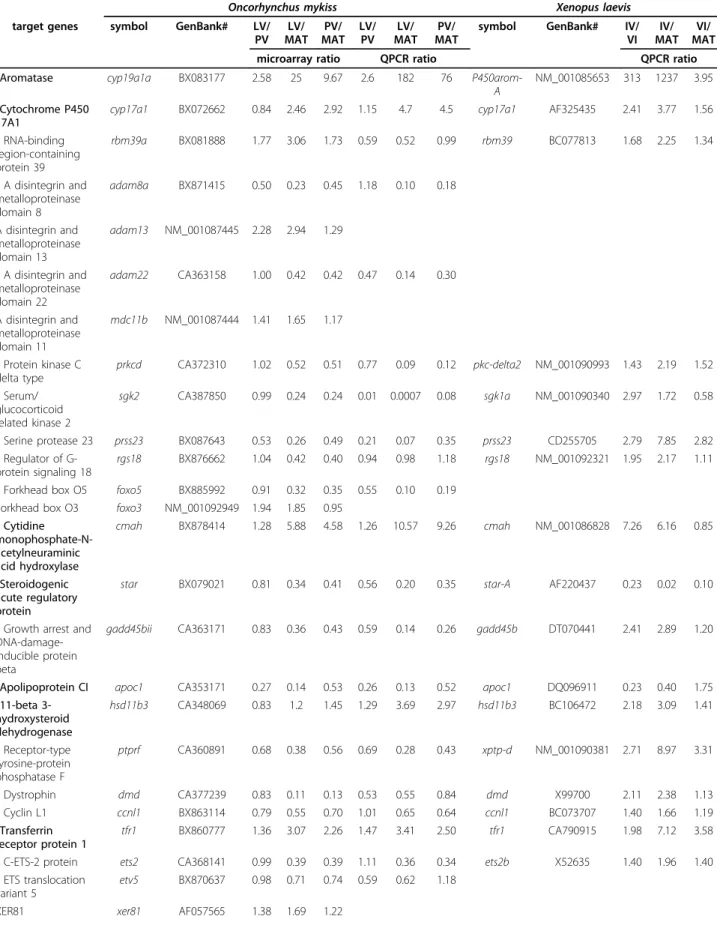
Star mRNA expression shows a progressive increase
during late and/or post-vitellogenesis and a sharp increase during maturation in both species (Fig. 6A and 6B). In rainbow trout, star mRNA abundance is two times higher during post-vitellogenesis than during late vitellogenesis and six times higher during maturation than during late vitellogenesis. In Xenopus laevis, star mRNA abundance is four times higher at prophase I of stage VI and 40 times higher at metaphase II of stage VI, when compared to stage IV follicles. Tissue analysis revealed a predominant expression in gonads of trout and Xenopus (Fig. 6C and 6D). The expression of star in
Xenopus testis was 60 times higher than in ovary. In
contrast, expression of star in trout testis was six times lower than in ovary. Low expression levels were also evi-denced in trout intestine and to a less extent in other tissues. Star mRNA expression was also detected in
Xenopusstomach.
Ovarian expression and tissue distribution of aromatase in rainbow trout and Xenopus
The cytochrome P450 aromatase (cyp19a1a for trout and p450-arom-A for Xenopus) expression shows a dra-matic decrease during late oogenesis in both species (Fig. 7A and 7B). The transcript thus becomes barely detectable in matured follicles of both species. Tissue expression analysis confirms an ovarian-specific expres-sion of the gonad gene (cyp19a1a) for trout (Fig. 7C) with no transcript evidenced in brain. When using pri-mers that do not discriminate ovarian and cerebral aro-matase mRNAs, we detected expression of aroaro-matase mainly in Xenopus brain and ovary (Fig. 7D). The higher expression was detected in the brain and a weaker expression of aromatase mRNA was detected in testis, stomach and intestine.
Ovarian expression and tissue distribution of cyp17a1 in rainbow trout and Xenopus
cyp17a1 expression decreased from late and/or
post-vitellogenesis to the completion of oocyte maturation in both species, but in a slightly different manner (Fig. 8A and 8B). In trout, a significant four time reduction was evidenced only during maturation even if the decrease was initiated earlier, by the end of vitellogenesis. On the other hand, Xenopus cyp17a1 expression decreased sig-nificantly during late/post-vitellogenesis as shown by the
two time mRNA down-expression in oocytes from stage IV to stage VI. Then, the decrease of cyp17a1 was less important and not significantly different in follicles dur-ing oocyte progression from prophase I to metaphase II of meiosis. Tissue analyses showed that its expression was restricted to gonads in both species (Fig. 8C and 8D).
Ovarian expression and tissue distribution of hsd11b3 in rainbow trout and Xenopus
hsd11b3 is nearly three-times less expressed during
maturation than during late vitellogenesis in both trout and Xenopus (Fig. 9A and 9B). In trout, hsd11b3
expression significantly decreased at the time of oocyte maturation like in Xenopus. In the amphibian, the tran-script reduction was already visible during late vitello-genesis but was not significant because of variable
hsd11b3 mRNA levels measured in Xenopus stage IV
follicles from different females. In contrast to the other three gene candidates analyzed above, hsd11b3 was expressed in a more ubiquitous fashion (Fig. 9C and 9D). In trout and Xenopus, hsd11b3 was expressed in brain and intestine. Trout skin mRNA abundance was nine times higher than in the ovary, while no expression of hsd11b3 was detected in Xenopus skin. Moreover no
Figure 3 Cyp17a1 amino acid sequence alignments among vertebrates. Amino acid sequence alignments between human CYP17A1 (ENSG00000148795, H. sapiens), mouse Cyp17a1 (NP_031835.3, M. musculus), chicken CYP17A1 (ENSGALG00000008121 peptide
ENSGALP00000032532, G. gallus), clawed toad Cyp17a1 (AAG42003, X. laevis), zebrafish Cyp17a1 (AAI62669.1, D. rerio) and rainbow trout Cyp17a1 (NP_001118219.1, O. mykiss). Multiple amino acid sequence alignments were constructed using ClustalW software. The conserved domains previously identified are indicated: domain I (heme-binding domain [22]); domain II (putative steroid-binding domain [23]); domain III (CYP17 specific domain [21]). The amino acids that have been evidenced as essential for human CYP17 activity are indicated with asterisks (serine 106, aspartic acid 487, serine 488 and phenylalanine 489) [24,25].
expression of hsd11b3 was detected in trout stomach, muscle, liver and heart while hsd11b3 was expressed in these tissues in Xenopus.
Ovarian expression and tissue distribution of apoC1 in rainbow trout and Xenopus
ApoC1 mRNA level is four times more expressed during post-vitellogenesis than during late vitellogenesis in trout and Xenopus (Fig. 10A and 10B). Moreover, apoC1 expression increases dramatically during oocyte matura-tion in trout, while its expression slightly decreases dur-ing maturation in Xenopus but remains nearly three times higher than during late vitellogenesis. In trout and
Xenopus, apoC1is mainly expressed by the liver and to a less extent, in the intestine, brain, stomach, ovary and testis (Fig. 10C and 10D).
Discussion
Identification of differentially expressed orthologous genes in both species
Among the twenty-six genes studied in the QPCR-based comparative analysis, eight genes had similar expression profiles throughout late oogenesis in both rainbow trout and Xenopus. These results indicate that our strategy which consisted in reanalyzing a transcriptomic study in
Figure 4 hsd11b3 amino acid sequence alignments among vertebrates. Amino acid sequence alignments between human HSD11B3 (ENSP00000340436, H. sapiens), chicken HSD11B3 (NP_001001201.1, G. gallus), clawed toad hsd11b3 (BC106472, X. laevis), zebrafish hsd11b3 (ENSDARG00000004562, D. rerio) and rainbow trout hsd11b3 (CA348069, O. mykiss). Multiple amino acid sequence alignments were constructed using ClustalW software. The superfamily Rossmann-fold NAD(P)H/NAD(P)(+) binding domain is underlined.
Figure 5 apoC1 amino acid sequence alignments among vertebrates. Amino acid sequence alignments between human APOC-I (NP_001636.1, H. sapiens), mouse APOC-I (NP_031495.1, M. musculus), rat APOC-I (NP-036956.1, R. norvegicus), the clawed toad apoC1 (CF547196, X. laevis), tetraodon apoC1 (CAF95503, T. nigroviridis), the gilthead seabream apoc1 (AAT45249.1, S. auratus) and the deduced amino acid sequence of rainbow trout apoC1 (CA353171, O. mykiss). Multiple amino acid sequence alignments were constructed using ClustalW software. The signal peptide is indicated.
one species followed by a subsequent QPCR study in both species is relevant for the identification of ortholo-gous genes that possibly participate in conserved mole-cular mechanisms among the two species. Among the eight genes exhibiting similar profiles in both species, five genes could be linked directly or indirectly to steroi-dogenesis, thus pointing out steroidogenic-related mechanisms as being possibly well conserved among fish and amphibians. Although gene expression of star,
cyp19a1a and cyp17a1 have already been described in
trout during late oogenesis [14,26,27], none of these genes have been described at the mRNA level during this period in Xenopus. Moreover no expression data regarding Hsd11b3 and apoC1 are available in any of the studied species. Due to the predominant role of sex steroids in the control of the reproductive process in tel-eosts and amphibians [2,10], these 5 genes were further studied in the present study.
While our approach has been successful, it should however be pointed out that a significant number of
genes over-expressed during maturation in trout did not exhibit a similar pattern in Xenopus. These differences could be due to species-specific differences or even cor-respond to non-conserved mechanisms. Another possi-ble explanation for the discrepancy between trout and
Xenopus is that in the present study, trout oocyte
maturation occurred naturally in vivo. In contrast, Xeno-pus oocyte maturation was triggered in vitro by a 15-h incubation of isolated fully-grown follicles in medium supplemented with human chorionic gonadotropin (hCG). It is thus possible that the in vitro conditions did not trigger all the mechanisms that are naturally occur-ring in the preovulatory follicle, especially those involved in ovulation. Indeed, even if Xenopus injection of het-erologous gonadotropin can lead to in vivo Xenopus oocyte maturation and ovulation [28], these processes can sometimes be uncoupled in vitro [29]. This could explain, in part, our results.
Finally, in order to identify Xenopus genes related to the trout candidates we used, as a high throughput
-50 100 150 -50 100 150 -50 100 150 50 100 150 200 4 000 6 000 8 000 mR N A a bunda n ce mR N A a bunda n ce Follicular stage mR N A a b unda n ce mR N A a b unda nceB
A
D
C
Follicular stage Br He St Li In Mu Sk Ov Te Br He St Li In Mu Sk Ov Te O. mykiss X. laevis a a b b c c st IV st VI PI st VI Mll st IV st VI PI st VI st IV st VI PI st VI 0 st IV st VI PI st VI st IV st VI PI st VI st IV st VI PI st VI st IV st VI PI st VI 0 1 000 2 000 3 000 4 000 5 000 6 000 st IV st VI PI st VI 0 200 400 600 800 LV PV 0 200 400 600 800 LV PV Mat. # # # # # #Figure 6 star expression profiles during late oogenesis and tissue expression profiles. Expression profiles of star in rainbow trout ovary sampled from females during late vitellogenesis (LV, n = 6), post-vitellogenesis (PV, n = 14) and during maturation (Mat., n = 8) (A), in Xenopus laevis ovarian follicles sampled from six females, at stage IV, stage VI and after in vitro maturation (st VI MII) (B). Expression of star mRNA in rainbow trout tissues: brain (Br), heart (He), stomach (St), liver (Li), intestine (In), muscle (Mu), skin (Sk), post-vitellogenic ovary (Ov), and testis (Te) (C) and in Xenopus laevis tissues: brain (Br), heart (He), stomach (St), liver (Li), intestine (In), muscle (Mu), skin (Sk), ovary (Ov), testis (Te). Data were normalized to the abundance of 18S. Mean and SEM are shown. Bars sharing the same letter(s) are not significantly different (p > 0.05). In tissue, expression levels which are not significantly different from background signal are indicated with #.
100 200 300 400 50 100 150 0 50 100 LV PV 150 LV PV LV PV LV Mat. mR N A a bunda nce Follicular stage mR N A a bunda nce mR N A a bunda nce A B a # # # # # # # # Br He St Li In Mu Sk Ov Te mR N A a bunda nce D C Br He St Li In Mu Sk Ov Te # # # # st IV st VI PI st VI Mll O. mykiss X. laevis a b b 0 50 100 150 0 50 100 150 c c Follicular stage
Figure 7 aromatase expression profiles during late oogenesis and tissue expression profiles. Expression profiles of aromatase (cyp19a1a for trout and p450arom-A for Xenopus) during late oogenesis and in various tissues. Experiments were conducted in parallel for all genes. See fig. 6 legend for details.
50 100 150 50 100 150 0 50 100 150 mR N A a bunda nce Follicular stage mR N A a bunda nce mR N A a bunda nce
A
B
# # # # # # # Br He St Li In Mu Sk Ov Te mR N A a bunda n ceD
C
Br He St Li In Mu Sk Ov Te st IV st VI PI st VI Mll a a a b b b O. mykiss X. laevis 0 50 100 150 LV PV Mat. Follicular stage # # # # # # #Figure 8 cyp17a1 expression profiles during late oogenesis and tissue expression profiles. Expression profiles of cyp17a1 during late oogenesis and in various tissues in rainbow trout and Xenopus. Experiments were conducted in parallel for all genes. See fig. 6 legend for details.
approach, a best blast hit strategy. The orthology rela-tionships between trout and Xenopus cognate proteins were then validated only for the five candidates that we subsequently analyzed. Thus, we cannot totally rule out that a part of the discrepancy between trout and Xeno-pus profiles could be due to a misidentification of true orthologs in Xenopus. This is especially true for adam8a, adam22, foxo5and etv5 genes that will require detailed phylogenic analyses.
Candidate gene analysis
Star. STeroidogenic Acute Regulatory protein
(Star) is involved in cholesterol shuttling across the mitochondrial membrane and its synthesis appears to be a limiting step in steroidogenesis [30-34]. In the present study, star was shown to be predominantly expressed in rainbow trout and Xenopus gonads. These results are in agreement with existing data in various vertebrates including teleosts [19,20,33]. Low expression levels were also detected in trout intestine and in Xenopus stomach. Although star expression has already been reported in rainbow trout intestine [19], no expression has been evi-denced in digestive tract in any other species. While the over-expression during follicular maturation was pre-viously documented in rainbow trout [19,26], we showed for the first time that star is also over-expressed during
hCG-induced oocyte maturation in Xenopus.
Interestingly, star expression is induced in response to gonadotropin stimulation in mammals and birds [30,35-38]. As oocyte maturation is induced in response to LH (Luteinizing Hormone) stimulation in fish and amphibians [2], it is likely that the strong star mRNA over-expression reported here in trout and Xenopus is also triggered by LH-mediated signaling pathway(s). In rainbow trout, it is also noteworthy that the circulating levels of the maturation-inducing steroid (MIS) detected during the preovulatory period [39] increase concomi-tantly with star mRNA levels. Likewise, in Xenopus lae-vis, progesterone and testosterone secretions are more important in stage VI follicles compared to stage IV fol-licles in agreement with star increased expression observed in this study [40]. Together, these results point out the over expression of star by gonadotropin during oocyte maturation as a possible conserved mechanism among non-mammalian vertebrates and possibly all ver-tebrates. The nature of the corresponding protein emphasizes the importance of steroidogenesis in the control of late oogenesis in non-mammalian vertebrates.
Aromatase
Aromatase is an enzyme (CYP19; EC 1.14.14.1) that converts androgens to estrogens. In most species includ-ing humans, chicken, Xenopus and a cartilaginous fish, a single gene has been isolated [41-44]. In contrast, in
1 000 2 000 3 000 4 000 2 000 4 000 6 000 8 000 mR N A a bunda nce mR N A a bunda nce Follicular stage mR N A a b unda nce mR N A a b unda nce
B
A
D
C
Follicular stage Br He St Li In Mu Sk Ov Te Br He St Li In Mu Sk Ov Te a a a a b st IV st VI PI st VI Mll 0 50 100 150 200 0 50 100 150 200 st IV st VI PI st VI b O. mykiss X. laevis 0 50 100 150 LV PV Mat. #Figure 9 hsd11b3 expression profiles during late oogenesis and tissue expression profiles. Expression profiles of hsd11b3 for trout and Xenopus. Experiments were conducted in parallel for all genes. See fig. 6 legend for details.
most teleosts, two genes, cyp19a1a (also referred as
cyp19a or cyp19a1) and cyp19a1b (also referred as
cyp19b or cyp19a2), encode distinct proteins predomi-nantly expressed in the ovary and the brain, respectively [17,45-47]. In the present study, we show that cyp19a1a is only expressed in trout ovary, while p450arom-A is expressed mainly in Xenopus gonads and brain. The lack of cyp19a1a expression in rainbow trout brain is somewhat surprising as cyp19a1a has previously been detected in brain of various fish species [46-49]. The lack of expression of cyp19a1a in trout testis is, in con-trast, in agreement with a previous study carried out in zebrafish [46]. In our study, a weak expression of aro-matase was detected in Xenopus testis. This observation is consistent with a previous study reporting a weak expression but no aromatase activity in Xenopus laevis adult testis [50]. In Xenopus, we evidenced a very low expression in intestine and stomach, thus corroborating studies in human fetus which showed an aromatase expression in intestine [51,52].
The cytochrome P450 aromatase expression decreases dramatically during late oogenesis in both Xenopus and trout resulting in a barely detectable aromatase expres-sion during maturation. Previous studies already indi-cated a decrease of aromatase expression [14,53-57] and
activity [58] as well as a reduction of circulating E2 levels [26,27,39,59] throughout late oogenesis in several fish species. However, we report here for the first time that aromatase transcript expression decreases dramati-cally in Xenopus post-vitellogenic, immature, follicles throughout late oogenesis. This observation is consistent with the decrease of aromatase and E2 production by the ovarian follicle during the post-vitellogenic period [40,60]. Together, these observations suggest that the drop of aromatase mRNA expression in the late ooge-netic follicle is possibly a conserved molecular mechan-ism among non-mammalian vertebrates. In addition, existing data on the inhibition of oocyte maturation by E2 obtained in fish [61] as well as in another amphibian,
Rana pipiens [62,63] suggest that this mechanism of
inhibition of precocious meiosis resumption could con-tribute to oocyte maturational competence acquisition in non-mammalian vertebrates.
Cyp17a1
The cytochrome P450 17A1, for which the official sym-bol is cyp17a1 is a member of the large superfamily of cytochrome P450. This enzyme (CYP17A1; EC = 1.14.99.9) acts as a 17a-hydroxylase and a 17-20-lyase.
The 17a-hydroxylase activity converts progesterone
and pregnenolone to 17a-hydroxyprogesterone and
-1 000 2 000 3 000 4 000 Br He St Li In Mu Sk Ov Te -5 000 30 000 40000 60 000 Br He St Li In Mu Sk Ov Te mRNA abundance mRNA abundance Follicular stage mRNA abundance
A
B
C
D
Follicular stage 0 200 400 600 800 1000 1200 LV PV Mat. mRNA abundance a b c a b c O. mykiss X. laevis # # 0 100 200 300 400 500 600 st IV st VI PI st VI MllFigure 10 apoC1 expression profiles during late oogenesis and tissue expression profiles. Expression profiles of apoC1 for trout and Xenopus. Experiments were conducted in parallel for all genes. See fig. 6 legend for details.
17a-hydroxypregnenolone, respectively while the 17,20-lyase activity converts 17a-hydroxypregnenolone to dehydroepiandrosterone (DHEA) and 17a-hydroxypro-gesterone to androstenedione. DHEA and androstene-dione are precursors of testosterone and estrogen synthesis while 17a-hydroxyprogesterone is a precursor of different progestins and cortisol. In teleosts, two genes have been identified [64]: Cyp17a1 (previously referred as P450-I) and cyp17a2 (previously referred as P450-II). Cyp17a1 encodes a protein exhibiting both activities, as in other vertebrates, whereas cyp17a2 encodes a protein lacking 17,20 lyase activity.
Cyp17a1is expressed in the gonads of both species, consistently with previous data in mammals [65], birds [66], and fish [67,68], including rainbow trout [26,27,69,70] but reported here for the first time in an amphibian species. In a previous study, a strong mRNA expression was also reported in rainbow trout kidney [70]. These authors also detected a low expression in various tissues using semi-quantitative RT-PCR that we were not able to confirm in the present work using QPCR. In both species, ovarian mRNA levels decrease dramatically throughout late oogenesis. In rainbow trout, the cyp17a1 profile was previously been documen-ted [26,27] and found to be consistent with previous Northern blot data indicating that cyp17a1 was abun-dant in the post-vitellogenic ovary as a result of an increase of expression that occurred during vitellogen-esis [69]. Moreover, it has been shown in tilapia that cyp17a1 expression in granulosa cells decreases during late oogenesis, while cyp17a2 expression increases [64]. It should be however noticed that cyp17a1 expression during late oogenesis can be variable depending on the species [67,71]. Nevertheless, a low cyp17a1 mRNA expression was also reported in female fat head minnow close to full sexual maturity [68] and in two catfish populations, cyp17 mRNA level was shown to decrease throughout the period of spawning [55]. In rat, both
cyp17a1 mRNA and protein abundance increase
throughout folliculogenesis and subsequently decrease after hCG stimulation of preovulatory follicles [72]. Similarly, cyp17a1 mRNA expression decreased after LH surge in bovine preovulatory follicles [73]. Consistent with these observations was the report of a decrease of
cyp17a1 mRNA expression in follicular layers of the
preovulatory chicken follicles [56,74]. Together, existing and present observations suggest that even though spe-cies-specificity may exist, the decrease of cyp17a1 mRNA expression towards the end of oogenesis may be a well conserved molecular mechanism, possibly related to maturational competence acquisition. Indeed, Cyp17a1 could participate in the shift from E2 to maturation-inducing steroid production observed in fish and amphibians during late oogenesis [40,75]. In
addition, Cyp17a1 could also participate in the produc-tion of androgens that have been evidenced to play important roles during late oogenesis in both amphi-bians and fish [76-78].
Hsd11b3
The 11beta-hydroxysteroid dehydrogenase isoenzymes HSD11B mainly catalyze the interconversion of active glucocorticoid (cortisol and corticosterone) and inactive 11-keto forms (cortisone and 11-dehydrocorticosterone) [79]. Three proteins have been described in mammals: HSD11B1, HSD11B2 and HSD11B3 (previously known as HSD11B1like or HSD11B1L). Previous analyses have indicated that hsd11b1 was not present in teleost species [80] and could only be found in amphibians, birds and mammals. In fish, Hsd11b2 has been characterized and shown to be expressed in various tissues such as gill, heart, intestine, ovary, testis and skin [79] and studied in more details in the ovary during late oogenesis [79,81]. Interestingly, hsd11b3 was phylogenetically char-acterized [80] but no expression data was available to date in fish and amphibians. In the present study, we show that hsd11b3 mRNA is expressed in a large num-ber of tissues but not in Xenopus skin while it is expressed mainly in brain, skin and intestine in trout. Thus, rainbow trout hsd11b3 mRNA appears to have a more restricted tissue distribution than hsd11b2 and tis-sue expression differs greatly between trout and Xeno-pus. Within the ovary, we evidence a decrease of hsd11b3 transcript level throughout late oogenesis in both rainbow trout and Xenopus whereas hsd11b2 mRNA has been reported to accumulate at the same time in trout female gonad [79,81].
At the functional level, HSD11B2 acts in mammals as a reductase and converts inactive cortisone to active cortisol. In fish, this isoform is also able to convert 11b hydroxy-testosterone into 11keto-testosterone (11-KT), which has been shown to be a major androgen steroid in fish [82]. In contrast, mammalian HSD11B1 predomi-nantly acts in an opposite way, as likely does HSD11B3 according to the evolutionary history of the protein [80], since no functional study has been reported on this iso-form. Likewise, fish Hsd11b3 is likely to act as the mam-malian HSD11B1 and/or HSD11B3 (Additional file 4). Together, the expression profiles of hsd11b2 [79,81] and hsd11b3(present results) in the rainbow trout preovula-tory ovary suggest a combined role of these enzymes in gonad protection against any deleterious effect of stress-induced cortisol. Despite the lack of data on glucocorti-coid levels and effects during oogenesis in amphibians, we may also hypothesize a similar role of Hsd11b3 dur-ing Xenopus late oogenesis. We cannot totally rule out a role of Hsd11b3 in regulating 11 ketotestosterone levels during follicular development and oocyte growth. Indeed, 11KT, besides its well-known action in fish
spermatogenesis, has been demonstrated as controlling oocyte growth, likely through lipid accumulation in eel [83] and in atlantic cod [84]. However, this cannot be extended to all teleosts as 11KT circulating levels are low or even undetectable in salmonid females [85-87]. Further investigations including protein expression and enzyme activity measurements are thus required to con-clude on the exact physiological role(s) of these 11beta-hydroxysteroid dehydrogenase isoenzymes in ovarian functions during late oogenesis.
ApoC1
The apolipoprotein C1 belongs to the family of soluble apolipoproteins involved in cholesterol transport and uptake in vertebrates [88]. Interestingly, in vitro studies have also suggested that apoC1 could stimulate lecithin-cholesterol acyltransferase (LCAT) activity [89], thereby increasing the formation of esterified cholesterol as well as estradiol ester. In the present study, the tissue expres-sion analysis reveals that apoC1 is primarily expressed in trout and Xenopus liver, but also in stomach, intestine and gonad. This result is consistent with previous studies performed in mammals [90-92] and in another teleost,
Hemibarbus mylodon[93]. Only in the orange-spotted
grouper, apoC1 could not be detected in the liver but it was nonetheless expressed in gonad and in brain [94].
Within the ovary, we show that apoC1 mRNA levels dramatically increase during late oogenesis in trout and Xenopus. This result confirms previous findings in trout [14] and in orange-spotted grouper [94]; only Tingaud-sequeira et al. recently published in a marine flatfish ovary a different pattern of apoC1 expression, where its transcript levels significantly increase solely during folli-cle atresia following ovulation but not during follifolli-cle growth or maturation [95]. This study is also the first report on apoC1 expression in an amphibian. In mam-mals, ApoC1 expression in ovary during follicle develop-ment has not been studied to our knowledge but the increase of LCAT activity, correlated with a decrease of estradiol/progesterone ratio in antrum of human growing ovarian follicles [96] may indirectly reflect an increase of apoC1 expression. The function of ApoC1, accumulating during late oogenesis, remains to be elucidated. First, this apolipoprotein may have a role in remaining yolk degra-dation by the oocyte companion cells during follicle atre-sia [95] or yolk degradation as a nutrient source for early embryo development [94]. ApoC1 could also be involved in the regulation of steroidogenesis at least in two ways: (i) as an inhibitor of lipoprotein uptake via inhibition of lipoprotein binding to their receptors [97]; it may then modulate the ovarian cholesterol uptake during oogen-esis; (ii) cholestryl and estradiol esters, formed upon LCAT activation by apoC1 [98], remain a source of bioactive metabolites in the steroid synthesis pathways. Interestingly, estradiol esters may also be involved in
antioxydation processes [99]. Further studies will be required to fully understand the role(s) of ApoC1 during ovarian follicle development in vertebrates.
Conclusions
In the present study, we successfully used a QPCR-based comparative analysis to identify genes that are dif-ferentially expressed during both rainbow trout and Xenopuslate oogenesis. Our observations point out sev-eral molecular mechanisms as possibly conserved among non-mammalian vertebrates. As an attempt to further characterize some of these mechanisms, we have charac-terized the sequence of some candidate proteins and thoroughly studied their mRNA expression in various tissues and during post-vitellogenesis in the two studied species. Our data show that the expression profiles of key steroidogenic enzymes are conserved during late oogenesis in Xenopus laevis ovarian follicles in agree-ment with existing data in rainbow trout. We indeed evidenced a decrease of the mRNA levels of cyp19a1 and cyp17a1 in both species and for the first time in an amphibian species. These expression patterns are consis-tent with the shift in steroidogenesis of ovarian follicles observed in both amphibians and teleost fish prior to meiosis resumption and could correspond to an impor-tant molecular mechanism of oocyte maturational com-petence acquisition common to these non-mammalian vertebrate groups. In contrast, the levels of star mRNA increase during oocyte maturation in both species. The nature of Star protein further stresses the importance of steroidogenesis in the post-vitellogenic process. The timing of star over-expression suggests, however, that Star would not be involved only in maturational compe-tence acquisition but also in further follicular processes (e.g. ovulation) possibly through an increase of matura-tion-inducing steroid (MIS) synthesis. In addition, the decrease in hsd11b3 mRNA expression observed in both species throughout late oogenesis raises the question of the physiological role of this protein that will require further attention. Finally, the observed increase in
apoC1 expression may be related to different
mechan-isms as steroidogenesis regulation through modulation of cholesterol uptake or through regulation of choles-teryl or estradiol esters synthesis. This increased expres-sion may also be linked to yolk processing in the oocyte during late oogenesis or during early embryo develop-ment. The characterization of the function of this gene during late oogenesis requires however further investiga-tion. Finally, other genes not related to steroidogenesis were also shown to have similar expression profiles in both species during late oogenesis. The identity of the proteins points out possibly conserved non-steroido-genic mechanisms that deserve future attention and spe-cific investigations.
Together, our results strongly suggest that compara-tive transcriptomics is an extremely valuable approach that must be pursued to gain insight in the conserved mechanisms underlying maturational and developmental competence acquisition in non-mammalian vertebrates. Methods
Animals and Tissue Collections
Investigations and animal care were conducted in com-pliance with French and European regulation on the care and use of laboratory animals. Twenty eight adult rainbow trout females (Oncorhynchus mykiss) from an autumn-spawning strain were obtained at different stages of ovarian development from the INRA/PEIMA fish farm (Sizun, France). Ovaries were sampled during late vitellogenesis (LV, 3 or 4 weeks before expected spawning, n = 6), in post-vitellogenesis (PV, before oocyte maturation but during spawning period, n = 14) and during maturation (Mat., n = 8). Thirteen of these twenty eight females had previously been used for tran-scriptomic analysis [14]. For sampling, fish were deeply anaesthetised in 0,1% (v/v) 2-phenoxyethanol in water and killed. Trout ovaries were then dissected out of the body cavity under sterile conditions.
Ovarian pieces were surgically removed from six Xenopus anaesthetised adult females (Xenopus laevis), purchased from NASCO (Fort Atkinson, WI, USA). 100 Xenopusstage IV (st IV, 800-μm diameter) and 50 stage VI (st VI PI, 1200-μm diameter, in prophase I of meio-sis) ovarian follicles [11] were manually isolated from ovarian pieces of each female. In order to obtain follicle-enclosed oocytes in metaphase II of meiosis (st VI MII) from the same females, in vitro maturation was per-formed by incubating 50 immature stage VI follicles for 15 h at room temperature in OR2 buffer (83 mM NaCl,
2.5 mM KCl, 1 mM CaCl2, 1 mM MgCl2, 1 mM
Na2HPO4, 5 mM HEPES, pH 7.4) supplemented with 40 IU/mL of hCG (Organon, Puteaux, France). After the incubation period, germinal vesicle breakdown (GVBD) was assessed by direct observation under a stereomicro-scope of the appearance of a white spot on the animal pole of the follicle-enclosed oocytes.
For tissue collection, three Xenopus adult females were sacrificed and different tissues (brain, heart, stomach, liver, intestine, muscle, skin, and ovary) were collected in addition to stage IV and VI follicles. The same tissues were also sampled from three different post-vitellogenic rainbow trout females. Trout testis samples were obtained from four different males at stage II (initiation of spermatogenesis) and stage V (spermiogenesis) whereas Xenopus testis samples were obtained from one male. Tissue samples were frozen in liquid nitrogen and stored at -80°C until RNA extraction.
Microarray data analysis
Microarray data obtained from previous hybridization [14] were further reanalyzed. The rainbow trout generic array has been previously deposited in Gene Expression Omnibus (GEO) database (Platform# GPL 3650; GEO accession GSE4871) [100]. In order to identify differen-tially expressed genes, a statistical analysis was carried out using Significance Analysis of Microarray (SAM) test [101]. Three 2-by-2 statistical analyses were per-formed in order to compare each group with the two other ones. For each comparison, 5% of false discovery rate (FDR) was used to statistically discriminate differen-tially expressed genes. For clustering analysis, data were log2-transformed, median-centered, and an average link-age clustering was performed using CLUSTER software. Clusters were visualized using TREEVIEW software [102]. Gene Ontology (GO) analyses were performed using the NIH-DAVID web-based tool (Database for Annotation, Visualization, and Integrated Discovery) [103-105]. Enrichment analyses were realized using all the annotated genes present on the microarray (8 344 genes) as a reference and using UNIPROT accession IDs as input. Enriched GO biological process terms associated with each gene list were determined using modified Fisher’s exact tests. GO terms with a raw p-value lower than 0.05 are displayed [see additional files 1 and 2]. The number of genes associated with each GO term and associated enrichment information (raw p-values and fold enrichment) are indicated for each GO term.
Data mining and sequence analysis
For all the clones identified as differentially abundant after the SAM analysis (Table 2), the official gene sym-bol was retrieved [14,106,107] when possible and used in the text, figures and tables. The official Danio rerio gene symbol was used for the rainbow trout. Rainbow trout cDNA clones and corresponding IMAGE Xenopus clones were fully sequenced in both directions with the “PRISM* Ready Reaction Big Dye* Terminator cycle Sequencing Kit” and an automated ABI 310 sequencer (PE Biosystems, Courtaboeuf, France), as recommended by the manufacturer. Multiple amino acid sequence alignments were constructed using ClustalW software [108].
Phylogenetic analysis
In order to identify orthologous genes, phylogenetic ana-lysis of studied genes was done using the FIGENIX phy-logenomic analysis pipeline [109]. FIGENIX allows sequences retrieval, multiple sequence alignments, phy-logenetic reconstruction and orthology and paralogy relationships deductions. The phylogenomic task was run using either trout or Xenopus amino acid sequence as a query, with the default parameters, and using
Ensembl and NCBI-nr databases with search limited to mammals, chicken, Xenopus and fish.
RNA extraction, reverse Transcription and Real-Time PCR analysis
RNA extraction and reverse transcription were per-formed as previously described for rainbow trout [14]. For Xenopus, 5μg of total RNA were reverse transcribed using 200 units of SuperScript™ reverse transcriptase (Invitrogen, Cergy Pontoise, France) and 250 ng random hexamers (Promega) in a reverse transcription master mix containing 2 mM dNTPs, 50 mM Tris-HCl, 75 mM KCl, 3 mM MgCl2, 10 mM dithiothreitol, pH 8.3. Twenty-five units of RNase inhibitor (RNasin, Promega) were added to the reaction. RNA and dNTPs were dena-tured for 5 min at 65°C, and then chilled on ice before addition of reverse transcription master mix. Reverse transcription was performed at 25°C for 10 min then at 42°C for 50 min followed by a 15-min incubation step at 70°C. For both species, control reactions were run without reverse transcriptase and used as negative con-trols in the real-time polymerase chain reaction (PCR) study for all target genes.
QPCR was done using a real-time PCR system Step One Plus (Applied Biosystems, Foster City, USA). Reverse transcription products were diluted to 1/25 for trout and 1/20 for Xenopus. Triplicates were run for each RT product. Real-time PCR was performed using a real-time PCR kit provided with a SYBR Green fluoro-phore (Fast SYBR Green Master Mix, Applied Biosys-tem). Primer concentrations were 240 nM for 18S and 600 nM for all other genes. The hot start enzyme was activated 20 seconds at 95°C, then the amplification was carried out using the following cycle: 95°C for 3 sec; 60° C for 30 sec; 40 times. A pool of reverse transcribed RNA was serially diluted and used to calculate a stan-dard curve. For all studied genes, 18S was used as an internal standard to normalize the signal. After amplifi-cation, a fusion curve was obtained according to the fol-lowing protocol: 10 sec holding followed by a 0.05°C increase, repeated 80 times, and starting at 55°C. Primer sequences of studied genes are presented in supplemen-tary data files (see additional file 6 for trout; see addi-tional file 7 for Xenopus). The control reactions were used to calculate background expression level for each gene in order to evidence the tissues exhibiting expres-sion levels significantly above background. Statistical analyses were performed using Statistica 7.0 software (Statsoft, Tulsa, OK). Regarding trout and Xenopus data, differences between groups were analyzed using non parametric U Mann-Whitney test and paired samples Wilcoxon test, respectively.
Additional file 1: Biological process enrichments of cluster 1 (= genes down-regulated during maturation). Gene Ontology functional annotations and biological process term enrichments were performed using the DAVID web-based tool (Database for Annotation, Visualization, and Integrated Discovery) [103104105]. Enrichment analyses were performed using all the annotated genes present on the microarray (8 344 genes) as the reference and using UNIPROT accession IDs as input for the differentially expressed genes. Enriched GO biological process terms associated with each gene list were determined using modified Fisher’s exact tests. GO terms with a raw p-value lower than 0.05 are presented. The number of genes associated with each GO term and associated enrichment information (raw p-values, fold enrichment) are indicated for each GO term. Data are sorted by decreasing enrichment fold values.
Click here for file
[ http://www.biomedcentral.com/content/supplementary/1471-2164-11-18-S1.XLS ]
Additional file 2: Biological process enrichments of cluster 2 (= genes up-regulated during maturation). Gene Ontology functional annotations and biological process term enrichments were performed using the DAVID web-based tool (Database for Annotation, Visualization, and Integrated Discovery) [103104105]. Enrichment analyses were performed using all the annotated genes present on the microarray (8 344 genes) as the reference and using UNIPROT accession IDs as input for the differentially expressed genes. Enriched GO biological process terms associated with each gene list were determined using modified Fisher’s exact tests. GO terms with a raw p-value lower than 0.05 are presented. The number of genes associated with each GO term and associated enrichment information (raw p-values, fold enrichment) are indicated for each GO term. Data are sorted by decreasing enrichment fold values.
Click here for file
[ http://www.biomedcentral.com/content/supplementary/1471-2164-11-18-S2.XLS ]
Additional file 3: Phylogeny of cyp17a1 in vertebrates including fish. This npl tree is the fusion of neighbour joining (n), maximum parsimony (p), and maximum likelihood (l) trees calculated with the FIGENIX automated phylogenomic annotation pipeline [109]. The task was run using the Xenopus amino-acid sequence as a query. Protein sequence accession numbers for each species are given under brackets on the right of the figure. Evolutionary distances among sequences are represented by the tree structure, where branch length represents evolutionary distance. For each node, bootstrap values are reported for each npl method. Bootstrapping was carried out using 100 replications. Click here for file
[ http://www.biomedcentral.com/content/supplementary/1471-2164-11-18-S3.PDF ]
Additional file 4: Phylogeny of hsd11b3 in vertebrates including fish. This npl tree is the fusion of neighbour joining (n), maximum parsimony (p), and maximum likelihood (l) trees calculated with the FIGENIX automated phylogenomic annotation pipeline [109]. Protein sequence accession numbers for each species are given under brackets on the right of the figure. Evolutionary distances among sequences are represented by the tree structure, where branch length represents evolutionary distance. For each node, bootstrap values are reported for each npl method. Bootstrapping was carried out using 100 replications. The task was run using the rainbow trout amino-acid sequence as a query.
Click here for file
[ http://www.biomedcentral.com/content/supplementary/1471-2164-11-18-S4.PDF ]
Additional file 5: Phylogeny of apoC1 in vertebrates including fish. This npl tree is the fusion of neighbour joining (n), maximum parsimony (p), and maximum likelihood (l) trees calculated with the FIGENIX automated phylogenomic annotation pipeline [109]. Protein sequence accession numbers for each species are given under brackets on the
right of the figure. Evolutionary distances among sequences are represented by the tree structure, where branch length represents evolutionary distance. For each node, bootstrap values are reported for each npl method. Bootstrapping was carried out using 100 replications. The task was run using the Xenopus amino-acid sequence as a query. Click here for file
[ http://www.biomedcentral.com/content/supplementary/1471-2164-11-18-S5.PDF ]
Additional file 6: Primers used for the QPCR study in Oncorhynchus mykiss. For each target gene, full name, symbol, GenBank accession number and primers sequences are indicated.
Click here for file
[ http://www.biomedcentral.com/content/supplementary/1471-2164-11-18-S6.PDF ]
Additional file 7: Primers used for the QPCR study in Xenopus laevis. For each target gene, full name, symbol GenBank accession number and primers sequences are indicated.
Click here for file
[ http://www.biomedcentral.com/content/supplementary/1471-2164-11-18-S7.PDF ]
Acknowledgements
This work was funded by ANR-08-GENM-033 (OSCILE). The authors thank Jerome Montfort from INRA UR1037 genomic facility and Marc Aubry from the Transcriptomic Biogenouest® platform for their support and advices in data analysis. The authors also thank Alexis Fostier (INRA UR1037) for helpful discussion and Thaovi Nguyen (INRA UR1037) for technical assistance. The authors are grateful to Stephane Dreano (CNRS UMR6061) for sequencing support. The authors also thank all INRA and CNRS experimental facility personnel (Sizun and Rennes) for animal care.
Author details
1
CNRS/IGDR (UMR 6061), IFR140 GFAS, Université de Rennes I, 2, Avenue du Pr. Léon Bernard, 35043 Rennes Cedex, France.2Institut National de la
Recherche Agronomique, INRA SCRIBE, UR1037, IFR140 GFAS, Campus de Beaulieu, 35000 Rennes Cedex, France.
Authors’ contributions
MG performed the microarray data analyses, real-time PCR experimentations, and drafted the manuscript. MG and FC extracted Xenopus RNA while JB extracted trout RNA. FC and JB designed and supervised the study, participated in the analyses and candidates selection and in the writing of the manuscript. All authors read and approved the final manuscript. Received: 8 July 2009
Accepted: 8 January 2010 Published: 8 January 2010 References
1. Bobe J, Nguyen T, Fostier A: Ovarian function of the trout preovulatory ovary: new insights from recent gene expression studies. Comp Biochem Physiol A Mol Integr Physiol 2009, 153:63-68.
2. Jalabert B, Fostier A, Breton B, Weil C: Oocyte Maturation in Vertebrates. Vertebrate Endocrinology, Fundamentals and Biomedical Implications New York: Academic PressPang P, Schreibman M 1991, 4:23-90.
3. Yamashita M: Molecular mechanisms of meiotic maturation and arrest in fish and amphibian oocytes. Seminars in Cell & Developmental Biology 1998, 9:569-579.
4. Jamnongjit M, Hammes SR: Oocyte maturation: the coming of age of a germ cell. Semin Reprod Med 2005, 23:234-241.
5. Pelegri F: Maternal factors in zebrafish development. Dev Dyn 2003, 228:535-554.
6. Mtango NR, Potireddy S, Latham KE: Oocyte quality and maternal control of development. Int Rev Cell Mol Biol 2008, 268:223-290.
7. Matzuk MM, Burns KH, Viveiros MM, Eppig JJ: Intercellular communication in the mammalian ovary: oocytes carry the conversation. Science 2002, 296:2178-2180.
8. Jalabert B: Particularities of reproduction and oogenesis in teleost fish compared to mammals. Reprod Nutr Dev 2005, 45:261-279.
9. Jalabert B, Breton B, Bry C: Maturation and ovulation in vitro of rainbow trout Salmo gairdnerii ovocytes. Comptes Rendus de l’Académie des Sciences Paris 1972, 275:1139-42.
10. Rasar MA, Hammes SR: The physiology of the Xenopus laevis ovary. Methods Mol Biol 2006, 322:17-30.
11. Dumont JN: Oogenesis in Xenopus laevis (Daudin). I. Stages of oocyte development in laboratory maintained animals. J Morphol 1972, 136:153-179.
12. Lubzens E, Young G, Bobe J, Cerda J: Oogenesis in teleosts: how fish eggs are formed. Gen Comp Endocrinol 2009.
13. Jalabert B: In vitro oocyte maturation and ovulation in rainbow trout (Salmo gairdneri), northern pike (Esox lucius), and goldfish (Carassius auratus). Journal of Fisheries Research Board of Canada 1976, 33:974-988. 14. Bobe J, Montfort J, Nguyen T, Fostier A: Identification of new participants
in the rainbow trout (Oncorhynchus mykiss) oocyte maturation and ovulation processes using cDNA microarrays. Reprod Biol Endocrinol 2006, 4:39.
15. Yoshizaki G, Patino R, Thomas P: Connexin messenger ribonucleic acids in the ovary of Atlantic croaker: molecular cloning and characterization, hormonal control, and correlation with appearance of oocyte maturational competence. Biol Reprod 1994, 51:493-503.
16. Eo J, Han K, Murphy M, Song H, Lim HJ: Etv5, an ETS transcription factor, is expressed in granulosa and cumulus cells and serves as a
transcriptional regulator of the cyclooxygenase-2. J Endocrinol 2008, 198:281-290.
17. Tanaka M, Telecky TM, Fukada S, Adachi S, Chen S, Nagahama Y: Cloning and sequence analysis of the cDNA encoding P-450 aromatase (P450arom) from a rainbow trout (Oncorhynchus mykiss) ovary; relationship between the amount of P450arom mRNA and the production of oestradiol-17 beta in the ovary. J Mol Endocrinol 1992, 8:53-61.
18. Castro LF, Santos MM, Reis-Henriques MA: The genomic environment around the Aromatase gene: evolutionary insights. BMC Evol Biol 2005, 5:43.
19. Kusakabe M, Todo T, McQuillan HJ, Goetz FW, Young G: Characterization and expression of steroidogenic acute regulatory protein and MLN64 cDNAs in trout. Endocrinology 2002, 143:2062-2070.
20. Bauer MP, Bridgham JT, Langenau DM, Johnson AL, Goetz FW:
Conservation of steroidogenic acute regulatory (StAR) protein structure and expression in vertebrates. Mol Cell Endocrinol 2000, 168:119-125. 21. Ono H, Iwasaki M, Sakamoto N, Mizuno S: cDNA cloning and sequence
analysis of a chicken gene expressed during the gonadal development and homologous to mammalian cytochrome P-450c17. Gene 1988, 66:77-85.
22. Gotoh O, Tagashira Y, Iizuka T, Fujii-Kuriyama Y: Structural characteristics of cytochrome P-450. Possible location of the heme-binding cysteine in determined amino-acid sequences. J Biochem 1983, 93:807-817. 23. Ozols J, Heinemann FS, Johnson EF: Amino acid sequence of an
analogous peptide from two forms of cytochrome P-450. J Biol Chem 1981, 256:11405-11408.
24. Fardella CE, Zhang LH, Mahachoklertwattana P, Lin D, Miller WL: Deletion of amino acids Asp487-Ser488-Phe489 in human cytochrome P450c17 causes severe 17 alpha-hydroxylase deficiency. J Clin Endocrinol Metab 1993, 77:489-493.
25. Lin D, Black SM, Nagahama Y, Miller WL: Steroid 17 alpha-hydroxylase and 17,20-lyase activities of P450c17: contributions of serine106 and P450 reductase. Endocrinology 1993, 132:2498-2506.
26. Bobe J, Nguyen T, Jalabert B: Targeted Gene Expression Profiling in the Rainbow Trout (Oncorhynchus mykiss) Ovary During Maturational Competence Acquisition and Oocyte Maturation. Biol Reprod 2004, 71:73-82.
27. Nakamura I, Evans JC, Kusakabe M, Nagahama Y, Young G: Changes in steroidogenic enzyme and steroidogenic acute regulatory protein messenger RNAs in ovarian follicles during ovarian development of rainbow trout (Oncorhynchus mykiss). Gen Comp Endocrinol 2005, 144:224-231.
28. Reynhout JK, Taddei C, Smith LD, LaMarca MJ: Response of large oocytes of Xenopus laevis to progesterone in vitro in relation to oocyte size and time after previous HCG-induced ovulation. Dev Biol 1975, 44:375-379.