A COMPARISON OF FATIGUE CRACK PROPAGATION IN INCONEL 625 AND 3.25 Ni STEEL
BY
THOMAS ALBERT LONG, JR.
LIEUTENANT COMMANDER, UNITED STATES NAVY B.S., UNITED STATES NAVAL ACADEMY
(1959)
SUBMITTED IN PARTIAL FULFILLMENT OF THE REQUIREMENTS FOR THE DEGREE OF
OCEAN ENGINEER AND THE DEGREE OF
MASTER OF SCIENCE IN NAVAL ARCHITECTURE AND MARINE ENGINEERING AT THE
MASSACHUSETTS INSTITUTE OF TECHNOLOGY JUNE, 1972
Signature redacted
SIGNATURE OF AUTHOR: CERTIFIED BY: CERTIFIED BY: ACCEPTED BY:Department of 4'en Engirn'erfng, May 12, 1972
Thesis Supervisor
Signature redacted
Departmental ReaderSignature redacted
Chai n, DepartmentalStu
ts
Archives
Stunts ~ INST. CJUN
28
197
f
ommittee on GraduateA COMPARISON OF FATIGUE CRACK PROPAGATION IN INCONEL 625 AND 3.25 Ni STEEL
BY
THOMAS ALBERT LONG, JR.
Submitted to the Department of Ocean Engineering on May 12, 1972, in partial fulfillment of the requirements for the Master of Science
degree in Naval Architecture and Marine Engineering and the Professional Degree, Ocean Engineer.
ABSTRACT
The United States Navy is interested in determining the feasibility of replacing the presently used copper-nickel stern tube and strut bear-ing sleeves on ship propeller shafts with a weld overlay of Inconel 625. This thesis investigates the suitability of an Inconel 625 weld overlay from the standpoint of fatigue crack growth resistance.
It is now well known that microcracks can appear very early in the life of a structure subjected to fatigue, although they may grow very slowly in their early stages of life. The practical importance of this crack growth period is emphasized by the fact that in welded components, it is virtually impossible to produce material that is completely free of defects which may be the site of future fatigue cracks.
In this study, the fatigue crack growth rates of Inconel 625 weld metal, Inconel 625 annealed plate and Navy specification Class 2 shaft steel were compared in air and artificial sea water. The results indi-cate that, from a fatigue crack growth standpoint, Inconel 625 weld metal is a satisfactory material, though application processes should be investigated to optimize grain structure.
THESIS SUPERVISOR: R. M. PELLOUX
TITLE: ASSOCIATE PROFESSOR, DEPARTMENT OF METALLURGY AND MATERIALS SCIENCE
ACKNOWLEDGEMENTS
I would like to thank the United States Navy for sponsoring my studies at MIT and specifically NAVSHIPS Code 03412 for providing the money for this project. Also I would like to thank NAVSHIPS Code 03422
for funding my summer assignment at the Naval Ship Research and Develop-ment Center, Annapolis Laboratory which formulated my interest in the
subject. I would especially like to thank Messers Joseph Crisci and Charles Zanis of NSRDC, Annapolis for the fine experience I received during my summer there and for their later help and encouragement,
money and material. I which to thank Mr. Frank Zaher, NAVSEC Code 6148C for impetus and assistance on the project and the Huntington Alloys Division of The International Nickel Company for providing material and technical assistance. My appreciation goes also to Mr. Arthur Rudolph of MIT for his assistance in cutting the overlayed steel into manageable
pieces. I would like to thank my thesis supervisor, Professor R.M. Pelloux for guiding my work and providing financial assistance and also
research staff member, Mr. Claude Bathias for his help and direction. I would also like to express my gratitude to my thesis reader, Professor K. Masubuchi for providing helpful financial assistance. Last, but certainly not least, I would like to thank my wife who provided for my
logistic support during the writing of this work and who also drew the diagrams contained herein.
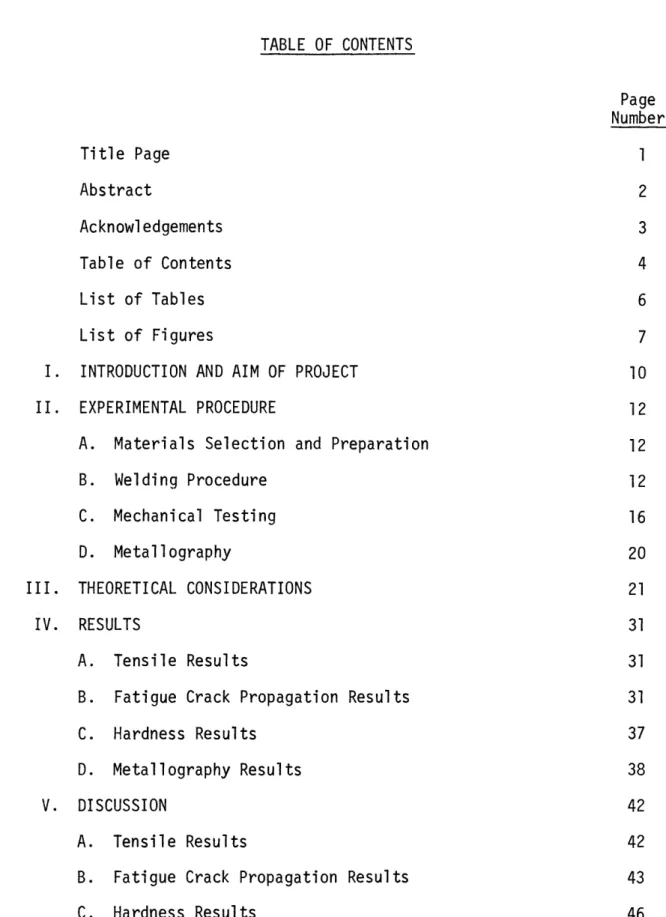
TABLE OF CONTENTS Page Number Title Page 1 Abstract 2 Acknowledgements 3 Table of Contents 4 List of Tables 6 List of Figures 7
I. INTRODUCTION AND AIM OF PROJECT 10
II. EXPERIMENTAL PROCEDURE 12
A. Materials Selection and Preparation 12
B. Welding Procedure 12
C. Mechanical Testing 16
D. Metallography 20
III. THEORETICAL CONSIDERATIONS 21
IV. RESULTS 31
A. Tensile Results 31
B. Fatigue Crack Propagation Results 31
C. Hardness Results 37
D. Metallography Results 38
V. DISCUSSION 42
A. Tensile Results 42
B. Fatigue Crack Propagation Results 43
VI. SUMMARY AND CONCLUSIONS VII. RECOMMENDATIONS VIII. REFERENCES IX. TABLES X. FIGURES Page Number 49 53 55 59 61
6
LIST OF TABLES
Page Number
59 Chemical and Mechanical Properties
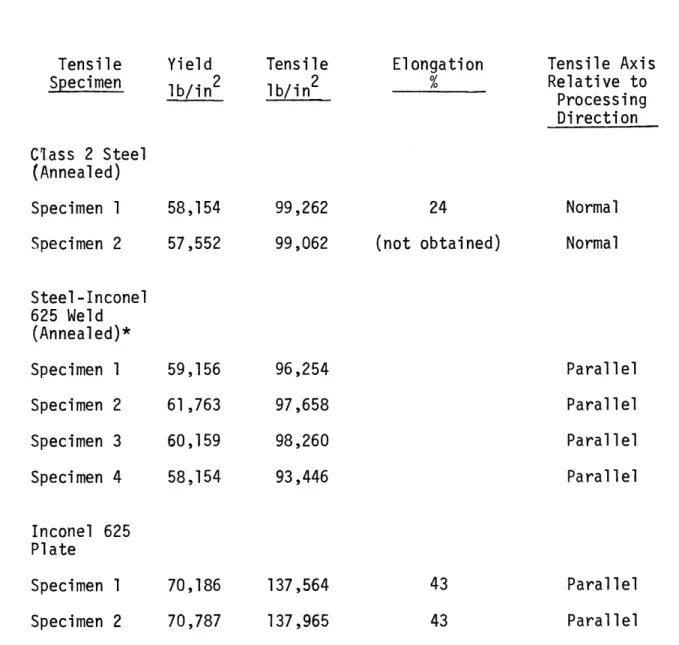
Tensile Test Results 60
Table Number
I II
LIST OF FIGURES
Figure Page
Number Number
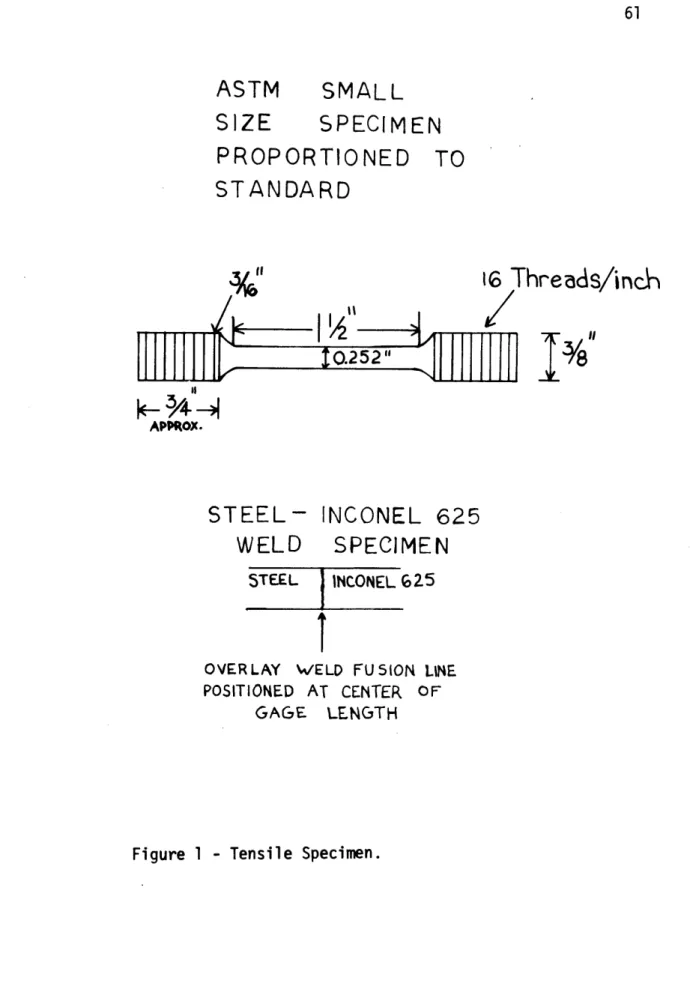
1 Tensile Specimen 61
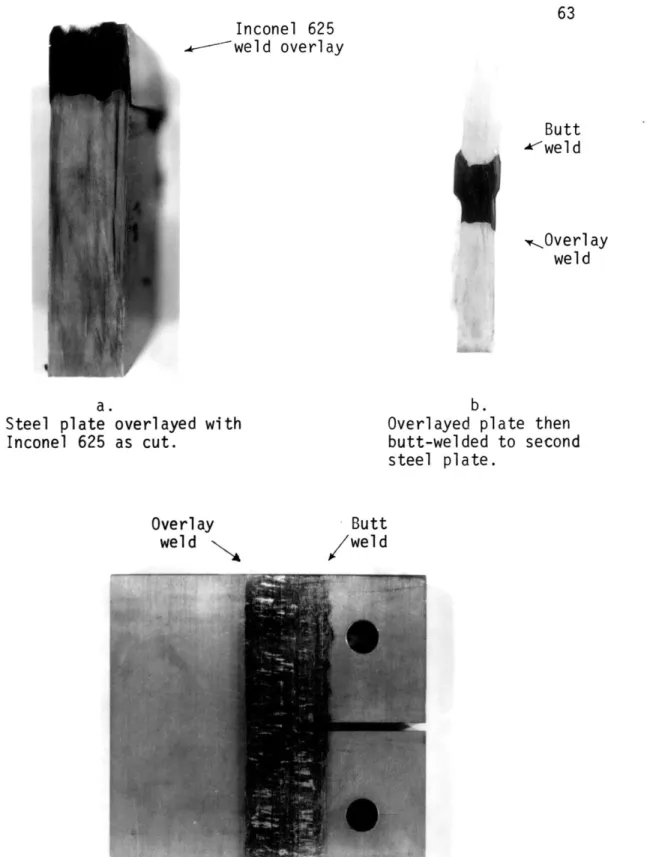
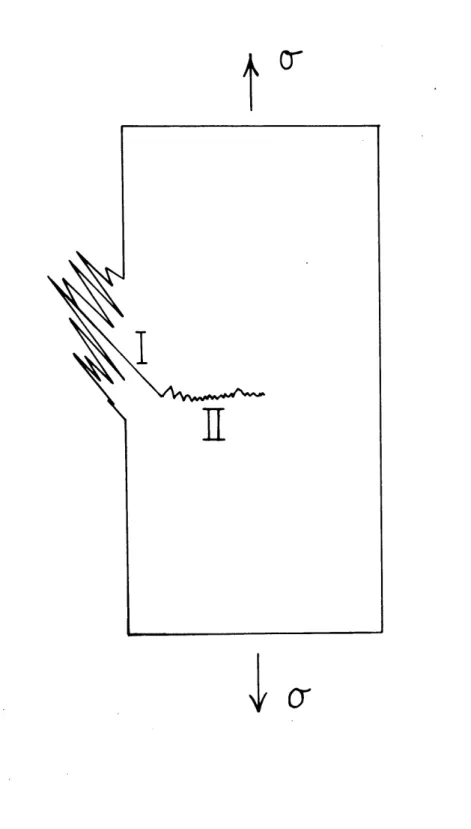
2 Double Cantilever Beam Fatigue Specimen 62 3 Steps in Producing Welded Fatigue Specimens 63 4 Diagram of Stage I and II Fatigue Crack Growth 64
5 Diagram of Plastic Blunting Process 65
6 Y versus a/W for K-Calibration 66
7 Crack Growth Rate, da/dn, versus Stress Intensity 67 Factor Range, AK, for Steel in Air and Steel in
Salt Water.
8 Crack Growth Rate, da/dn, versus Stress Intensity 68 Factor Range, AK, for Inconel in Air and Inconel
in Salt Water
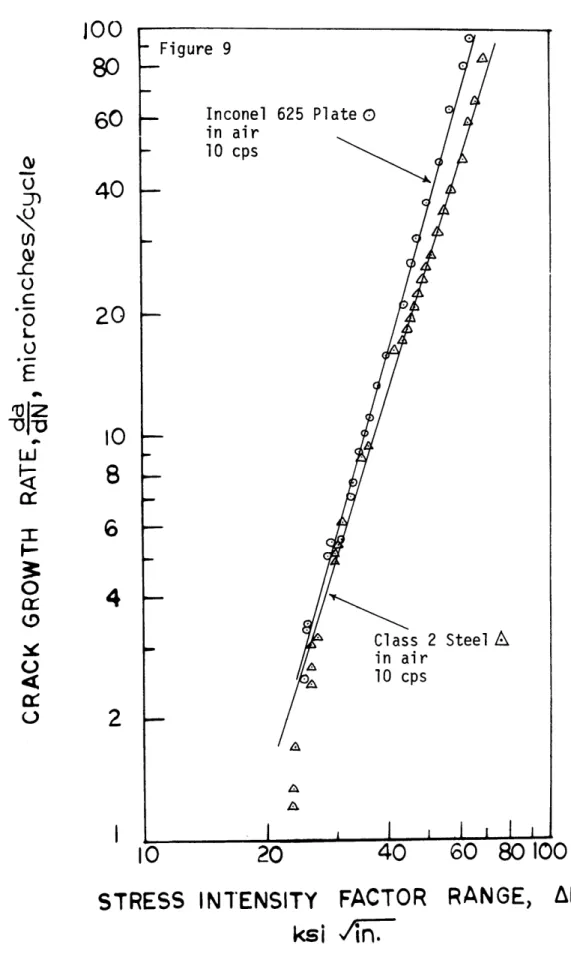
9 Crack Growth Rate, da/dn, versus Stress Intensity 69 Factor Range, AK, for Inconel in Air and Steel in
Air
10 Crack Growth Rate, da/dn, versus Stress Intensity 70 Factor Range, AK, for Inconel in Salt Water and
Steel in Salt Water
11 Crack Growth Rate, da/dn, versus Stress Intensity 71 Factor Range, AK, for Inconel Weld in Air and
Steel in Air
12 Crack Growth Rate, da/dn, versus Stress Intensity 72 Factor Range, AK, for Inconel Weld in Salt Water
and Steel in Salt Water
13 Crack Growth Rate, da/dn, versus Stress Intensity 73 Factor Range, AK, for Inconel Weld in Air and
Inconel Weld in Air
14 Crack Growth Rate, da/dn, versus Stress Intensity 74 Factor Range, AK, for Inconel in Air and Inconel
Figure Number 15 16 17 18 19 20 21 22 23 24 25 26 27 28 29 30 31 32 33 34 35 36 Photomicrograph Photomicrograph Photomicrograph Photomicrograph Photomicrograph Photomicrograph
625 Plate Fracture Surface Inconel 625 Weld Fracture Surface Inconel 625 Plate Fracture Surface Inconel 625 Weld Fracture Surface Inconel 625 Plate Fracture Surface Inconel 625 Weld Fracture Surface Weld Fusion Line Fracture Surface
8
Crack Growth Rate, da/dn, versus Stress Intensity Factor Range, AK, for Inconel in Air and Inconel Weld in Air
Crack Growth Rate, da/dn, versus Stress Intensity Factor Range, AK, for Inconel Weld in Air and Steel in Air
Microhardness Diagram (Vickers)
Photomicrograph Class 2 Steel As-Received Photomicrograph Class 2 Steel Annealed Photomicrograph Steel Heat Affected Zone Photomicrograph Inconel 625 Plate (Unetched) Photomicrograph Inconel 625 Plate
Photomicrograph Inconel 625 Weld Metal Photomicrograph Inconel 625 Plate Photomicrograph Inconel 625 Weld Metal
Photomicrograph Inconel 625 Weld Metal (Unetched) Fatigue Specimen Fracture Surfaces
Fatigue Specimen Fracture Surfaces
Photomicrograph Inconel 625 Weld Fracture Surface Photomicrograph Inconel Page Number 75 76 77 78 78 79 79 80 80 81 81 82 83 83 84 84 85 85 86 86 87 87
Figure Page
Number Number
37 Tensile Specimens as Fractured 88
10
I. INTRODUCTION AND AIM OF PROJECT
The United States Navy is presently engaged in a program to examine the feasibility of weld overlaying a circumferential band of Inconel 625 alloy (nickel, chromium, molybdenum) on ship propeller shafting to
replace the presently used copper-nickel stern tube and strut bearing journal sleeves (1,2). Previous experience has shown that it is possible to apply massive amounts of weld metal to ship propulsion shafting with-out distortion or other problems (3,4). This program includes studies of various welding techniques for applying the overlay and the resultant properties of the overlay such as iron dilution, weldability, general and crevice corrosion, wear resistance and fatigue strength.
Initial work done by Long (5), indicated that the excellent weld-ability, corrosion and wear resistance of Inconel 625 makes it a good candidate as a bearing sleeve replacement material. Originally devel-oped for high temperature applications (14), Inconel 625 has found increasing utilization in the ocean environment due to its combination of strength and corrosion resistance (6,7,8,9,10). The Navy has con-ducted a study of corrosion resistant alloys for propeller shaft seal applications (11) and reported that Inconel 625 was superior to both Monel and 70-30 copper-nickel under conditions of imposed voltage
corrosion. It has also been found to possess properties which make it a desirable material for high speed propellers in PGM class vessels (12,
13). Investigations into the properties of Inconel 625 for other purposes have also been reported in the literature (14,15,16).
The aim of this work is to contribute to the overall evaluation of Inconel 625 as a propeller shaft bearing sleeve replacement. The inves-tigation includes a comparison of the resistance to fatigue crack prop-agation of Navy specification Class 2 (17) propeller shaft steel (3.25% Ni steel), Inconel 625 hot rolled and annealed plate, and GMA deposited Inconel 625 weld metal. The influence of the weld heat affected zone, the required stress relief anneal (18) and the corrosion fatigue effects of sea water on the fatigue crack growth rates was also measured.
II. EXPERIMENTAL PROCEDURE
A. Material Selection and Preparation
The Navy specification Class 2 shaft steel was processed by the Earle M. Jorgensen Company of Seattle, Washington - Heat 13841/6536. The steel was forged from a 70 inch diameter ingot to approximately 33 inches in diameter. The forging was then normalized at 1650'F, tempered at 1250'F and then retempered at 1200'F. The specific steel used in this work was that taken from a prolongation of a forging made for split thrust rings and coupling sleeves intended for use in SSN 637 Class attack submarines. Chemical analysis and mechanical properties are as shown in Table I. Ultrasonic and magnetic particle inspection was per-formed on this prolongation at the foundry and found to be satisfactory.
The Inconel 625 plate and weld filler metal was provided by the Huntington Alloys Division of the International Nickel Company. The plate sample provided was 0.625 inch hot rolled and annealed plate -Heat lNX84B8Al. The weld filler metal was Inconel 625 weld filler metal, 0.045 inch diameter - Heat NX52AOA. Chemical analysis and mechanical properties are shown in Table I.
B. Welding Procedure
To produce a close simulation of the desired overlay weld on a ship propeller shaft, six pieces of 15 inches x 2 inches x 5/8 inch Navy specification Class 2 steel plate were tack welded together with .045 inch diameter wire spacers between each plate. The plates were
positioned together with weld wire spacers so that when the specimens were cut, the only required cutting would be through the overlay
(ap-proximately 3/4 inch thick) and not through the 2 inch dimension of the steel. After the overlay welding was completed, the tack welds were chipped off and a cut taken with a cut-off wheel through the weld in the same vertical position as the separation between plates. However, this procedure of putting spacers between plates to facilitate cutting is not recommended for future research. The use of one solid metal block for overlaying is preferred because of the difficulty in maintaining the
required (18) preheat and interpass temperatures of 400 - 500'F. From the earlier experience of the author (5), the technique of stringer bead, gas metal-arc welding was used to hold down weld metal dilution. Since the earlier work had used 0.062 inch diameter wire, it was decided to use 0.045 inch diameter Inconel 625 filler wire to deter-mine if there was any difference in weld overlay characteristics between the two diameter wires. It is also known (22) that it is more desirable to use many small beads rather than a few large heavy beads for the most efficient weld joint. Welding parameters were selected from the manu-facturers recommendations (21) and were optimized during trial welding runs. Fully automatic welding was used to insure reproducibility of results and to simulate what would most likely be used if propeller shaft weld overlaying were accepted by the Navy.
Welding was accomplished with a Linde ST-12 water cooled welding torch, a Linde VI-1000 power supply and a Linde SFH-3 travelling beam wire feeder. Shielding gas was argon at 50 CFH. No trailing shield was used. Welding was accomplished at the Quincy Division, General
Dynamics Corporation. The following welding parameters were used for the automatic welding operation:.
Preheat and Welding Welding Welding Heat Input Interpass Current Voltage Travel Speed
Temperature
33,400 400 - 500*F 195 a. 28.5 v. 10 ipm joules/inch
On each pass, the welding head had a 5* lead angle and for each pass after the first, the welding head was inclined at 10* to the pre-ceding bead. A 50% overlap on each pass was used. Prior to automatic overlaying, the space between each plate was buttered over with Inconel 625 filler wire by semiautomatic welding. The entire surface to be overlayed was ground and wire brushed, followed by freon degreasing and a dye penetrant check made of the surface to detect any cracks. No cracks were observed and the dye penetrant was removed before welding.
Since it is impossible to provide complete gas coverage of the weld metal during welding by the gas-shielded arc process, it is recommend-ed (22) that interbead or interlayer cleaning be provided to remove the accumulation of oxide film. Oxide inclusions of this type act as mechanical stress raisers and may result in significant reductions in joint efficiency, fatigue strength and service life. These thin laminar
inclusions are almost impossible to detect even by radiographic examina-tion (22). Power wire brushing serves only to polish the oxide surface; therefore, abrasive blasting or grinding of each weld bead or layer is required to provide defect free welds.
ground to bright metal and rough bead edges were ground smooth after each pass. After grinding, the surface was wire brushed to remove any carbide particles that may have been embedded in the metal by the
grind-ing wheel. Each weld bead was visually inspected after the above prepa-ration. No magnetic particle, ultrasonic or x-ray check was made of the weld overlay.
Extreme difficulty was encountered in welding with the 0.045 inch Inconel 625 filler wire. The wire appeared to have a very uneven burn rate and the arc length during a welding pass varied considerably. It was felt for a time that the wire feed mechanism might have been mal-functioning, but a thorough check proved this not to be the case. A welding burn back occurred approximately every one-and-one-half passes, which required grinding out of the copper in the weld crater from the melted contact tube and replacing the contact tube. As a consequence, the workpiece cooled down below 400*F. Heating the piece back up to the interpass temperature was then required.
It was found later (23), that the difficulty was caused by defec-tive surface treatment of the weld wire. Other investigators welding Inconel 625 (5,14,15,16), indicate no difficulty in welding with the GMA process.
After putting one layer of weld overlay on the plate and three passes of the second layer by the automatic process, it was decided to apply the rest of the overlay (3/4 inch overlay desired), with a semi-automatic process. This decision was due to the time consuming frustra-tions of the previously mentioned burnbacks. The semiautomatic overlay-ing was done with the followoverlay-ing parameters:
Preheat and Welding Welding Welding Heat Input Interpass Current Voltage Travel Speed
Temperature
30,400 400 - 500*F 215 a. 33 v. 14 imp joules/inch
The semiautomatic equipment used was a Linde ST-13A torch, a
Westinghouse CV power supply and a Linde SWM-23 wire feeder. A forehand stringer bead technique was used. Shielding was argon gas at 40 CFH. Seven more layers of weld overlay were applied using the semiautomatic technique to bring the overlay thickness up to approximately 3/4 inch. The thickness of each overlay layer from metallographic examination was approximately 3/32 inch. An unsteady arc length and burn-backs were also encountered in the semiautomatic mode though not as frequently as when using full automatic equipment since the welder has more control in this mode.
C. Mechanical Testing 1. Tensile Testing
Tensile tests on round specimens (ASTM small size specimen propor-tioned to standard - see Figure 1) were conducted on the following material:
1. Inconel 625 plate*
2. Class 2 steel stress relief annealed at 1200'F
3. Steel-Inconel 625 weld specimens stress relief annealed at 1200*F
* In this thesis, Inconel 625 plate will refer to Inconel 625 hot rolled and annealed plate.
Stress relief anneal heat treatments were given in accordance with Navy specifications for welding propulsion shafting (18). The stress relief heat treatment was as follows: heating at 125/150*F per hour to 1200OF 250, holding for two hours per inch of thickness, then cooling at 125/150*F per hour. Inconel 625 weld metal does not require any post weld heat treatment (15,21). All tensile and welded fatigue specimens were stress relief annealed.
The tensile specimens were tested on an Instron machine at a cross-head speed of 0.1 and 0.05 inch/minute, at room temperature.
2. Fatigue Crack Propagation Testing
Fatigue crack propagation tests were performed on double cantilever beam (DCB) specimens as shown in Figure 2. The thickness of these
spec-imens and the diameter of the pin loading holes varied due to the size of the material provided and the pin loading grips available. For exam-ple, the Inconel 625 plate was provided in 0.625 inch thickness and spec-imens of this material were machined to 0.625 inch thickness to minimize the cost of specimen fabrication. The thickness of all specimens in this work was of sufficient thickness to provide plane strain conditions throughout the major portion of crack propagation. In any case, the thickness of the specimen should have little effect on the fatigue crack propagation results.*
* Clark and Wessel (24) in fatigue testing medium strength steels report that there does not appear to be a significant effect on the state of stress (plane stress or nonplane strain) on the fatigue crack growth rate behavior. Specifically, most of their fatigue crack growth rate tests were conducted with test specimens of insufficient size to maintain plane strain conditions throughout the entire test. Consequently, the state of stress changed during the test, and yet there was no evidence of a trans-sition effect in the crack growth rate data (the log da/dn versus log AK remained linear).
Crack Propagation Specimen Thickness Pin Loading Diameter Inconel 625 plate 0.625 inch 0.500 inch
Class 2 Steel 0.490 inch 0.375 inch
Welded specimens 0.375 inch 0.375 inch
Figure 3 shows the steps followed in the preparation of a welded fatigue specimen. Figure 3a shows the overlayed steel after being cut away from the remaining pieces. This overlayed steel was then butt welded to another piece of Class 2 steel with Inconel 625 filler metal as shown in Figure 3b. The specimen was then cut and machined to its final form as shown in Figure 3c. The crack starter notch was positioned to allow the fatigue crack to start and propagate through overlay weld metal only and not through the butt welded section.
The specimens were machined in such a way that the plane of crack propagation was oriented along the rolling or forging direction in the following manner:
Crack Propagation Specimen Crack Propagation Relative to Rolling or Forging Direction
Inconel 625 plate Normal
Class 2 Steel Normal
Transverse weld specimens Parallel in steel portion Longitudinal weld specimens Normal in steel portion
The crack length, a, was measured to an accuracy of .001 inch, by means of a slide-mounted, calibrated telescope focused on the crack tip. To aid in the observation of the fatigue crack's progress, the surface of the specimen in the vicinity of the crack's path was polished through 600 grit paper and finished with metal polish.
The crack propagation rate, da/dn, was determined by measuring the increase in crack length, Aa, after cycling for a definite number of cycles, AN. The following relation then holds:
da Aa aend - start
dn_ AN AN
where N is the number of applied cycles and astart and aend are the crack lengths before and after fatigue cycling.
Each specimen was fatigued under constant tension-tension load. The number of cycles between each crack length measurement was dependent
upon the crack growth rate. The increase of the stress-intensity factor
range, AK, with crack length, provided a range of crack growth rates. After a number of measurements (approximately 10 to 20 readings ), the
tensile load was increased and the same process. repeated. By this procedure, AK was varied both by the increase of the crack length and also by the increase in applied load.
Specimens were cycled until failure occurred. The specimens tested in air were fatigued at 31-47% relative humidity and room temperature.
The effects of corrosive environment (corrosion fatigue effects) were
simulated by placing a clear plexiglass cell around the test specimen. The cell was then filled with distilled water containing 3.5% NaCl at room temperature to simulate the corrosive environment of sea water. The cell contained a clear glass window for crack length measurements.
3. Hardness Testing
Microhardness tests (Vickers) were made on the following specimens in order to predict local tensile strength:
1. Inconel 625 plate 2. Class 2 Steel 3. Steel-Inconel 625 4. Steel-Inconel 625 Specimens were prepared by with 0.05 micron alumina. Leitz hardness tester with
weld interface (stress relief annealed) weld interface (as welded)
wet grinding in several stages to a finish Hardness readings were taken on a Microdurimet a hardness load of 50 grams.
D. Metallography
Metallographic samples were cut from the following materials: 1. Inconel 625 plate
2. Class 2 Steel
3. Steel-Inconel 625 weld interface (as welded)
4. Steel-Inconel 625 weld interface (stress relief annealed) All specimens were prepared by wet grinding in several stages to a 0.05 micron alumina finish. Steel specimens were etched with a 1% Nital solution. Inconel 625 specimens were electrolytically etched with a solution of 20 parts nitric acid, 100 parts ethyl alcohol.
III. THEORETICAL CONSIDERATIONS
The following review of the mechanics of fatigue is given in order to relate the results of this study to the ultimate purpose of using
Inconel 625 weld metal overlays for propeller shaft journals.
Fatigue
Fatigue is a progressive mode of fracture crack extension by repeat-ed tensile loading. It is now generally recognizrepeat-ed that fatigue occurs as the result of plastic deformation, both during the initiation and the propagation of cracks (25,26). Fatigue failure is, by convention,
divided into three stages:
Stage I - Fatigue crack initiation Stage II - Fatigue crack growth Stage III - Failure
Stage I - Fatigue Crack Initiation
Fatigue cracks are usually nucleated at a free surface (25,27), where surface imperfections cause stress concentrations. The
impor-tance of surface condition, in controlling crack initiation in fatigue, is a well established fact (28). For example, the damaging effect of water, particularly sea water, on the fatigue strength of steels is due to corrosion pits being formed at the steel surface by the aqueous envi-ronment (29). It is from these pits that fatigue cracks are initiated and propagate. A common measure (30) of the fatigue strength of steels
in air is
1 ~fatigue r "uts
When steels are fatigue tested in air, higher strength steels have proportionately higher fatigue strengths than those steels of lower
strength. In salt water however, high strength steels show no such fa-tigue strength superiority over low strength steels, and all steels fail in fatigue at approximately the same stress level (27). This leads to the conclusion that high fatigue strength is dependent on a material's ability to resist Stage I crack initiation. This is borne out by the fact that at low stress levels at least 90 percent of the fatigue life of unnotched steel specimens is spent in Stage I initiation (25).
Stage I fatigue crack initiation is characterized by propagation of a crack oriented approximately 45 degrees to the maximum tensile stress axis. Stage I growth is confined to slip planes in individual crystals. On a free surface, an extension, or ribbonlike bit of metal, has been observed to emanate from the slip bands (25). See Figure 4. Since this initiation of Stage I growth is determined by the ease with which planar slip occurs in a grain of metal, the yield strength or resistance to planar slip has a direct relation on the fatigue life of unnotched specimens as in the case of steel previously mentioned.
Once a crack is initiated at a surface slip band in a single crys-tal, it will continue to advance into the material along the slip planes involved in the creation of the slip band, until it finally veers onto a plane at right angles to the principal tensile stress axis. At this point, it then becomes Stage II growth.
The fatigue life of welded structures is more dependent on Stage II propagation than in wrought material. This is due to the fact that in
weld metal, defects of such a magnitude as to be defined as Stage I cracks are likely to be present. Small microstructural defects, may be present in any case, which act as stress concentration centers greatly speeding up the crack nucleation period (32). Lindh and Peshak (31) found that porosity in weldments as small as 0.002 inch in diameter in 1/2 inch fatigue specimens had initiated failure. Radziminski and Lawrence (28) even found that several weld fatigue specimens classified as sound, defect free weldments by radiographic inspection failed at internal locations containing intermittent lack of fusion or very small pores.
However, to say that the fatigue life of such structures is almost entirely defined by Stage II propagation is not correct either, in that at low nominal stresses, the number of cycles of load application before a crack will initiate from an internal defect, could occupy a relatively large part of the specimen's total fatigue life (28). From a conserva-tive standpoint, a welded structure's resistance to failure by fatigue can reasonably be equated to its resistance to fatigue crack growth (33), which is the major concern of this study.
Stage II - Fatigue Crack Growth
Laird (26) has developed a theory*, now fairly well accepted (25, 32), that there is one general mechanism of fatigue crack growth in duc-tile materials and the microstructure of the material undergoing fatigue acts only to alter the kinetics of crack propagation and does not change the nature of the process. Stage II growth has been investigated under
conditions of high strain amplitude and the plastic deformation taking place at the tip of a crack has been directly observed (26). Direct observation of a crack tip under cyclic loads, indicates that a crack propagates by plastic blunting of the crack tip during the tensile part of the fatigue cycle followed by resharpening of the crack during the compression part.
One of the most important characteristics of this process is that the crack advances a finite increment in each loading cycle. Figure 5 presents a schematic diagram of the Stage II fatigue crack growth proc-ess. At the start of a loading cycle, the crack tip is sharp, but during extension, as the crack advances, it simultaneously becomes much blunter, and the plastic zones at the tip expand, slowing down and finally stop-ping the crack advance. Both effects are involved in establishing a balance between the applied stress and the amount of plastic deformation at the crack tip. It is during the loading stage, that new fracture surface is created by shear rupture. During the unloading portion of the cycle, as the sharp tip of the crack is re-established, the material at the tip is heavily compressed causing formation of the characteristic crack front markings or fatigue striations on the fracture surface. The surface of a fatigue crack will be covered by these striations running parallel to the crack propagation front and the distance between stria-tions can be used as a measure of the fatigue crack's growth per cycle. The repetition of this blunting and resharpening process is then the
Stage III - Failure
Stage II growth continues until the crack becomes long enough to trigger off final instability. In ductile materials, Stage II continues until the remaining cross-sectional area can no longer support the
applied load. In this case, fracture usually occurs by shear rupture, on shear planes inclined at 450 to the tensile axis. In thick sections, where plane strain conditions exist and in brittle materials, the extent of Stage II growth is governed by the material's toughness. Toughness determines the critical size crack that can exist before causing insta-bility at a given stress, when K = KIC (to be defined later).
Stage II Fatigue Crack Growth and Fracture Mechanics
Two factors that are important in determining the rate of Stage II crack growth, are the applied tensile stress amplitude and the length of the crack itself. The theory of fracture mechanics, first introduced by Griffith (35) over fifty years ago, provides a material design
concept which yields a quantitative relationship between these values. The fracture mechanics approach allows loading and configuration effects
to be described in terms of a single parameter, i.e., the stress inten-sity factor, K. The stress intensity factor depends upon the applied stress, the crack length and the geometry of the structure under consid-eration.
The stress intensity factor may be visualized as analogous to the elementary physics example of a lever and fulcrum. By use of a lever and fulcrum, a force may be intensified by the relation
F F FI L1 2 L2
where F1 = applied force
F2 = resultant force
LL 2 = length of lever between force and fulcrum
It can easily be seen that if L > L2, then F2 is increased proportion-ally over F1. The stress intensity factor, K, is an intensification relationship, which magnifies the stress applied to a structure at the root of a crack. This magnification depends on the geometry of the structure and the length of the crack, in the same manner as L and L2' It is this intensified stress at the root of a crack, when magnified above the yield strength of the material, that causes a crack to propa-gate.
The stress intensity factor was first introduced by Irwin (36) who devised expressions for stress in the vicinity of a crack tip, assuming the crack to be contained in a two-dimensional sheet of isotropic mate-rial. For the simplified case of an infinitely sharp elastic crack, in an infinitely wide plate, with uniform normal stress at infinity, the stress intensity factor, K, is defined (37) as
K = avWa
where a = stress at the crack tip a = 1/2 crack length
Normally, in practice, the value of stress intensity factor is not so easily determined, since structures are usually found in three dimen-sions and finite widths. Expresdimen-sions defining K in terms of the specimen
dimensions, including the crack length and applied load, are determined either by boundary collocation procedures or by stress analysis of the specimen (38). This results in an appropriate expression, generally referred to as the stress intensity expression or K-calibration, which describes the relationship between these factors for the structural configuration of interest.
During the present investigation, the stress intensity values for the double cantilever beam fatigue specimen were obtained from an equa-tion given in (39). The K-calibraequa-tion is represented by the following equation:
K = Y P a 1/2 = Yaa1/2
B W Yca 1
where Y is given by
Y = 29.6 - 185.5
(j)
+ 655.7 ()2 - 1017.0 ) + 638.9 4 and a, B and W are the specimen dimensions as shown in Figure 2.P = tensile load
a = P/BW (stress load)
A curve representing Y is shown in Figure 6. Specific Considerations
The basic material property essential to all fracture mechanics considerations is the material's inherent fracture toughness, KIC. KIC is the stress intensity factor at which a defect or fatigue crack of a certain size will cause brittle failure under the application of a spe-cific load. Consequently, the useful life of a structure under cyclic loading, depends upon the rate at which an existing defect or fatigue
crack will grow to the critical flaw size necessary for K = KIC under the existing loading conditions (24). Therefore, an additional material property of interest to fracture mechanics considerations is the rate at which a crack will grow under a given set of loading conditions.
Since the stress intensity factor describes the effect of both external loading and configuration on the stress field surrounding the growing crack tip, the rate of fatigue crack growth should depend on the stress intensity factor. This hypothesis has been investigated by
various workers and they have found a correlation between the stress intensity factor and crack propagation rate (40,41,42). The empirical relationship* obtained by Paris (41) is
da = C (AK)m dn o
where AK = stress intensity factor range (Kmax. load - Kmin. load) m = numerical constant (property of the material)
C0 = empirical constant determined from the data
We can observe the increase in length of a crack, as a function of the number of cycles applied. The rate of growth can then be determined
as a function of stress intensity factor. This is done by a graphical analysis of a plot of crack growth rate, da, versus stress intensity factor range, AK. In general, when fatigue crack growth data are ex-pressed in terms of the log of the crack growth rate, d, versus the log of the stress intensity factor range, AK, a linear relationship is found
(24,28). Therefore, fatigue crack growth data can be expressed in terms of the generalized fatigue crack growth rate law above, where m is the slope of the log da versus log AK curve. The resistance of materials todn Stage II fatigue crack propagation can then be directly compared as a function of growth rate versus stress intensity factor range.
It should again be emphasized here, that resistance to Stage II fa-tigue crack growth depends on material variables other than yield
strength, which has such a major influence on Stage I crack initiation in unnotched steel specimens. An example of this is work done by Crooker and Lange (44), who tested three different steels, all heat treated to the same 180,000 psi yield strength. The following steels from their study, are listed in decreasing order of fatigue crack resistance:
Steel Yield Strength Fracture Charpy v.
lb/in2
Toughness Impact KIC in ksi viTn ft-lb
12 Ni Maraging 180,000 247 66
18 Ni Maraging 180,000 212 47
9Ni-4Co-0.25C 180,000 155 40
For these three steels, with the same 180 ksi yield strength level, significant differences were observed among their fatigue crack growth rate characteristics, measured as a function of the stress intensity factor. From the KIC and Charpy impact values, there appears to be a direct correlation between the material's toughness and fatigue crack growth resistance, which increases with toughness. Anctil and Kula (45)
and Clark and Wessel (24) show this same correlation. Pelloux (43) has proposed the following crack growth rate law:
da _ 1 (AK)2 1 dn -8 Y E ductility
where Y = yield strength E = Young's modulus
In this case, triaxial ductility can be considered as a measure of KIC, showing growth rate to vary inversely with KIC. This growth rate law correlates with the results of the previously mentioned investigators.
IV. RESULTS A. Uniaxial Tensile Test Results
Table II lists the tensile properties for the materials tested. In those cases where a yield point occurred, the yield stress was taken at the point of load drop, while in cases where the yield point was not clearly defined, the 0.2% offset stress was used. The steel specimens, and this includes the welded specimens, all had very pronounced yield points. The Inconel 625 plate specimens had less defined yield points and the yield stress is the 0.2% offset stress. The 0.2% offset yield stress for Inconel 625 was--also used for comparison with other sources (12,13,14,15,21) using the 0.2% yield offset.
The tensile specimen fracture surface was cup and cone for all steel specimens as well as welded specimens, since all the welded speci-mens failed in the steel portion. The fracture surface was chisel point for the Inconel 625 plate specimens.
B. Fatigue Crack Propagation Results
All fatigue crack propagation experiments were tension-tension tests on double cantilever beam specimens. The lower tension load was 250 pounds in all cases. Crack propagation was started at the minimum load possible, by cycling at a load, that from past experience was close to that required to start the crack, but lower. After cycling at this load, the machined notch was observed for fatigue crack initiation. The spec-imen was cycled under increasing loads until a fatigue crack was ob-served. The crack propagation test was then started at this value of
1 oad.
When the load is increased (AK increased), the crack growth rate observed is characteristic of the higher load. Chanani (38) found that when a shift from a large to a small load range is made, the crack
growth stops. After an inadvertant overload on an Inconel 625 plate specimen, it was found to be very difficult to again initiate crack propagation at anywhere near the previous loading. The difficulties in reinitiating fatigue crack propagation are explained as being caused by the residual compressive stresses near the crack tip (46), a blunting of the crack tip by large deformations associated with the high load, or a change of plastic zone size (42), or a combination of the three.
The crack length, before and after every run, was measured by means of a travelling optical microscope. Since the crack length, a, changes during a run, the value of AK does not remain constant throughout the duration of any one run since AK is a function of crack length. The average of the values of AK at the beginning and end of each run was used as the value of the stress intensity factor range corresponding to the particular crack growth rate, da/dn, during that run.
Steel and Inconel 625 Plate
Figures 7 and 8 present comparison plots of the as received Class 2 steel and Inconel 625 plate, in both air and 3.5% NaCl solution (repre-senting the corrosive effects of sea water), at room temperature.
Results of fatigue crack growth rates in these two materials will be used to compare the results of the crack growth rates in the Inconel 625 weld metal and the effects of the heat affected zone and stress relief
annealing on the steel. As can be seen in Figures 9 and 10, the fatigue crack resistance of Class 2 steel is better than Inconel 625 in both air and 3.5% NaCl, though this difference is not great. It is interesting to note, though not shown, that the growth rate curves for steel in salt water and Inconel 625 plate in air are exactly the same.
That the fatigue crack propagation resistance of Class 2 steel should be better than the highly corrosion resistant Inconel 625 in 3.5% NaCl may be somewhat surprising, knowing that steel is very susceptible to corrosion fatigue. The reason for this seeming paradox is that, at the fatigue testing rates of 10 cps, the corrosion effect of the NaCl solution has no noticeable effect at the crack tip. Crooker and Lange (44) found that even a fatigue loading rate of 5 cycles per minute, did not allow sufficient time for the stress-corrosion crack propagation mechanism to exert a strong influence on crack growth rates in high strength steels. The strong effect that salt water does play on the fatigue strength of steels, at frequencies above 5 cpm, is of course, that of Stage I crack initiation at the metal surface. There is no explanation however, for the reason that the fatigue crack growth rate in Inconel 625 plate specimens is greater in salt water than in air. Transverse Weld Specimen
For the purposes of this thesis, the results of the transverse weld specimens are most revealing. In these specimens, the fatigue crack is started in the Inconel 625 weld metal and then progresses across the weld fusion line into the steel. See Figure 3c. This is the analogous
on a ship propeller shaft.
Figures 11 and 12 show the comparison of growth rates for Inconel 625 weld metal and Class 2 steel in both air and salt water. The posi-tion of the weld fusion line is indicated. This shows the superiority of steel over Inconel 625 weld metal, in the same manner as with Inconel 625 plate in Figures 9 and 10.
In the steel portion of the transverse specimens, good agreement is shown between crack growth rates in the as received steel and the steel after stress relief annealing. This would indicate that there is no apparent deleterious effect caused by the stress relief anneal, as far as crack growth rates are concerned. This result had been expected from work by Reemsnyder (47) who reports that tests of welds on mild steel
showed that stress relief has no practical effect on the fatigue life of the mild steel.
Longitudinal Weld Specimens
In the longitudinal weld specimens, the tip of the crack starter notch was placed at the weld fusion line and parallel to it. In both air and salt water environments, the crack initiated in the steel heat affected zone and propagated at approximately 100 to the weld fusion line into the steel until failure.
The crack growth rate data, from the heat affected zone portion of crack travel, is too scattered to draw any conclusions from. However, in the portion of crack travel after it is clear of the heat affected zone, it is found that the growth rate for air and salt water environ-ments are the same as those of the reference steel. This would again
indicate that there is no adverse effect of annealing on crack growth rate in the steel although the crack appeared to initiate easier in the steel HAZ than in the Inconel 625 weld metal.
The direction of crack travel in the HAZ is explained by reference to work by Dowse and Richards (48). A plastic zone is created ahead of the crack as the specimen is placed in tension. For plane strain condi-tions, as is the case for the major portion of crack growth for these fatigue specimens and AK values, there is little plasticity ahead of the crack tip, and deformation occurs in "wings" (49) on both sides of the crack. For conditions approaching plane stress, at large AK when the plastic zone approaches the width of the specimen, these "wings" are absent and yielding occurs only in a narrow zone ahead of the crack.
The hardness change from the HAZ to the unaffected steel (see Figure 17) influences the shape and size of the plastic zone ahead of the crack tip. A reduction in plastic zone size on the side of the crack adjacent to the HAZ, causes the crack to deviate towards the softer material because of asymmetric plasticity. Also, a reduction in plastic zone size is accompanied by a reduction in the amount of shear displacement produced per cycle at the crack tip, and hence by a decreased crack opening displacement. These factors are known to give a decrease in crack propagation rate (26), although it was not shown conclusively in this study.
Because the cracks in the two longitudinal weld specimens propagated in the steel portion, it was decided to machine another longitudinal weld specimen. This time with the crack starter notch machined into the weld metal. A third specimen was machined with the notch cut parallel
to the weld fusion line, but 5/16 inch into the weld at about the third layer of weld metal. This specimen would then allow a comparison be-tween crack propagation parallel and normal to weld dendrite orientation* (see Metallography results).
Comparison of crack growth rates in Inconel 625 weld metal, paral-lel and normal to dendrite orientation, is shown in Figure 13. As can be seen, the crack growth resistance is better when the crack is normal to dendrite orientation. Weld metal grain structure is much finer in
this orientation, which appears to improve crack growth resistance. At higher AK values, the growth rates merge.
This normal direction crack growth in weld metal is compared to Inconel 625 plate growth in Figure 14, and very close correlation is seen with some divergence at high AK. In Figure 15, parallel direction crack growth in weld metal is compared to Inconel 625 plate and the degradation in growth resistance is apparent. In Figure 16, normal di-rection crack growth in weld metal is compared with Class 2 steel plate and again a correlation at low AK is seen with a somewhat greater diver-gence at high AK.
One Cycle per Second Tests
Since the 10 cps fatigue results showed negligible stress corrosion effect from the 3.5% NaCl solution, in the steel and Inconel 625 plate specimens, it was decided to fatijgue the welded specimens at 1 cps to
* Crack propagation in the Inconel 625 weld metal is parallel to den-drite growth in the transverse weld specimens, and normal in the longi-tudinal weld specimens.
see if any effect could be seen. Because of the excessive time involved in fatigue testing an entire specimen, the 10 cps tests were interrupted periodically and run at 1 cps. The 1 cps data points essentially plot with the 10 cps data points, and no stress corrosion effect was seen at this frequency.
C. Hardness Results
The hardness of material not in the vicinity of the weld fusion line of the welded specimens is listed below:
Specimen Hardness Equivalent*
Vickers Tensile Strength
Inconel 625 plate 280 125,000
Class 2 steel 257 114,000
(as received)
Inconel 625 weld 267 119,000
metal (as welded)
Inconel 625 weld 320 142,000
metal (annealed)
Class 2 steel 235 104,000
(annealed)
For a comparison of the hardness across the weld fusion line of the welded specimen in the as-welded and stress relief annealed conditions see Figure 17.
* According to McClintock and Argon (30), the hardness of plastically deforming materials, taken as force per unit area is approximately 3.2 times the flow stress. As a first approximation, the flow stress may be taken to be the tensile strength.
Vuts
= = 1422 V
her3.2 m 2 3.2 in where V - Vickers number in g
D. Metallography Results
Figures 18 and 19 show the microstructure of Class 2 steel in the as-received condition and after stress relief anneal. Figure 20 shows the weld heat affected zone after stress relief anneal. There is no change between the as-received condition and stress relief anneal, although the annealed steel is somewhat softer (see Hardness Testing Results). The steel microstructure shows no indication of the forging direction. The steel in the heat affected zone has a very fine micro-structure and greatly increased hardness, though this is somewhat de-creased by stress relief annealing (see Hardness Testing Results).
The Inconel 625 plate microstructure shows quite a large amount of inclusions. See Figure 21. It is reported (21) that these are carbides, which are inherent in this type of alloy and are of the type MC and M6C, rich in nickel, columbium, molybdenum and carbon. Gilliland
and Slaughter (16) observed these inclusions and referred to them only as irregular shaped agglomerated particles. The rolling direction and microstructure of the plate is very evident from Figures 22 and 24.
In contrast, the Inconel 625 weld metal appears to be very clean and free of inclusions and one might assume that it would have good fa-tigue crack propagation resistance in comparison with the Inconel 625 plate. This is the case for propagation normal to the dendritic growth direction, though not for propagation parallel to the dendrites (see Fatigue Crack Propagation Results).
A comparison of the grain size and orientation in Inconel 625 annealed plate and weld metal, is shown in Figures 22, 23, 24 and 25. Figures 23 and 25 show the large dendritic grain structure of the
Inconel 625 weld metal, oriented in the cooling direction of the weld metal, which is generally normal to the base metal surface. Note that the weld metal is free of the inclusions that appear in the plate. An interesting feature that can be seen in these photomicrographs is the epitaxial orientation of dendrites in adjacent weld layers. This is evidently caused by the melting of the surface of the previous layer by the welding arc. As the surface layer cools along with the new layer of weld metal, the dendrite orientation of the first layer is continued into the second layer, resulting in very long dendrites. It is felt that these long dendritic grains partially accounted for the lack of fatigue crack propagation resistance in the Inconel 625 weld metal in the trans-verse weld specimens. This conclusion was verified by the crack growth comparison between a crack parallel and normal to the weld dendrite orientation (see Fatigue Crack Propagation results).
The effects of base metal dilution of the weld metal (see reference 5), can be seen in Figures 23 and 25. The first layer of the overlay is heavily etched, the second layer less so and the grain of layers above the third did not etch well enough to take photographs of. The heavy etching is due to iron dilution in the first layers of overlay.
Figure 26 shows the oxide film inclusions that will result, if great care is not taken to ensure an oxide free surface during welding. From a fatigue standpoint, these oxide inclusions form an ideal starting place for a fatigue crack to grow from, and also provide a path of
Fractography
Figures 27 and 28 show the fatigue crack surface* 6f three materi-als; Class 2 steel, Inconel 625 plate and Inconel 625 weld metal. The fatigue crack surface of the steel and Inconel 625 plate specimens have the grey, silky, fibrous appearance of ductile fracture. The appearance of the fatigue surface of the Inconel 625 weld sample (transverse weld specimen), however, had a crystalline, metallic appearance, with very flat fracture facets characteristic of cleavage type fracture.
The fracture surfaces were observed in a scanning electron micro-scope to compare the fracture surface features of the Inconel 625 weld specimen with those in the Inconel 625 plate. Figures 29, 30, 31, 32, 33 and 34 show that the microscopic surfaces of Inconel 625 plate and weld metal have generally the same appearance, indicating a similar fracture mechanism. Figure 35 shows the low power appearance of the Inconel 625 weld metal surface, presenting a planar fracture surface, indicating that fracture was probably along dendrites. To the naked eye, these planar surfaces look like cleavage fracture. However, the
high power photomicrographs show the mechanism is ductile fracture, the same as the Inconel 625 plate.
Figure 36 shows the weld fusion line between Inconel 625 weld metal and Class 2 steel. Clearly indicated here is the contrast between the generally planar surface of the Inconel 625 weld metal and the duc-tile rupture appearance of the steel. One can intuitively visualize a
* In all photographs of fracture surfaces, crack propagation direction is indicated by an arrow.
greater amount of energy being absorbed in the dimples and voids of the steel, compared to the planar surface of the weld metal, as the fatigue crack passes through.
V. DISCUSSION
A. Tensile Results
The results of the tensile tests compare to a first approximation, with that predicted by the microhardness tests. Also the results for
the Inconel 625 plate and weld metal compare favorably with that from other published sources (14,15,16,21). The lower than specified
mechan-ical properties reported in (12,13) are not in line with other reported data and do not agree with what is found here.
Although there were no all-weld metal tensile specimens, and all of the steel and weld metal specimens broke in the steel portion, it is felt that the yield and tensile strength of the Inconel 625 weld metal
is quite high.* This is because of the high hardness value of the
annealed weld metal, and also weld tensile specimen Number 1 was observed to have several weld defects, and yet still failed in the steel portion. Specimen Number 1 had been taken from near the end of the welded plate, where the welding arc had been started and stopped and was highly sus-pected of having defects. Although no defects could be observed on the surface of this tensile specimen, when the specimen was stressed in the
Instron machine, several defects broke open on the surface. Although these defects decreased the cross-sectional area of the specimen, espe-cially since it was a small sized specimen, the strength of the weld metal was sufficient to resist the loading and the specimen failed in
* References 14, 15 and 16 report Inconel 625 weld metal strengths ap-proaching that of the base metal. Dowse and Richards (48) report on tensile tests with low alloy and mild steel (covered electrode welding) indicating that there was no significant effect of orientation on ten-sile properties.
the steel portion.
There was no evidence of any fissuring at the weld fusion line and it maintained its integrity throughout the tensile testing. This con-firms reports of excellent weld joint efficiency in Inconel 625 (15,16).
Prominent Luder's bands appeared on all the Inconel 625 weld metal specimens, indicating a large grain size. No Luder's bands appeared in either the steel or Inconel 625 plate. See Figure 37.
All indications are that the Inconel 625 is a much tougher material than Class 2 steel. All of the steel tensile specimens fractured cup and cone, indicative of a combination of normal and shear rupture, where-as, the Inconel 625 plate specimens fractured in chisel point, indicative of pure shear rupture. The shear rupture being characteristic of the more ductile material. The elongation for the Inconel 625 plate is
almost twice that of the steel, 43% versus 24%, again an indication of a more ductile Inconel 625.
B. Fatigue Crack Propagation Results
Many workers have observed that fatigue crack growth in a material does not depend on yield strength,* (26,44) but appears to be determined by the material's inherent properties through strain hardening caused by plastic deformation at the crack tip (32). Perhaps the most significant
* The independence of crack propagation rate to yield strength is seen by referring to the discussion of stress intensity factor in Theoretical Considerations. Since the stress concentration at a sharpened crack, such as a fatigue crack, is extremely high, a very moderate stress will easily magnify to well above the material's yield stress and induce plastic deformation at that point. Thus, the yield stress of an alloy has little influence on crack propagation.
of these properties is stacking fault energy, with fatigue crack propa-gation resistance increasing with decreasing stacking fault energy (26, 50).
Laird (26), gives the following reason for the stacking fault
energy's influence. At the fatigue crack tip, the total amount of plas-tic deformation that occurs there will depend on the rate at which the material can be work hardened locally. The much greater work hardening capacity of alloys with low stacking fault energy, will then resist crack tip deformation and induce a lower crack propagation rate.
From elongation and fracture surface in Tensile Results, the indi-cations are that the Inconel 625 is much tougher than Class 2 steel. Conaway and Mesick (15) and other investigators (21) show the Charpy V-notch impact strength of Inconel 625 weld metal to be 57 ft-lb at -320'F, both perpendicular and parallel to the weld direction, versus an impact value of 33 ft-lb at 30*F for the steel (19). While elonga-tion and Charpy impact strength do not define a material's toughness,* they do give an indication of relative toughness, showing Inconel 625 to be tougher than Class 2 steel.
Using Pelloux's proposed growth rate law from page 30, the fatigue crack growth resistance of Inconel 625 should be better than Class 2 steel, since their Young's modulus is the same and their yield strengths are close. As has been shown, this is not the case. Although the grow-th rate curves for grow-the two materials were not too different (Figure 9),
the steel was clearly superior. These results indicate that, though it may be true in steels, toughness (ductility) is not necessarily a good indicator of a material's fatigue crack growth resistance in dissimilar metals.
The poor relative performance of Inconel 625 weld metal, with crack growth parallel to dendritic formation, is clearly due to the large grain dimensions in the plane of crack growth. This is borne out by the crack growth resistance of the weld metal, approaching that of the Inconel 625 plate, when the crack plane is normal to that long dimension as seen
in Figure 14.
It appears that this difference disappears at high AK, as indicated by the dotted line extension of the weld metal(crack parallel to the dendrite)growth curve in Figure 13. An indication of this can also be seen in Figure 38, which shows the Inconel 625 weld metal fatigue frac-ture surface in transverse and longitudinal weld specimens. In the transverse specimen (crack parallel to dendrite), the weld extends for only a portion of the fracture length. The macroscopic appearance of this weld surface is faceted and metallic, indicating fracture along the dendrite boundaries as described in metallographic results. The surface of the longitudinal specimen (crack normal to dendrite), at the start of the crack, has the same faceted surface, though on a finer scale, indi-cating a finer grain structure in this direction. However, as the crack propagates, the macroscopic appearance of the surface changes to that of the grey, silky, fibrous appearance of classic ductile fracture.
be partially intergranular, though fatigue cracks are normally considered transgranular (27). Marek, et.al. (51), found some tendency for the fa-tigue fracture path to follow microstructure boundaries and rolled out inclusions in AS14J steel. However, at high AK, the weld metal fracture surface of the longitudinal weld specimen had the same fibrous appearance of the Inconel 625 plate specimen, indicating that the crack in the weld metal was probably intergranular at this point. (Compare Figures 28 and 38a.) It is felt that had the weld surface in the transverse specimen extended further, the same transition from a faceted surface to a fibrous one would be apparent.
C. Hardness Results
It is a well known phenomena that yield and tensile strength are in-creased by decreasing grain size (25). From Figures 22, 23, 24 and 25, it is obvious that the grains in the Inconel 625 weld metal are much larger than those in the plate. It is found, however, that the Inconel 625 weld metal hardness, after the 1200'F stress relief anneal, is Vickers 320 versus Vickers 280 for the Inconel 625 plate. This would give an indi-cation that the tensile strength of the weld metal is approximately 17,000 psi greater than that of the plate (see Hardness Results). Since all weld tensile specimens broke in the steel portion, this was not verified here.
It is interesting to compare the hardness across the weld fusion line of the welded specimens, before and after stress relief annealing. Before annealing, there is a large discrepany between the hardness of the steel, particularly in the heat affected zone, and that of the Inconel 625 weld metal. This difference practically disappears after