HAL Id: hal-01159247
https://hal.archives-ouvertes.fr/hal-01159247v2
Submitted on 9 Nov 2015
HAL is a multi-disciplinary open access
archive for the deposit and dissemination of sci-entific research documents, whether they are pub-lished or not. The documents may come from teaching and research institutions in France or abroad, or from public or private research centers.
L’archive ouverte pluridisciplinaire HAL, est destinée au dépôt et à la diffusion de documents scientifiques de niveau recherche, publiés ou non, émanant des établissements d’enseignement et de recherche français ou étrangers, des laboratoires publics ou privés.
Soluble microbial products and suspended solids
influence in membrane fouling dynamics and interest of
punctual relaxation and/or backwashing
Amine Charfi, Yesican Yang, Jérôme Harmand, Nihel Ben Amar, Marc Heran,
Alain Grasmick
To cite this version:
Amine Charfi, Yesican Yang, Jérôme Harmand, Nihel Ben Amar, Marc Heran, et al.. Soluble mi-crobial products and suspended solids influence in membrane fouling dynamics and interest of punc-tual relaxation and/or backwashing. Journal of Membrane Science, Elsevier, 2015, 475, pp.156-166. �10.1016/j.memsci.2014.09.059�. �hal-01159247v2�
Version postprint
Author's Accepted Manuscript
Soluble Microbial Products and Suspended Solids influence in membrane fouling dy-namics and interest of punctual relaxation and/or backwashing
A. Charfi, Y. Yang, J. Harmand, N. Ben Amar, M. Heran, A. Grasmick
PII: S0376-7388(14)00761-3
DOI: http://dx.doi.org/10.1016/j.memsci.2014.09.059
Reference: MEMSCI13231
To appear in: Journal of Membrane Science
Received date: 28 April 2014 Revised date: 27 September 2014 Accepted date: 30 September 2014
Cite this article as: A. Charfi, Y. Yang, J. Harmand, N. Ben Amar, M. Heran, A. Grasmick, Soluble Microbial Products and Suspended Solids influence in membrane fouling dynamics and interest of punctual relaxation and/or
backwashing, Journal of Membrane Science,
http://dx.doi.org/10.1016/j.mem-sci.2014.09.059
This is a PDF file of an unedited manuscript that has been accepted for publication. As a service to our customers we are providing this early version of the manuscript. The manuscript will undergo copyediting, typesetting, and review of the resulting galley proof before it is published in its final citable form. Please note that during the production process errors may be discovered which could affect the content, and all legal disclaimers that apply to the journal pertain.
Version postprint
Soluble Microbial Products and Suspended Solids influence in membrane fouling dynamics and interest of punctual relaxation and/or backwashing
A.Charfia, b, c,*, Y. Yanga, J. Harmandd, e, N. Ben Amarb, c, M. Herana, A. Grasmicka
a
Institut Européen des Membranes (IEM), Université Montpellier 2, place Eugene Bataillon, CC05, 34095 Montpellier, France
b
Laboratoire de Modélisation Mathématique et Numérique dans les Sciences de l’Ingénieur, ENIT, B. P 37 Le Belvédère 1002 Tunis, Tunisia
c
Institut National des Sciences Appliquées et de Technologie, B. P. 676, 1080 Tunis Cedex, Tunisia
d
Laboratoire de Biotechnologie de l’Environnement, INRA, UR0050, Avenue des étangs, 11100 Narbonne, France
e
MODEMIC Research Group, INRIA, Laboratoire de Mathématiques, Informatique et Statistique pour l’Environnement et l’Agronomie-INRA, 2 Place Viala, 34060 Montpellier, France
*corresponding author at : Laboratoire de Modélisation Mathématique et Numérique dans les Sciences de l’Ingénieur, ENIT, B. P 37 Le Belvédère 1002 Tunis, Tunisia
Tel. +216 26 88 77 82; Fax : +216 71 871 022
E-mail adresses : amine.charfi@ymail.com (A. Charfi), yy.yesican@gmail.com (Y. Yang), Jerome.Harmand@supagro.inra.fr (J. Harmand), nihel.benamar@insat.rnu.tn (N. Ben Amar), Marc.Heran@univ-montp2.fr (M. Heran), alain.grasmick@univ-montp2.fr (A. Grasmick)
Abstract
To favour the control of membrane fouling on line by relaxation and backwash sequencing, two major fouling origins are considered: the former is due to retention of large particles on the membrane surface forming a growing deposit that can be controlled by tangential shear stresses, the second is due to the retention of the largest soluble polymers forming a thin layer on the membrane surface including pore blocking and inducing a progressive reduction of the deposit porosity, the influence of this second fouling origin can only be reduced by backwashing. A simple model was developed to represent (i) the accumulation of two types of compounds and its consequences and the evolution with time of the hydraulic resistance of the system and (ii) the
Version postprint
presented according to the values of the three model parameters. Simulations were also compared to experimental data obtained on biological suspensions.
Keywords:Membrane fouling, Soluble Microbial Products, Total Suspended Solids, fouling mod
elling, backwashing, relaxation
Nomenclature
d Cake particles diameter (m)
Jp Permeate flux (L.m-2.h-1) kε, k1, k2, k3,
b
Constantsmc Specific cake mass (g.m-2)
ms Critical specific cake mass (g.m-2)
R0 Clean membrane resistance (m-1)
Rc Cake resistance (m-1)
Rs Resistance due to SMP deposit (m-1)
Rt Total resistance (m-1)
S Soluble microbial products concentration (gCOD.L-1)
tf Filtration time
tr Relaxation time
tB Backwashing time
TMP Total Trans-Membrane Pressure (Pa)
TMP0 Initial Trans-Membrane Pressure (Pa)
X Total suspended solids concentration (gCOD.L-1)
α Cake specific resistance (mkg-1)
β Shear parameter (m2.g-1)
ε Cake porosity
ε0 Initial cake porosity
ߟ
1, ߟ
2,ߟ
3 Constantsµ Permeate viscosity (Pa.s)
ρs Cake density (kg.m-3)
σ Soluble polymers fraction rejected by the membrane
1. Introduction
Membrane bioreactors are now a mature technology for the treatment of industrial or urban wastewaters. The total rejection of biomass by the membrane allows a significant improvement of water quality (absence of SS and advanced disinfection) with respect to that obtained with
Version postprint
conventional systems. Moreover because the membrane rejection does not depend on biomass concentration in the bioreactor, it is possible to intensify the biological processes by increasing sludge retention time or decreasing the reactor volume. Nevertheless major drawbacks still hinder MBR development, that are membrane fouling, high energy requirements and lack of simple tools to optimize online MBR control. Depending on numerous factors, membrane fouling in MBR appears as a combination of complex phenomena [1]. It is directly related to the filtration phase during which largest compounds retained by the membrane cut-off accumulate on the membrane surface [2]. It also depends on physical-chemical interactions between smaller compounds and the membrane material (pore blocking, adsorption notably). The only tool to quantify online the intensity of fouling is the monitoring of the Trans-Membrane Pressure (TMP). Many works have been trying to study the TMP dynamics. Based on an experimental observation highlighting a two step TMP increase: a slow increase followed by a TMP jump, Sarjo et al. (2008) [3] and Ognier et al. (2004) [4] have proposed models assuming that a progressive pore blocking would lead to a local flux increase and consequently to an increase of membrane fouling. Other studies assumed that TMP increase would go through three stages [5]: an initial stage of short-term TMP rising due to soluble microbial products (SMP) deposition or bioflocs adsorption leading to a pore blocking, a second stage of long-term TMP rising either linearly or weakly exponential due to the development of cake formed by either the suspended solids SS or SMP, and a third stage of sudden TMP rising also know as the TMP jump due to inhomogeneous fouling. Different mechanisms explaining the TMP jump have been proposed and modelled such as the area loss model [6], the pore narrowing model [7], the pore loss model [8] and the critical suction pressure model [9].
Even though, TMP measurement is a global evaluation of instantaneous fouling intensity. It does not allow any differentiation of the relative importance of the different fouling processes and it is then difficult to optimize the operation and energy requirements. In practice, the filtration step is then essentially controlled using two criteria: average TMP variation during defined time periods and the maximal TMP value allowed.
In association with the monitoring of such criteria, the operator has different options to minimize fouling dynamics during operation including parietal shear stresses as tangential flow circulation, gas injection (air for aerobic process) close to the membrane surface to detach a large part of the
Version postprint
compounds accumulated onto the membrane surface, backwash to eject compounds blocking the pores to partially deconstruct the deposit/biofilm onto the membrane surface, and chemical cleaning to desorb compounds linked to materials, even destroying biofilm structure.
Numerous models were developed to give a better understanding and quantification of the different fouling modes including the role of parietal shear stresses to minimize deposit influence [10, 11, 12]. Such models also took into account the biological functioning conditions to include the role of SS, EPS and SMP concentrations in both reversible and irreversible fouling [13]. However, very few of them develop simulations by including the role of periodic relaxation and backwash on the instantaneous modification of the different fouling origin and their relative intensity [13, 14]. It is precisely the objective of this work to develop a simple model including mass balance when operating a filtration with air injection and periodic backwash. The simple model is confronted to experimental data obtained under several operating conditions and simulations are analyzed to point out the specific role of some fundamental criteria.
2. Model hypothesis
When filtering the mixed liquor suspended solids on membranes, the fouling dynamics is assumed to be due to three main phenomena as represented in Figure 1 [1, 15, 16]: (i) deposition of soluble polymers onto the membrane surface with the formation of a thin layer leading to some pore blocking and significantly that reducing the membrane open area and the membrane permeability, (ii) accumulation of particles onto the membrane surface to form a deposit which can also plays the role of a porous filter able to retain some soluble fractions that progressively modified the deposit structure and its permeability, and (iii) the adsorption of smallest molecules that enter inside the pores and interact with the membrane material to induce pore’s constriction and again reducing membrane permeability.
Nevertheless, many works studying fouling in membrane bioreactors, proved that the internal fouling is minor compared to the surface fouling [2, 17] and especially in the case of high suspended solids concentration or when using ultrafiltration [2, 18]. Based on these studies and aiming the development of simple model, the resistance due to pore constriction has been neglected in the proposed model.
Version postprint
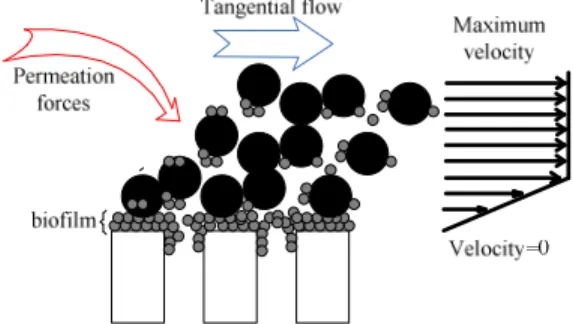
Even if suspended solids are totally retained by the membrane to form an external deposit, sufficient and effective shear stresses would avoid significant membrane clogging, which make them no longer the main cause of fouling intensity [12, 19]. The transfer resistance is then due to a thin film development on the membrane surface (a biofilm in case of bioreactors) that contributes to a drastic decrease of membrane permeability notably if the pore blocking phenomenon is associated to thin layer formation. In fact, during cross flow filtration, the large soluble polymer compounds, as SMP or soluble EPS in bioreactors, retained by the membrane have lower value of critical flux and are most likely transported to the membrane surface by the imposed flux [20]. This phenomenon characterizes the first fouling phase making concentration of such soluble fraction an important parameter controlling initial fouling dynamics. Most of the soluble foulants interacting with the membrane material and causing pore blocking were characterized as SMP in MBR by Wu et al. (2008) [21].
Figures 2, 3 and 4 give some illustrations of the control actions that can be taken online in response to the evolution of the main cleaning process. A parietal shear stress (Figure 2) favours the reduction of the deposit thickness by inducing an external particle detachment and a laminar movement of deposit that contributes to some deconstruction of the external deposit. During a relaxation period (the parietal shear stress is maintained but the filtration strength on particles is stopped), the parietal shear stresses is intensified (Figure 3) but the membrane surface fouling (thin film of soluble compound accumulated on the membrane surface and pore blocking) is not modified. At the opposite, when starting backwash (Figure 4), the compounds blocking physically the pores are ejected and the thin layer deposit (including biofilm) can be deconstructed. The only phenomenon not concerned by the preceding modes of permeability regeneration is the internal adsorption of small molecules inside the pores that necessitates chemical cleaning for their detachment. This internal phenomenon appears generally as the less intensive one [22].
Version postprint
Figure 1: Different fouling mechanisms Figure 2: Shear forces effect on cake’s destruction during tangential filtration
Figure 3: Relaxation effect on membrane cleaning
Figure 4: Back-washing effect on membrane cleaning
3. Fouling model development
In this section, a simple model to describe and to quantify the most important fouling mechanisms is proposed. It includes the respective role of each hydraulic cleaning method, notably relaxation and backwash. More particularly, this model highlights the effect of particles and large soluble compounds on cake’s building and pore blocking and their consequences on fouling intensity and reversibility according to the different modes of hydraulic cleaning such as parietal shear stresses, relaxation and backwash.
The proposed model is based on two foulant families totally retained by the membrane cut-off but differing in sizes. While particles (Suspended Solids) are retained on the membrane surface to form a cake, the largest soluble compounds presenting a size in the range of the membrane pore size distribution are retained both inside the particle cake (reducing its porosity and permeability)
Version postprint
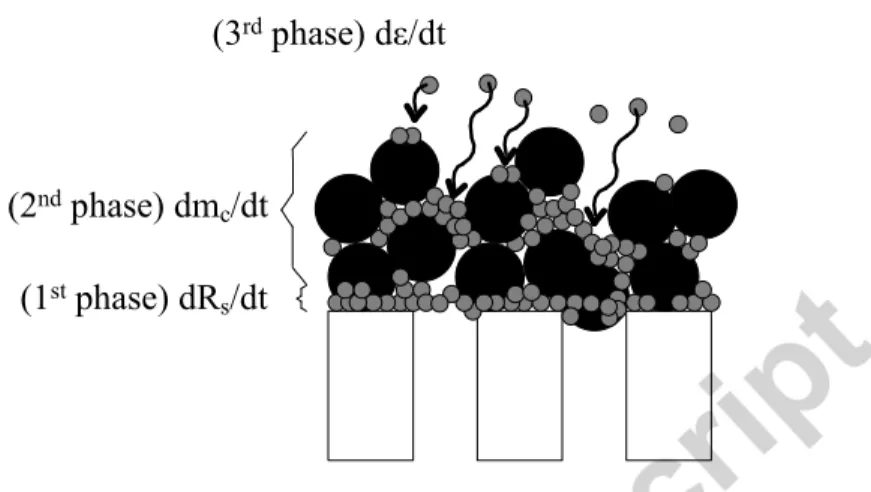
and on the membrane surface by blocking the membrane pores and forming a thin layer (Figure 5). The prediction of the dynamics of the hydraulic resistance of the system can then be largely improved by taking into account such combined phenomena [23].
(1st phase) dR s/dt (2nd phase) dm
c/dt
(3rd phase) dε/dt
Figure 5: The three fouling mechanisms considered in the proposed model During filtration phase, the model is given by the following set of equations:
. . (p t .1)
TMP=µ J R eq
where TMP (Pa) is the trans-membrane pressure, µ (Pa.s) is the permeate viscosity, Jp (L.m-2.h-1) is the permeate flux and Rt (m-1) is the total fouled membrane resistance that can be expressed as:
0 ( .2)
t S c
R =R +R +R eq
In eq. 2, R0 stands for the membrane intrinsic resistance, RS is the resistance of the first thin fouling layer and Rc is the cake’s resistance.
One has: 0 0 ( .3) p TMP R eq J
µ
=with TMP0 (Pa) the initial value of the trans-membrane pressure.
Depending on the actual value of mc, the dynamics of Rs is modelled as:
(
)
1. . . .4 S p dR k J S eq dt = σ if mc ≤msVersion postprint 0 ( .5) S dR eq dt = if c s m >m
where ms(g.m-2) is the specific mass of the first thin fouling layer.
Finally, the cake resistance is given by:
( .6)
c c
R =
α
m eqwhere α (m.kg-1) is the cake’s specific resistance and mc (g.m-2) is the deposit mass per area unit which dynamics is described by:
(
)
(
(
)
)
. . . 1 . ( .7) c p c s dm J S X m m eq dt =σ
+ −β
−In this last equation, S (gCOD.L-1) is the total SMP concentration, X (gCOD.L-1) is the suspended solids concentration, σ is the SMP fraction rejected by the membrane barrier and β (m2.g-1) is the shear parameter.
The dynamics of the cake porosity ε is:
( .8) d k eq dt ε b ε ε ε = − + while: 2. p. . ( .9) kε =k J σ S eq 2 3 180 (1 ) ( .10) s eq d ε α ρ ε − =
(
)
(
)
0 3 4 0 2 2 3 ( .11) k t d k eq dt k t ε ε ε α ε − − = − − 3 2 180 ( .12) s k k eq d ε ρ =with d the cake particle mean diameter and ρs is the cake density.
When filtration is operated at constant permeate flux, the Trans-membrane pressure increases with time to compensate the hydraulic resistance increase due to the accumulation of compounds on/in the membrane material. The TMP variation is then based on Darcy’s law and expressed with the resistance in series model (eq. 1). The total resistance of the clogged membrane is thus
Version postprint
expressed by eq. 2. The intrinsic membrane resistance R0 can be quantified in filtering demineralised water (eq. 3).
Rs is the hydraulic resistance due to the presence of the SMP thin layer on the membrane, leading to some pore blocking and membrane porosity decrease. Only a backwashing is supposed able to cancel such phenomena and the corresponding resistance.
The evolution over time of the hydraulic resistance Rs due to the largest soluble compounds accumulation onto the membrane surface, including pore blocking, is given by equation 4. Such accumulation is supposed to depend only on the largest soluble compounds concentration in the suspension (σS) and on the permeate flux, until reaching a critical thickness corresponding to a critical mass ms identified as the specific mass of deposit remaining on the membrane surface when relaxation is operated. When the accumulated deposit mc becomes greater than the critical ms value, the parietal shear stresses are supposed to restrain this resistance increase as expressed by the equation 5.
The dynamic of deposit formation is based on the model proposed by Charfi et al. (2014) [24]. The dynamic of particle accumulation on the membrane surface was supposed to be linked to a mass balance between the flux of particle brought onto the membrane by the filtration phenomenon and the intensity of particle detachment due to parietal shear stresses represented by the coefficient β. To improve this first model, the specific cake’s mass mc variation is supposed to be due to simultaneous accumulation of particles also able to retain largest polymer that contribute to the deposit building. The specific cake mass dynamic is then expressed by the equation 7. The resulting cake’s resistance is given by equation 6.
The accumulation of large soluble compounds inside the particle deposit induces a porosity decrease of this cake layer [25]. As expressed in equations 8 and 9, the cake porosity ε decrease is supposed to depend on the concentration of rejected soluble polymers (σ.S) present in the
suspension and the permeate flux Jp. The function b ε ε +
appearing in equation 8, can be understood as a limiting function which prevents obtaining a negative value of ε whatever be the operation time. The Kozeny-Carman relation (eq. 10) is considered to express the cake specific resistance [26]. The porosity decrease leads to the specific cake resistance increase which is expressed by the equation 11.
Version postprint
Taking into account the relations 8 and 10, the constant k3 is given by the equation 12. The parameter k3 is then proportional to kε which means that the effect of the parameter k3 on the model output would be the same as the parameter kε. As a consequence, the time evolution of the cake resistance can be only represented by the parameter kε.
4. Cleaning phases
The relaxation, found effective in removing the cake formed on the membrane surface [21] but not the pore clogging [27]. Based on these two ideas, the equation 13 has been proposed to describe fouling layer mass variation during a relaxation phase. The cake deposit represented by the mass mc is supposed composed by two superposed layers, (i) the external layer which can be detached by the tangential shear stress, and (ii) the thin layer represented by ms directly in contact with the membrane surface which is not sensitive to tangential flow, only to backwashing. Then the influence of tangential flow to detach deposit is supposed proportional to the difference (mc -ms), when this difference is great the detachment is important, when mc = ms, the detachment by tangential flow is null.
During a phase of relaxation the filtration is stopped and the cake is only depending on the shear stresses (Figure 3). Such forces detach mainly external particles from the deposit and induce a laminar moving of deposit whose intensity is depending on the local position of particles. Then mc quickly decreases (eq. 13) till it reaches ms. Fouling intensity, and thus TMP, then decrease. The variation of mc during the relaxation phase can be written as follows:
(
)
( .13) c c s dm m m eq dt = −β −During this phase, the cake’s porosity ε is kept constant, and so is the cake’s specific resistance α and the thin layer resistance Rs.
During a phase of backwash (Figure 4), the cake deposit including ms is supposed largely deconstructed assuming that the external fouling and pore blocking are then totally reversible. Nevertheless the cleaning efficiency of backwash is depending on the own resistance (compactness) of deposit (that can be different for ms and mc) and on the backwash intensity. Therefore, in order to take into account the cleaning efficiency of the cake and the polymer layer, the parameters η1 and η2 were respectively introduced (eq. 14, eq. 15). The backwash effect on
Version postprint
the cake’s porosity is expressed by the parameter η3 (eq. 16). If a total reversibility can be reached and if internal adsorption remains negligible, the total resistance will then decrease till reaching the membrane intrinsic resistance (R0). The cake mass, the resistance of the thin polymer deposit and the cake’s porosity variation over backwash are expressed in the eq. 14, eq. 15 and eq. 16 respectively.
1 ( .14) c c dm m eq dt = −η 2 ( .15) S S dR R eq dt = −η 3 ( .16) d eq dt ε η ε = −
5. Influence of the model criteria on fouling intensity
Numerical simulations have been carried out to qualify the interest of the proposed model and to highlight the fouling phenomena according to the specific values of the different model parameters.
5.1- Effect of k2 and (Jp.σ.S) on cake porosity variation
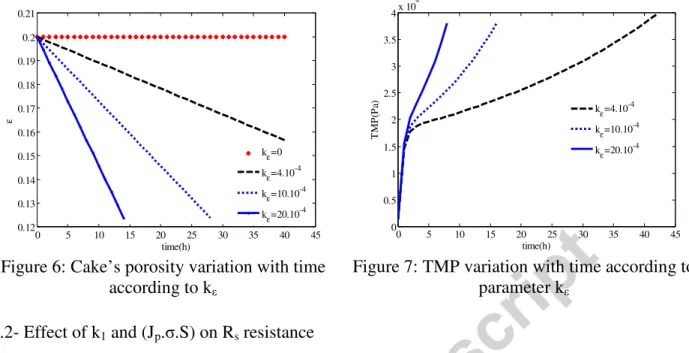
The cake porosity variation is supposed to be proportional to k2 and (Jp.σ.S) (equations 8 and 9) and their respective importance on fouling dynamics can be represented through the only parameter kε due to their relation of proportionality. The influence of such a parameter is highlighted in figures 6 and 7. The greater kε value, the quicker the cake’s porosity decrease, while the membrane resistance increases inducing a TMP increase.
Version postprint
Figure 6: Cake’s porosity variation with time according to kε
Figure 7: TMP variation with time according to parameter kε
5.2- Effect of k1 and (Jp.σ.S) on Rs resistance
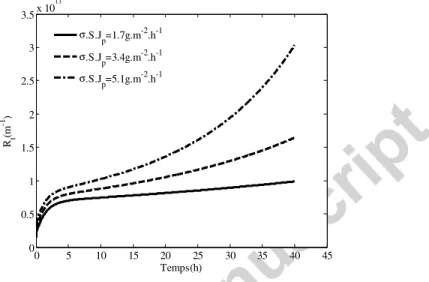
As expressed in the equation 4, the variation with time of Rs is directly proportional to the criterion k1 and (Jp.σ.S). This effect of the variation of one of these criteria is shown in Figures 8 and 9, the higher is the value of the considered criterion (the illustration is given for k1)the higher are the thin layer resistance and the TMP increase.
Figure 8: Effect of k1 parameter on the thin polymer layer resistance evolution
Figure 9: Effect of k1 parameter on TMP evolution with time
5.3- Specific effect of (Jp. σS) on simultaneous evolutions of Rs and Rc
The role of both cake resistance and thin layer resistance on total fouling resistance increase during long term experiment are illustrated in Figure 10. It illustrates notably the role of the soluble polymers on the fouling dynamics and the fouling resistance intensity. In fact the more the soluble polymer convective flow is important due to SMP concentration increase, the quicker
0 5 10 15 20 25 30 35 40 45 0.12 0.13 0.14 0.15 0.16 0.17 0.18 0.19 0.2 0.21 time(h) ε k ε=0 k ε=4.10 -4 kε=10.10-4 kε=20.10-4 0 5 10 15 20 25 30 35 40 45 0 0.5 1 1.5 2 2.5 3 3.5 4x 10 4 T M P (P a) time(h) k ε=4.10 -4 kε=10.10-4 kε=20.10-4 0 0.5 1 1.5 2 2.5 3 0 5 10 15x 10 11 Rs (m -1) time(min) k1=1 1013 k1=0.6 1013 k1=0.3 1013 0 0.5 1 1.5 2 2.5 3 0.6 0.7 0.8 0.9 1 1.1 1.2 1.3 1.4x 10 4 T M P (P a) Time(min) k1=1 1013 k1=0.6 1013 k1=0.3 1013
Version postprint
the total resistance increases. Figure 11 shows that during short-term experiment the thin layer resistance Rs is dominant compared to the cake resistance Rc. This phenomenon is more significant for high SMP concentration. This dynamic is then determining according to conventional time of filtration cycles when practising periodic relaxation and backwashing.
Figure 10: Effect of soluble polymer convective flow on the total fouling resistance for long term
Figure 11: Comparison of the importance of specific hydraulic resistance due to polymer layer and cake deposit for different SMP convective flows in short-term filtration
6- Influence of the model criteria on membrane regeneration
The model was developed to optimise the filtration cycle including periodic hydraulic cleaning such as relaxation and backwash. According to equations 13, 14 and 15, simulations were carried
0 5 10 15 20 25 30 35 40 45 0 0.5 1 1.5 2 2.5 3 3.5x 10 13 Rt (m -1) Temps(h) σ.S.Jp=1.7g.m-2.h-1 σ.S.J p=3.4g.m -2 .h-1 σ.S.J p=5.1g.m -2 .h-1 0 10 20 30 40 50 0 0.2 0.4 0.6 0.8 1 1.2 1.4 1.6 1.8 ra ti o o f re si st an ce (m -1 /m -1 ) Time(min) Rs/R0(σ.S.J p=5.1g.m -2 .h-1) R s/R0(σ.S.Jp=3.4g.m -2.h-1) R s/R0(σ.S.Jp=1.7g.m -2 .h-1) R c/R0(σ.S.Jp=5.1g.m -2 .h-1) R c/R0(σ.S.Jp=3.4g.m -2 .h-1) R c/R0(σ.S.Jp=1.7g.m -2 .h-1)
Version postprint
out to analyse the role of the frequency and the intensity of cleaning on the residual resistance of cake deposit and thin polymer layer.
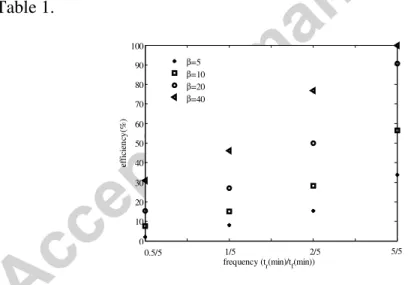
Figure 12 shows the relaxation efficiency determined for different ratios of relaxation time by filtration time (tr/tf), and different shear tress conditions.
According to the model, remember the thin layer deposit Rs is not removed by relaxation. According to the relaxation conditions, Rc can be totally removed or not: More efficient relaxation cleaning is obtained for high shear stress and frequent cleaning (Figure 12). The relaxation efficiency is then determined as the ratio of the removed cake resistance at the end of the relaxation time by the cake resistance at the end of the filtration time.
It is also important to notice that the case considering tr/tf=1 is not profitable and thus a compromise between the different operational conditions is to be found.
Figure 13 shows some simulations describing the effect of relaxation when operating under different relaxation times and intensities. The considered parameter values for the simulations are reported in Table 1.
Figure 12: Relaxation efficiency versus its frequency
1 1.5 2 2.5 3 3.5 4 0 10 20 30 40 50 60 70 80 90 100
frequency (tr(min)/tf(min))
ef fi ci en cy (% ) β=5 β=10 β=20 β=40 0.5/5 1/5 2/5 5/5
Version postprint
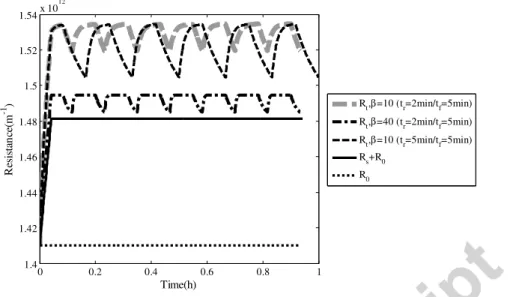
Figure 13: Relaxation effect on membrane fouling (tf : filtration time, tr : relaxation time)
Table 1: operational conditions considered to study relaxation effect
ε0 0.2 d 10-5 m k1 0.1 1013 Jp 17 L.m-2.h-1 σ.S 0.1g.L-1 X 1g.L-1
Figure 13 shows the total resistance evolution for different relaxation conditions. To obtain a complete removal of Rc, Figure 13 points out a possible solution, β=40m2.g-1 associated with a cleaning frequency of 2min relaxation every 5min of filtration. Of course the optimisation of the relaxation should correspond to the highest water production per day for example.
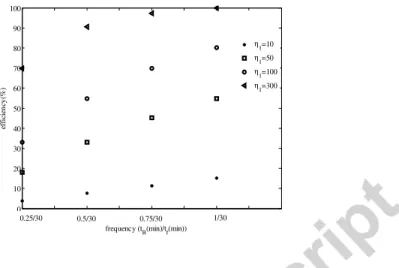
The backwash is considered as a more efficient cleaning procedure since it allows the thin layer removal and the re-opening of blocked pores. Two parameters controlling the backwash operation are highlighted in Figure 14: the backwash frequency and the cleaning efficiency η1 which controls the kinetic of the cake’s removal. The parameter η1 is proportional to the backwash flow and the easiness of deposit deconstructing. More efficient cleaning is then obtained for high η1 and frequent backwash. Under the conditions considered in these simulations
0 0.2 0.4 0.6 0.8 1 1.4 1.42 1.44 1.46 1.48 1.5 1.52 1.54x 10 12 R es is ta n ce (m -1 ) Time(h) Rt,β=10 (tr=2min/tf=5min) Rt,β=40 (tr=2min/tf=5min) Rt,β=10 (tr=5min/tf=5min) Rs+R0 R0
Version postprint
(Table 2), the total recovering of the initial membrane resistance R0 is obtained for η1 equal to 300h-1 and a backwash frequency of 1min every 30min of filtration.
Figure 14: Back-washing efficiency versus its frequency Table 2: Operational conditions considered to study backwash effect
ε0 0.2 d 10-5 m k1 0.1 1013 β 5m2.g-1 Jp 17 L.m-2.h-1 σ.S 0.1g.L-1 X 1g.L-1 7- Model validation
To validate the model including the hydraulic cleaning phases, simulations were compared to experimental data obtained when operating with a submerged MBR treating synthetic solution of biodegradable pollutants. The reactor was fed with a synthetic substrate composed with sodium acetate (CH3COONa) as the exogenous easy biodegradable organic matter resource in MBR influent, Ammonium chloride (NH4Cl) as nitrogen matter in influent. Other salts such as ammonium phosphate ((NH4)2HPO4) was also added to insure no nutriment limitation but also pH regulation. This synthetic substrate was diluted in tap water. The concentration of ammonium nitrogen in influent was set at 125 mgN-NH4/L.
1 1.5 2 2.5 3 3.5 4 4.5 5 0 10 20 30 40 50 60 70 80 90 100 frequency (t B(min)/tf(min)) ef fi ci en cy (% ) η 1=10 η 1=50 η 1=100 η 1=300 0.25/30 0.5/30 0.75/30 1/30
Version postprint
Table 3: The feed solution composition
COD (mg/L) NH4+ (mg/L) P (mg/L)
250 125 2.5
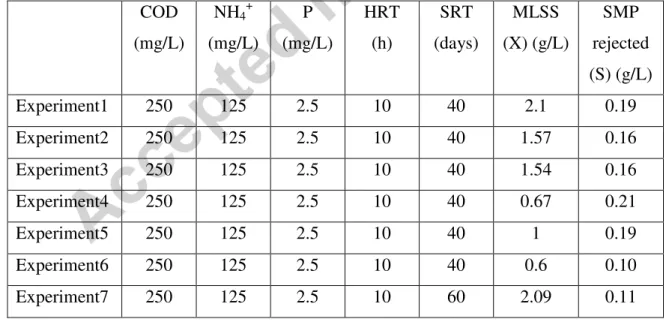
The experiments were carried out in a 60 litres lab-scale membrane bioreactor treating biodegradable organic and nitrogen pollutants. The functioning conditions are indicated in Table 4. Even if the feeding solution, the HRT and the SRT are similar for the first six experiments, the MLSS and the SMP concentrations determined show a discard. In fact, to favor rapid increasing of biomass concentration in the reactor, no sludge extraction was practiced during experiment 1, and to analyze the membrane fouling dynamics, aeration intensity was decreased in experiments 4 to 6 and a stratification of MLSS concentration was observed in the bioreactor with a lower concentration in its upper part where the membrane module was set. The values of MLSS and SMP concentrations indicated in Table 4 were then values measuring in the suspension flowing through the membrane module.
Table 4: Biological conditions of MBR functioning
COD (mg/L) NH4+ (mg/L) P (mg/L) HRT (h) SRT (days) MLSS (X) (g/L) SMP rejected (S) (g/L) Experiment1 250 125 2.5 10 40 2.1 0.19 Experiment2 250 125 2.5 10 40 1.57 0.16 Experiment3 250 125 2.5 10 40 1.54 0.16 Experiment4 250 125 2.5 10 40 0.67 0.21 Experiment5 250 125 2.5 10 40 1 0.19 Experiment6 250 125 2.5 10 40 0.6 0.10 Experiment7 250 125 2.5 10 60 2.09 0.11
The system was equipped with submerged polymeric flat sheet membranes (Microdyn-Nadir, Germany) developing a filtering surface of 0.34 m2 and presenting an effective pore diameter of 0.04 µm. Two measures were adopted to minimize membrane fouling: (i) continuous fine air
Version postprint
bubble injection throughout the membrane module by an air diffuser situated just below the membrane module, (ii) introduction of periodic relaxation and backwash periods during each filtration cycle composed by 8.75min of continuous filtration (17 L.m-2.h-1, LMH), 0.25min of relaxation, 0.75min of backwashing (8.82 L.m-2.h-1) and 0.25min of relaxation.
COD was measured in permeate and in supernatant obtained after 2 hours of mixed liquor suspension settling. The concentration of large polymer rejected by the membrane barrier is estimated at 93%, of the supernatant COD concentration (S). The concentration of particles (X) was assimilated as the mixed liquor suspended solids concentration MLSS. This concentration is expressed in terms of gCOD/L based on the measured TSS concentration and the fact that the growth of 1g of biomass involves the consumption of 1.42g of O2 (eq. 17).
(
/)
(
/)
1.42(
/)
( .17)X gCOD L = X gTSS L × gCOD gTSS eq
The permeate viscosity µ and the cake density ρs were assumed to be constant (µ=10-3 Pa.s,
ρs=103kg.m-3) as well as the intrinsic membrane resistance R0 and the permeate flux Jp (R0=1.41 1012 m-1 and Jp=17 L.m-2.h-1). A first validation has been conducted using data of continuous filtration (without membrane cleaning).
Using the least squares method programmed with matlab R2008b, model parameters were optimized in order the simulated data to fit the experimental ones. Three parameters have been optimized using three TMP data series obtained under similar experimental conditions as shown in Table 4. The optimized parameters were the cake’s particles mean size (d), the shear parameter (β) and the parameter of the porosity decrease (kε). Regarding the possible existence of different parameters sets leading to the same fitting quality, we refers to as “parameter identifiability”. The theoretical identifiability study is usually difficult to realize. It is why a numerical approach has been rather used which consists in running a large number of optimizations while varying the initial conditions for the parameters to be identified. The application of this procedure in the present case revealed a unique combination of optimized parameters.
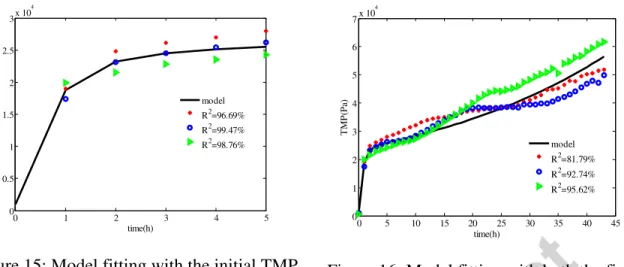
For The optimal values of these parameters, reported in Tables 5 and 7, an uncertainty study was conducted to estimate standard deviations. The optimal values have been used to fit the experimental data for the slow TMP increase phase plotted in Figure 15. To evaluate the fitting
Version postprint
operation efficiency, the coefficients of determination R2 have been calculated and are displayed in Figures 15 and 16. When fitting short term data (Figure 15), R2 values were superior to 96% for all of the three studied cases. The model describes very well the TMP evolution for this phase mainly controlled by the suspended solids deposition on the membrane surface. However when fitting with all of the experiment data (Figure 16), R2 values were slightly inferior to those obtained with the initial phase. This discard is probably due to other fouling mechanisms, actually not modelled and which would contribute to the TMP jump such as the membrane’s pores clogging, for instance due to the adsorption of soluble compounds inside the membrane’s pores.
Version postprint
Figure 15: Model fitting with the initial TMP
increase data Figure 16: Model fitting with both the first and second fouling phases data
Table 5: Model parameters for continuous filtration (Experiment 1)
Theoretical parameters Unit
ε0 0.2 - β 0.055±1.99% m2.g-1 k2 2.5 10-4±4.14% m2.h.g-1 kε 8 10-4±4.14% d 1.3 10-5±1.03% M experimental conditions X 2.98 gCOD.L-1 σ.S 0.19 gCOD.L-1 0 1 2 3 4 5 0 0.5 1 1.5 2 2.5 3x 10 4 T M P (P a) time(h) model R2=96.69% R2=99.47% R2=98.76% 0 5 10 15 20 25 30 35 40 45 0 1 2 3 4 5 6 7x 10 4 T M P (P a) time(h) model R2=81.79% R2=92.74% R2=95.62%
Version postprint
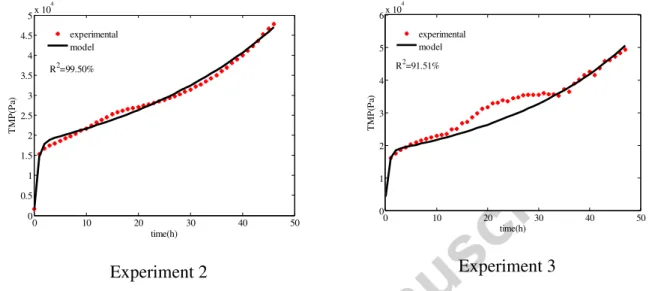
The model was also adjusted with experimental data obtained under different operational conditions (Figure 17). Even when changing the suspension characteristics the model gives a simulation closed to the experimental TMP evolution (with R2 superior to 90%).
Experiment 2 Experiment 3
Figure 17: model fitting with data obtained in different experimental conditions
During experiment, a cyclic washing was adopted as indicated. A second validation has then been realized using data collected during filtration cycle.
The model simulations were compared with three series of TMP experimental data, Figures 18-20. These data were obtained under different concentrations of suspended solids and SMP (Table 5). Using the same parameters values for β and d than those obtained in the previous model (continuous filtration data), simulations were realized and are presented in figures 18A, 19A and 20A. The values of other parameters are shown in Table 5. The simulated TMP evolution fitted well the experimental data. For each of the experimental series, the theoretical evolution, during one filtration cycle, of the SMP layer, the cake layer and the total resistances are shown in figures 18B, 19B and 20B.
The experimental data presented in figures 18A and 20A were obtained under similar operating conditions (Table 5), except for soluble polymers concentration (S). The model allows a determination of the specific mass value of the first fouling layer formed mainly by soluble polymers responsible of the 1st fouling phase, 0.1 and 0.07g/m2 respectively, with corresponding resistances of 8.1 1011 and 7.33 1011 m-1 respectively (Figures 18B and 20B). This confirms that
0 10 20 30 40 50 0 0.5 1 1.5 2 2.5 3 3.5 4 4.5 5x 10 4 T M P (P a) time(h) R2=99.50% experimental model 0 10 20 30 40 50 0 1 2 3 4 5 6x 10 4 T M P (P a) time(h) R2=91.51% experimental model
Version postprint
high SMP concentrations lead to thicker biofilm and then sharper fouling as mentioned by Pan et al. (2010) and Ho and Sung (2009) [28, 18].
When comparing the global evolution of the TMP in the cyclic and in the continuous filtration cases, the TMP increase is found to be 32 times higher in the continuous filtration case.
The figures 18B, 19B and 20B show that the relaxation effect in removing the cake layer is negligible comparing to the backwash which allows, in the studied cases, removing both of the cake layer and the thin SMP layer. Using higher shear stress (higher aeration) would improve the relaxation efficiency.
A B
Figure 18: (A) Model fitting the experimental data obtained under low shear stress (Table 5, experiment 4) (B) Different layer resistances for one cycle
A B
Figure 19: (A) Model fitting the experimental data obtained under low shear stress (Table 5, experiment 5) (B) Different layer resistances for one cycle
0 0.2 0.4 0.6 0.8 1 1.2 1.4 6 8 10 12 14 16 18 20 22 T M P (k P a) Time(h) experimental model(with washing) model(without washing) 0 1 2 3 4 5 6 7 8 9 10 1.4 1.6 1.8 2 2.2 2.4 2.6x 10 12 Time(min) R es is ta n ce (m -1) Rt Rs+R0 Rc+R0 0 0.2 0.4 0.6 0.8 1 1.2 1.4 5 10 15 20 25 30 35 T M P (k P a) Time(h) experimental model(with washing) model(without washing) 0 2 4 6 8 10 1.5 2 2.5 3 3.5 4 4.5x 10 12 Time(min) R es is ta n ce (m -1) R t R s+R0 R c+R0
Version postprint
A B
Figure 20: Model fitting the experimental data obtained under low shear stress (Table 5, experiment 6) (B) Different layer resistances for one cycle
Table 6: Model parameters for cyclic filtration under low shear stress (aeration 3m3/h)
Experiment 4 Experiment 5 Experiment 6 Unit
Theoretical parameters ε0 0.2 0.2 0.2 - β 0.055 0.055 0.055 m2.g-1 d 1.3 10-5 1.3 10-5 1.3 10-5 m k1 1.5 1013 2.5 1013 3 1013 ms 0.1 0.24 0.07 g.m-2 k2 2.5 10-4 2.5 10-4 2.5 10-4 kε 8.92 10-4 8 10-4 4.25 10-4 ߟ1 400 400 400 ߟ2 400 400 400 ߟ3 0.055 0.048 0.025 Experimental conditions X 0.95 1.42 0.85 gCOD.L-1 σ.S 0.21 0.19 0.10 gCOD.L-1
8. Effect of shear stress
Other TMP experimental data have been obtained when increasing the shear stress through increasing aeration to 6m3h-1. Our model has also been confronted to these data (Figure 21). As it may be seen, it was possible to describe the TMP variation by the cake formation model. The
0 0.2 0.4 0.6 0.8 1 1.2 1.4 6 8 10 12 14 16 18 20 T M P (k P a) Time(h) experimental
model (with washing) model (without washing)
0 1 2 3 4 5 6 7 8 9 10 1.4 1.6 1.8 2 2.2 2.4 2.6x 10 12 Time(min) R es is ta n ce (m -1) R t Rs+R0 Rc+R0
Version postprint
shear stress increase enhances the soluble polymers dragging which conducts to the 1st fouling phase disappearance corresponding to the first SMP deposit layer.
For these data, the optimized parameters are shown in Table 6. Since the shear stress has been increased, the shear parameter β value increases considerably from 0.055 (low shear stress experiments) to 9.48m2.g-1 leading to the decrease of particles size from 13 to 2.33µm. This is clearly in accordance with the fact that the particles breakdown due to the shear forces has been observed in MBR [17, 18].
Figure 21: Model fitting the experimental data obtained under high shear stress (aeration 6m3/h)
Table 7: Model parameters for cyclic filtration under high shear stress (aeration 6m3/h)
Experiment 7 Unit Theoretical parameters ε0 0.2 - Β 9.48±0.73% m2.g-1 D 2.33 10-6±0.36% m ߟ1 400 ߟ3 0.012 experimental conditions X 2.96 gCOD.L-1 σS 0.11 gCOD.L-1 0 0.1 0.2 0.3 0.4 0.5 0.6 0.7 0.8 0.9 1 7 8 9 10 11 12 13 T M P (k P a) Time(h) experimental model (with washing)
Version postprint
9. Conclusions
In this paper a new simple model has been presented to describe fouling dynamics when operating in a MBR. The model assumes that membrane fouling goes through three phases. The first phase is characterized by a TMP increase due to film development on the membrane surface, including pore blocking, due to the retention of the largest soluble compounds. The second phase is characterized by an increase of the TMP due to a cake building involving both suspended solids and SMP. Then, the latter stage reflects the progressive decrease of the cake porosity due to the SMP retention inside the cake structure including progressively a sharp TMP jump. Then, two hydraulic ways of membrane permeability regeneration have been defined. Subsequently, model simulations were compared to experimental data obtained in labscale MBR pilot and gave satisfactory fitting results. To conclude, the definition of fouling levels and its associated phenomenon are a valuable tool for tuning the right filtration parameters including the determination of relaxation and backwashing cycles.
Acknowledgements
The authors would like to acknowledge the financial support of the French National Research Agency (ANR – Creativeru), notably the TREASURE Euromed research network and the competitiveness cluster TRIMATEC, as well as the PHC UTIQUE project No. 13G1120. In addition, a deep acknowledgment to Professor Alain Rapaport for its valuable advices.
References
[1] D.W. Gao, T. Zhang, C. Y. Tang, W. M. Wu, C. Y. Wong, Y. H. Lee, D. H. Yeh, C. S. Criddle, Membrane fouling in an anaerobic membrane bioreactor: Differences in relative abundance of bacterial species in the membrane foulant layer and in suspension, J. Membr. Sci. 364 (2010) 331-338.
[2] A. Charfi, N. Ben Amar, J. Harmand, Analysis of fouling mechanisms in anaerobic membrane bioreactors, Water Res. 46 (2012) 2637-2650.
[3] D. P. Saroj, G. Guglielmi, D. Chiarani, G. Andreottola, Subcritical fouling behavior modelling of membrane bioreactors for municipal wastewater treatment: The prediction of the time to reach critical operating condition, Desalin 231 (2008) 175–181.
Version postprint
[4] S. Ognier, C. Wisniewski, A. Grasmick, Membrane bioreactor fouling in sub-critical filtration conditions: a local critical flux concept, J. Membr. Sci. 229 (2004) 171-177.
[5] J. Zhang, H. C. Chua, J. Zhou, A. G. Fane, Foactors affecting the membrane performance in submerged membrane bioreactors, J. Membr. Sci. 248 (2006) 54-66.
[6] B. D. Cho, A. G. Fane, Fouling transients in nominally sub-critical flux operation of membrane bioreactor, J. Membr. Sci. 209 (2002) 391-403.
[7] Y. Ye, P. Le Clech, V. Chen, A. G. Fane, Evolution of fouling during crossflow filtration of model EPS solutions, J. Membr. Sci. 264 (2005) 190-199.
[8] S. Ognier, C. Wisniewski, A. Grasmick, Membrane fouling during constant flux filtration in membrane bioreactors, Membr. Technol. (2002) 6-10.
[9] S. Chang, A. G. Fane, T. D. Waite, Analysis of constant permeate flow filtration using dead-end hollow fiber membranes, J. Membr. Sci. 268 (2006) 132-141.
[10] X. Y. Li, X. M. Wang, Modelling of membrane fouling in a submerged membrane bioreactor, J. Membr. Sci. 278 (2006) 151-161.
[11] R. W. Field, D. Wu, J. A. Howell, B. B. Gupta, Critical flux concept for microfiltration fouling, J. Membr. Sci. 100 (1995) 259-272.
[12] J. P. F. De Bruijn, F. N. Salazar, R. Boroquez, Membrane blocking in ultrafiltration-a new approach to fouling, Trans. IChemE C, Food Bioprod. Process. 83 (2005) 211–219.
[13] A. Zarragoitia-Gonzalez, S. Schetrite, M. Alliet, U. Jauregui-Haza, C. Albasi, Modelling of submerged membrane bioreactor: conceptual study about link between activated sludge biokinetics, aeration and fouling process, J. Membr. Sci. 325 (2008) 612-624.
[14] A. Robles, M. V. Ruano, J. Ribes, A. Seco, J. Ferrer, A filtration model applied to submerged anaerobic MBRs (SAnMBRs), J. Membr. Sci. 444 (2013) 139-147.
[15] H. J. Lin, K. Xie, B. Mahendran, D. M. Bagley, K. T. Leung, S. N. Liss, B. Q. Liao, Sludge properties and their effects on membrane fouling in submerged anaerobic membrane bioreactors (AnMBRs). Water Res. 43 (2009) 3827-3837.
Version postprint
[16] L. D. Hughes, R. W. Field, crossflow filtration of washed and unwashed yeast suspensions at constant shear under nominally sub-critical conditions, J. Membr. Sci. 280 (2006) 89-98.
[17] F. Waeger, T. Delhaye, W. Fuchs, The use of ceramic microfiltration and ultrafiltration membranes for particle removal from anaerobic digester effluents, Sep. and Purif. Technol. 73 (2010) 271-278.
[18] J. Ho, S. Sung, Effects of solid concentrations and cross-flow hydrodynamics on microfiltration of anaerobic sludge, J. Membr. Sci. 345 (2009) 142–147.
[19] M. Heran, R. Aryal, H.K. Shon, S. Vigneswaran, S. Elmaleh, A. Grasmick (2012), Determining Criteria to optimize HF SMBR control. Water Environment Research, 84 (2), pp 115-119.
[20] H. Li, A. G. Fane, H. G. L. Coster, S. Vigneswaran, Direct observation of particle deposition on the membrane surface during crossflow microfiltration, J. Membr. Sci. 149 (1998) 83-97. [21] J. Wu, P. Le-Clech, R. M. Stuetz, A. G. Fane, V. Chen, Effects of relaxation and backwashing conditions on fouling in membrane bioreactors, J. Membr. Sci. 324 (2008) 26–32. [22] I. J. Kang, S. H. Yoon, C. H. Lee, Comparison of the filtration characteristics of organic and inorganic membranes in a membrane-coupled anaerobic bioreactor, Water Res. 36 (2002) 1803-1813.
[23] Y. Lee, J. Cho, Y. Seo, W. L. Jae, K. H. Ahn, Modeling of submerged membrane bioreactor process for wastewater treatment, Desalin 146 (2002) 451-457.
[24] A. Charfi, J. Harmand, N. Ben Amar, A. Grasmick, M. Heran, Deposit membrane fouling: influence of specific cake layer resistance and tangential shear stresses, Water Science and Technology (2014) (doi: 10.2166/wst.2014.186)
[25] A. A. McCarthy, P. K. Walsh, G. Foley, Characterising the packing and dead-end filter cake compressibility of the polymorphic yeast Kluyveromyces marxianus var. marxianus NRRLy2415, J. Membr. Sci. 198 (2002) 87-94.
Version postprint
[26] K. Katsoufidou, S.G. Yiantsios, A.J. Karabelas, A study of ultrafiltration membrane fouling by humic acids and, flux recovery by backwashing: Experiments and modelling, J. Membr. Sci. 266 (2005) 40–50.
[27] S. P. Hong, T. H. Bae, T. M. Tak, S. Hong, A. Randall, Fouling control in activated sludge submerged hollow fiber membrane bioreactors, Desalin 146 (2002) 451-457.
[28] J. R. Pan, Y. C. Su, C. Huang, H. C. Lee, Effect of sludge characteristics on membrane fouling in membrane bioreactors, J. Membr. Sci. 349 (2010) 287-294.
Highlights
- A simple tool simulating the fouling dynamics during the filtration and cleaning phases, is proposed
- MBR fouling goes through three phases: film deposit, cake deposit and cake pores decrease
- Simulating the cake porosity decrease let appear the TMP jump