COMPARATIVE STUDY OF FUNDAMENTAL AND SECOND HARMONIC ICRF WAVE PROPAGATION AND DAMPING AT HIGH DENSITY IN THE ALCATOR TOKAMAK
by
Marcel P. J. Gaudreau
D. E. C. CEGEP de La
Pocatiere 1972B.S. Massachusetts Institute of Technology 1974
M.S. Massachusetts Institute of Technology 1975
Submitted in Pa'rtial Fulfillment of the Requirements for the Degree of Doctor of Science
at the
Massachusetts Institute of Technology September 1981
© Massachusetts Institute of Technology 1981
5ignature 0f Autho r ---~_~_~~~==____~I::__"""'_=___=____:_~__:_
Department 'of Eletfr1cal Engineering and Computer Science
-AjJgu£st,1981 Ce rt ;f ied by Dr. Ronald R. Parker Jhesis~perv;sor Accepted by -1 ...
COMPARATIVE STUDY OF FUNDAMENTAL AND SECOND HARMONIC ICRF WAVE PROPAGATION AND DAMPING AT HIGH DENSITY IN THE ALCATOR TOKAMAK
by
Marcel P. J. Gaudreau
Submitted to the Department of Electrical Engineering and Computer Science
in August 1981 in partial fulfillment of the requirements for the
Degree of Doctor of Science
ABSTRACT
This thesis presents a comparative study of the theoretical foundations
and experimental results of the ICRF heating experiment on the Alcator A tokamak at the MIT Plasma Fusion Center and Francis Bitter National Magnet Laboratory. Due to the versatility of the high power apparatus, the fast magnetosonic branch is used with w0 = 1,2,3,4 Wci, unlike most other ICRF
experiments. Unusually high magnetic field (Bo= 40-80 kG), plasma density
(ne = 1013 - 5 x 10¹⁴/cm3), generator frequency (fo = 90-200 MHz) and
transmitter power, with shielded and unshielded antennas, are the key para-meters of the experiment. This wide parameter range allows a direct
com-parison between fundamental and second harmonic regimes,and shielded and
unshielded antennas, our prime goals. The real and imaginary partsof the
parallel and perpendicular wave numbers are measured with extensive
magne-tic probe diagnosmagne-tics for a spectrum of plasma parameters and compared with
theory. Qualitative and quantitative evaluations of the wave structure
and scaling laws are derived analytically in simple geometries and computed
numerically for realistic plasma parameters and profiles. General figures of
merit, such as radiation resistance and quality factor, are also derived and compared with the experiment. Secondary effects of the high power wave
launching, such as changes in plasma current, density, Zeff, energetic
neutral flux, soft X-rays, neutron flux, and impurities are also discussed. Most important, a general synthesis of the many engineering, physics, and experimental problems and conclusions of the Alcator A ICRF program are
inspected in detail. Finally, the derived and experimentally determined
scaling laws and engineering constraints are used to estimate the ICRF
requirements, advantages, and potential pitfalls of the next generations of experiments on the Alcator tokamaks.
Thesis Supervisor: Dr. Ronald R. Parker
Title: Professor of Electrical Engineering and Computer Science,
Assistant Director of the Plasma Fusion Center, and
Assistant Director of the Francis Bitter National Magnet Laboratory
-2-ACKNOWLEDGEMENTS
This report was prepared at the Francis Bitter National Magnet Laboratory and the Plasma Fusion Center, and was sponsored by DOE under contract DE-ACO2-78E T 51013.A002. The author is grateful to the
Department of Energy for providing financial and technical support. The
author is also thankful to the Department of Defense, the Air Force, and in particular, Master Sergeant Philip Keysor for acquisition of the Shemya
Alaska Air Force Base FPS-17 transmitter, and guidance throughout the
logistic operations.
Much of the experimental hardware was built by a number of M.I.T.
students, in particular, Doug Gearson, Randy Fahey, Gary Spletter, Matthew
Besen and Brian Abbanat who received Bachelor of Science Thesis credit for
their work. Several professionals also worked many long hours on the project. Especially helpful were Faith Knowlton for her work on numerical simulations, and Dr. Boyd Blackwell for the many instructive discussions.
The author is indebted to Dr. D. Bruce Montgomery, Assistant Director
of the National Magnet Laboratory and to Dr. James Melcher, the author's academic advisor, for their continued encouragement during the many difficult
phases of the author's education and experimental work at M.I.T.
The author is grateful to Cornelis Holtjer, Donald Lavoie, Peter Besen,
and Don Shulsinger, some of the best engineers in the field, for their unfailing technical help.
The author had the privilege of working under the supervision of Dr. Ronald R. Parker, Professor of Electrical Engineering and Computer
Science, and Associate Director of the Plasma Fusion Center and Francis Bitter
-3-National Magnet Laboratory. Ron was always the primary instigator and energy source of my effort during and even before this project.
Finally, the author is deeply indebted to Michael Sansone,who was the
single most important designer, builder and co-investigator with the author on this project and many other enterprises not mentioned in this thesis.
-4-To My Parents
Joseph and FrancoiseI
-5-TABLE OF CONTENTS ABSTRACT2... ACKNOWLEDGEMENTS3... 3 DEDICATION... ... 5 TABLE OF CONTENTS...6 I. INTRODUCTION 1. Motivation... 11
2. Methodology and Overview... 13
3. Summary of Related Work...17
II. EXPERIMENTAL RESULTS 1. Available Parameter Space and Principal New Results... 19
1.1 Available Parameter Space... 19
1.2 Principal New Experimental Results... 23
2. Low Power Wave Measurements...29
2.1 High Q Eigenmodes... ... 29
2.2 Wave Amplitude Measurements...41
2.3 Wave Phase Measurements... 50
2.4 Radiation Resistance and Magnetic Field Scans...60
2.5 Wave Coupling Experiments...72
3. Medium Power Heating Experiments...75
3.1 High Density Regime...75
3.2 Low Density Regime...87
3.3 Impurities and Radiation Measurements...89
III. EXPERIMENTAL APPARATUS 1. Transmitter Chain and Engineering Support...97
-6-Page
1.1 Transmitter Chain... ... . 97
1.2 High Power DC and Control Systems...104
2. Matching and Launching Structures... 110 •
2.1 Basic Matching.and Launching System... 110
2.2 A1 Antenna System and Engineering Constraints... 116
2.3 Matching Resonator... ... 131
2.4 A2 Antenna System... ... 138
2.5 A4 Antenna System and Faraday Shields... 147
2.6 A3, A5, A6 Antenna Systems...157
3. Extensive Plasma and RF Diagnostics...163
3.1 RF Power, Radiation Resistance and Data Acquisition... 166
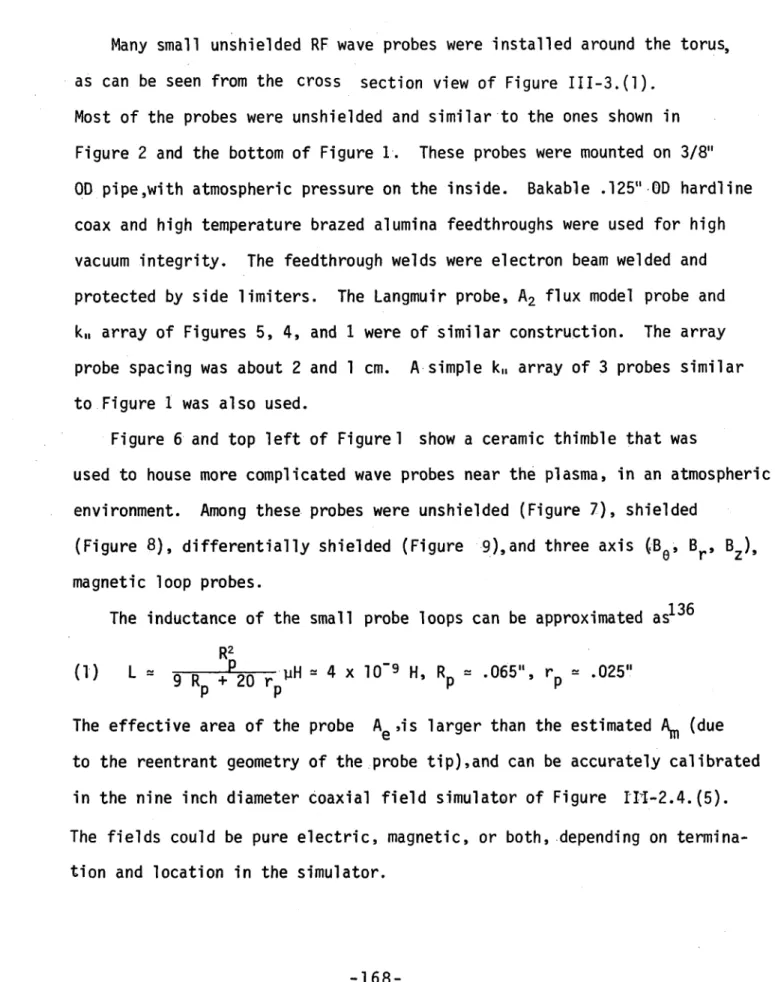
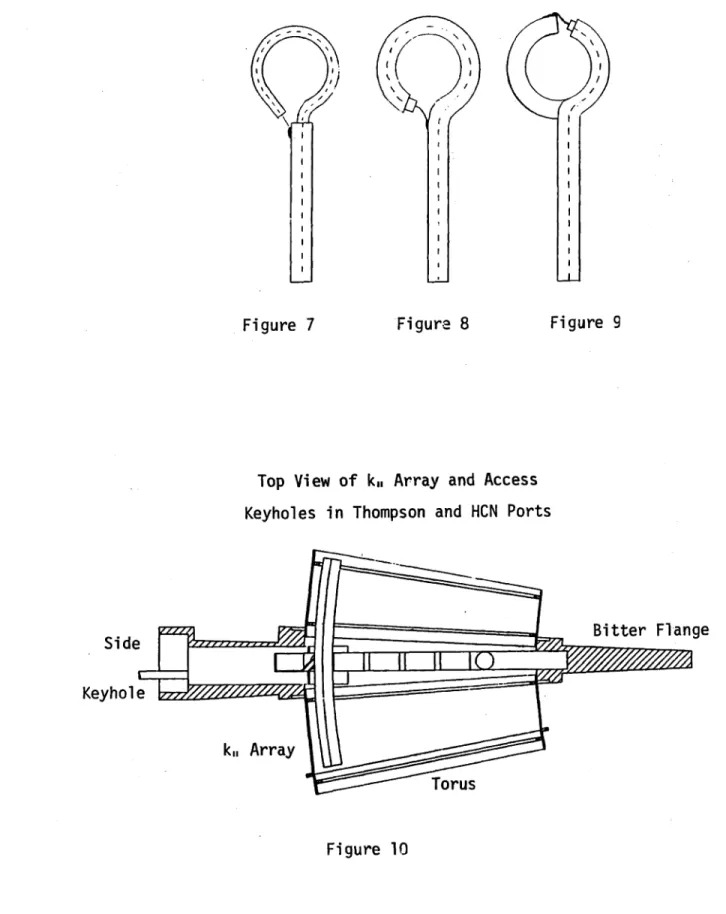
3.2 RF Wave Probes 'and Arrays...168
3.3 RF Wave Correlators...177
3.4 Plasma Edge and RF Breakdown Diagnostics... 180
3.5 Charge Exchange Diagnostic...184
3.6 Bolometers and Superbanana Trapped Particle Detectors.. 191
IV. THEORETICAL WAVE MODELS AND COMPUTATIONS 1. Introduction, First Order Models and Approximations...197
1.1 Eigenmode Wave Field Approximations in Toroidal Geometry.. aa ...a a a a a* 198 1.2 Theoretical Radiation Resistance ... 202
1.3 Experimental Radiation Resistance...206
2. Cold Plasma Approximation and Cartesian Dispersion Relations...207
2.1 Cold Dielectric Tensor, Wave Equation and Dispersion Relation... 207
-7-Page 2.2 Zero Electron Mass Dispersion Relation and
Polarization... 212
2.3 Inhomogeneous Cartesian Waveguide and WKB... 217
2.4 Finite Electron Mass, Fast and Slow Wave Dispersion Relations... 225
2.5 I/R Magnetic Field, Two lon Species and the Two lon-lon Hybrid Resonance... ... 228
2.6 Plasma Edge Lower Hybrid Resonance and Ez... 233
2.7 Fast Wave Energy Density...235
3. Homogeneous Plasma Cylindrical Waveguide Field Solution... 237
3.1 Zero Electron Mass Fast Wave Dispersion Relation and Mode Cutoff...237
3.2 Number of Propagating Eigenmodes at High Density... 242
3.3 Mode Splitting.,..-...•... .- s a...245
4. Hot Plasma Model and Damping Mechanisms... 248
4.1 Wall Damping...249
4.2 Cyclotron Damping...251
4.3 Electron Landau Damping and Transit Time Magnetic Pumping... * 0...a 258 4.4 The Hot Dielectric Tensor and Approximations... 262
4.5 Collisional Damping... 268
5. Inhomogeneous Cylindrical Plasma Numerical Model...272
5.1 Inhomogeneous Plasma Eigenmode Differential Equations and Large r Approximation... ... 272
5.2 TFR-EZ Code Structure...o ... 275
5.3 Field Profiles at High Density... ... 279
5.4 Full Inhomogeneous Eigenmode Dispersion Relations... 291
6. Stochastic Mode Stacking... 297
6.1 Introduction...297... ...297
6.2 Coherent and Stochastic Stacking... 300
-8-6.3 Mode Spacing and Onset...
6.4 Quality Factor...
6.5 Poloidal Mode Stacking... 6.6 Stochastic Mode Stacking... 6.7 Coherent and Stochastic Field Simulations...
7. The Single Perpendicular Pass Regime...
7.1 Single Perpendicular Pass Radiation Resistance... 7.2 Group Velocity and Simple Ray Tracing...
7.3 Tunneling and Poloidal Magnetic Field Effects in the
TIIH Regime ...
V. SYNTHESIS, RECOMMENDATIONS FOR FURTHER WORK, AND CONCLUSIONS
1. Synthesis ...
2. Recommendations for Further Work...
3. Conclusion... APPENDICE 1. 2. 3.
4.
5. 6. ESAlfv'en Regime Approximations...
Table of Formulas and Typical Values...
2 x 2 Dispersion Relation Code...
Inhomogeneous Plasma Heuristic Code...
3 x 3 Analytic Dispersion Relations Code...
3 x 3, 3 Species Computational Bo/R Dispersion Relations Code
7. TIIH, 2 Dimensional Code... 8- Inhomogeneous Plasma Cylindrical Eigenmode Fields and
Damping Code ...
9. Stochastic Mode Stacking Code...
303 305 309 312 317 333 333 342 348 353 359 361 362 369 371 372 373 374 376 377 381
-9-Page 10. Single Perpendicular Pass Radiation Resistance k,, Spectra
Code... .... ... 383
11. Inhomogeneous Plasma Cylindrical Eigenmode Dispersion Relation Code... ... .. .. 384
12. Engineering Diagrams... 387
REFERENCES... 395
BIOGRAPHICAL NOTE... ... ... 405
-10-I. INTRODUCTION
I-1. Motivation
Since the early 1950's, extensive work in the area of plasma physics
has been undertaken to achieve controlled thermonuclear fusion, which may
be the ultimate source of energy for the next century1. There are two main
steps to demonstrate scientific feasibility of controlled thermonuclear
fusion power. The first is to achieve sufficient levels of the product of
plasma density n, and energy confinement time T, known as Lawson's
cri-terion nu = 1014 sec/cm3
. Many schemes for attaining these high levels
of nr have been proposed, an example being the Alcator tokamak2. Lawson's
criterion is expected to be achieved within the next decade of large scale experiments.
The second step, which certainly has not been achieved, is to attain
the formidable temperatures required for fusion (= 10B°K). Again, several
schemes have been proposed and tried with some success. Ohmic heating of the plasma by intense currents has achieved consistently high temperatures
in tokamaks3, but fails in the thermonuclear regime since the plasma
resistivity1 drops as Te-3/ 2. Injection of high energy neutral
particles5 has so far been successful in low density plasmas,but may be
impractical in a high density reactor because of the low efficiency of the extremely high energy beams required for good penetration to the plasma
center4. For many years, radio frequency heating of these plasmas has
appeared attractive. A wide spectrum of wave frequencies is available at high power and good efficiency with current technology. Several specific frequency regimes have been tested, in particular, low frequency (= 106 Hz)
-11-Alfvyn heating6, medium frequency (=
3 x 10⁷ Hz) Ion Cyclotron Range of
Frequencies heating (ICRF)7, high frequency ( 109 Hz) lower hybrid8, and
ultra high frequency ( 3 x 10¹⁰ Hz) electron cyclotron heating9. Each
regime has its specific theoretical and practical advantages, disadvantages and,especially,unknowns.
For the moment, the Ion Cyclotron Range of Frequencies is the prime candidate because of the relatively good agreement between theory and
experiment,and compatibility with engineering constraints10. Even within
the Ion Cyclotron Range of Frequencies, there are fundamentally different regimes of wave propagation and absorption, which can be broadly classified in terms of harmonic number of the ion gyrofrequency.
For the present work,we will investigate ICRF heating in a high density tokamak, and attempt to identify the most promising wave launching structures,
wave frequency, and plasma parameters for efficient heating2 1
Almost all recent ICRF work, has been in one particular regime: the
minority fundamental ion gyrofrequency regime11 ,12. Furthermore, the
con-ditions have always been in tokamak plasmas in similar regimes,
ne = 3 x 101 3/cm3, B.o 20 kg, fo = 25 MHz, all being significantly short
of the high field and high density thermonuclear regime. The Alcator ICRF
experiment1 3 in these respects is different since it is a high field (= 60
kG), high central current density (=1,500 amps/cm2), high density (= 3 x
101'/cm 3) and high frequency (fci = 100 MHz) experiment14,15. Fortunately,
for comparison, the experiment can also be run at moderately low fields, current density, plasma density, and frequency. The wide range of
parame-ters and their proximity to the reactor regimel6 make Alcator an almost
ideal test machine for RF heating.
-12-1-2. Methodology and Overview
The main goals of this ICRF program are to identify the proper
meter regime which produces efficient heating. The single most important para-meter is the harmonic number, i.e., fundamental, second harmonic or even
higher harmonics of the ion gyrofrequency. The harmonic number, coupled with working gas and toroidal field, fully determine the transmitter chain
and antenna operating frequency, a non-trivial amount of expensive and
complicated hardware to be adjusted to a particular regime. A prime objective is to be able to change the parameters of the experiment and
still satisfy w, = n eB for different harmonic numbers n. Two M
frequencies, 183.5, 92 MHz, four gases, H1, D2, He3, He4 and toroidal
fields from 30-90 kg enable n to be changed over a wide range (n = 1, 2, 4, 8) in different parts of parameter space.
The second issue is the selection of proper launching structure. This is an especially sensitive topic in the fusion RF community,and
con-siderable controversy exists over fundamental issues, in particular, whether
or not the antenna should be shielded 17. Many other secondary but
nevertheless essential issues are the choice of location, insulation, and
method of RF feeding of the antenna18. As far as achieving this second
goal,the Alcator experiment has a severe handicap; almost total lack of
space for insertion, access, and location of antenna near the plasma2.
However, several all metal shielded and unshielded antennas (Section I1-2) were built and tested,and experimental results showed small but accceptable
loading resistances of a few ohmsl 3. An innovative all metal antenna and
matching system with the vacuum breaks at a point where there is little reactive power is also proposed (Section III-2-6),and could be a great
-13-step forward in Alcator ICRF antenna technology and performance.
To achieve the above goals, a clear understanding of the basic physics is necessary as well as a quantitative evaluation of the theory (Chapter IV). First, a more or less complete review of the current theory7,19-22 is warranted to ensure that the approximations are still valid at high field, high frequency, and in particular, high density.
The physics of the problem may be divided broadly into three areas7, 89;
wave launching and propagation, wave damping, and the physics of heating. There are three basic aspects of the wave propagation problem:
(1) the dielectric tensor, wave equation, dispersion relation and polarization7,4 5.
(2) the homogeneous and inhomogeneous plasma cylindrical wave field solutions2 1 ,2 2,45,46; and
(3) stochastic mode stacking24,
The above aspects are first treated in conventional rigorous analytical ways with approximations justified quantitatively in the Alcator
regime3.
Successively more complicated models (Sections IV- 1-7) are developed starting with cold uniform infinite plasma with a single ion spe-cies and zero electron mass. The final theory includes hot plasma effects to first order, finite electron mass, two ion species, cylindrical geometry, I/R toroidal field, and inhomogeneous density profile21,22,26,27. A tangible
physi-cal explanation of the mathematiphysi-cal results is given whenever possible. Second, the wave fields are numerically evaluated with realistic plasma parameters and profiles28,29 and compared with experimental observations.
A multitude of important measurable quantities is also calculated in the
-14-same manner. Two prime examples are antenna loading resistance and RF signals from magnetic probes distributed around the torus.
The second facet of the problem is wave damping. The many wave damping
mechanisms7 ,21 ,2 6 ,30 ,3 1 are derived in the high density regime,and again we
try to draw simple, intuitive,.qualitative understanding as well as a quan-titative evaluation and comparison with the experiment. Damping depends on the theoretical and experimental results of wave propagation. Damping may also significantly modify the propagation picture, especially on sensitive
parameters such as radiation resistance32.
The last theoretical aspect is the physics of heating, and we will con-centrate on the parameters that directly affect the plasma diagnostics
used for monitoring heating, or the parameters that are likely to
modify the wave propagation or damping. A few good examples are the ion distribution function as inferred from the fast neutral spectrum monitored
by charge exchange analyzer3,33-38, neutron flux39, plasma current and
density73, soft X-ray radiation39, edge temperature ,and density as measured
by Langmuir probe2 9.
The actual experiment is in the form of multi-dimensional scans to map out the different functions of the multitude of RF and plasma parameter
combinations. This results in experimental scaling laws4 0 that are
com-pared with theory. A good example of this is that, experimentally, antenna
loading resistance RR linearly increases with electron density1 3. Loading
resistance also increases with mass density, i.e., RR is larger in
deut-erium than in hydrogen, but on the other hand, He 3 or He4 loading resistance
is very small4 1'4 2(ChapterlI ). Until now, there has been no theory that satis-factorily explains these effects, and they have not been seen in any other
experiment. Plausible new explanations are discussed in detail, especially in light of "Stochastic Mode Stacking" (Section IV-6), a new concept deve-loped in this work that refers to simultaneous excitation of a number of randomly phased toroidal eigenmodes, which may profoundly affect the wave structure at high density23-25'93
The conclusion to this work will consist of a tentative synthesis of the many interacting processes and parameters of the experiment,as well as recommendations for further investigation.
Il.aassa~Far~-·.u----1-3. Summary of Related Work
The relatively new Ion Cyclotron Range of Frequencies (ICRF)
regime43 has evolved out of the Ion Cyclotron Resonant Heating (ICRH)
scheme in the older magnetic confinement devices like the stellarator44.
Much of the theory for wave excitation and propagation was then summarized
in two books by T.H. Stix4 5 and Allis et al. 4 6, and the formulation and notation are still widely accepted.
The fundamental difference between ICRH and ICRF is that they each use a
different branch of the wave dispersion relation7. ICRH used the slow
branch, also called the ion cyclotron wave, at frequencies near or below
the ion cyclotron frequency. The new (1970)4 3 ICRF uses the fast branch, also called the fast wave or fast magnetosonic wave, and the wave is
usually carried by a majority ion component at some low harmonic number. The ion cyclotron wave is evanescent under these conditions7.
Many national laboratories and universities throughout the world are involved in ICRF,but the most important are located in the U.S. (Princeton
University, Princeton, NJ), France (TFR, Fontenay- aux- Roses), and Japan
(Japan Atomic Energy Institute Tokai, Ibaraki). Princeton has been in the
field of RF heating for about two decades,and has developed both ICRH and
ICRF through the Model C Stellarator 4 4, the Adiabatic Toroidal Compressor
(ATC) 1 1, and finally the Princeton Large Torus (PLT) 1 2. Much of the
literature is by T.H. Stix7,93,4 5, F.J. Paoloni 1 9 , 4 7, F.W. Perkins48, J.C.
Hosea4 9- 50, P.L. Colestock51, and D.G. Swanson2 0. The TFR group is newer, but has been producing consistently good experimental data and theory, and
is headed by J. Adams21,52,54 and J. Jaquinot2 2, 5 3 , 5 5 . Several other institutions56 also have published good work, particularly the
-17-University of Wisconsin (Madison, WI) 1 6 , 9 9 , 2 6 , 2 7, but their confinement
device's plasma parameters are usually remote from the high density regime5 7
For this work, three review publications broadly define current theory
and technology ,and contain the foundations of this program:
- The Theory of Plasma Waves, T.H. Stix, McGraw-Hill, New York (1962).
- "Fast Wave Heating of a Two Component Plasma," T.H. Stix, Nuclear
Fusion 15, 737 (1975).
- "Eigenmode Field Structure of the Fast Magnetosonic Wave in a Tokamak
and Loading Impedence of Coupling Structures," J. Adams and J. Jaquinot, EUR-CEA-FC-886 (April, 1977).
State of the art in ICRF is well summarized in a number of papers
101-106
presented at the 8th International Conference on plasma physics(Brussels, July, 1980), and the Fourth Topical Conference on RF Heating in plasma 107-115(University of Texas, February, 1981).
II. EXPERIMENTAL RESULTS
II-1. Available Parameter Space and Principal New Results
II-1.1. Available parameter space
The experiment was usually run in the form of multi-dimensional
parameter scans. The basic methodology was to map out the various plasma and wave processes by independently varying each parameter at a time over as wide a range as possible, with as many other different parameter
combinations as possible,while monitoring all the diagnostics. The main
parameters that could be independently varied were:
(1) RF power from .1 W to 100 kW
(2) Toroidal field from 40 to 80 kG
(3) Resonance layer position from 30 to 70 cm (4) Plasma density from 1013 to 5 x 10¹⁴/cm3 (5) Wave frequency 90, 180 (50, 360) MHz (6) RF spectrum width up to 2 MHz
(7) Plasma current from 50 to 250 kA (8) Working gas, H', D2, He3, He"
(9) Minority concentration from 1 to 100% (10) Plasma radius from 9 to 10 cm
(11) Antenna loop area from 5 to 25 cm2
(12) Probe radial position from 9 to 13 cm
(13) Shielded or unshielded antenna
(14) Antenna phasing m = 0 or m = 1
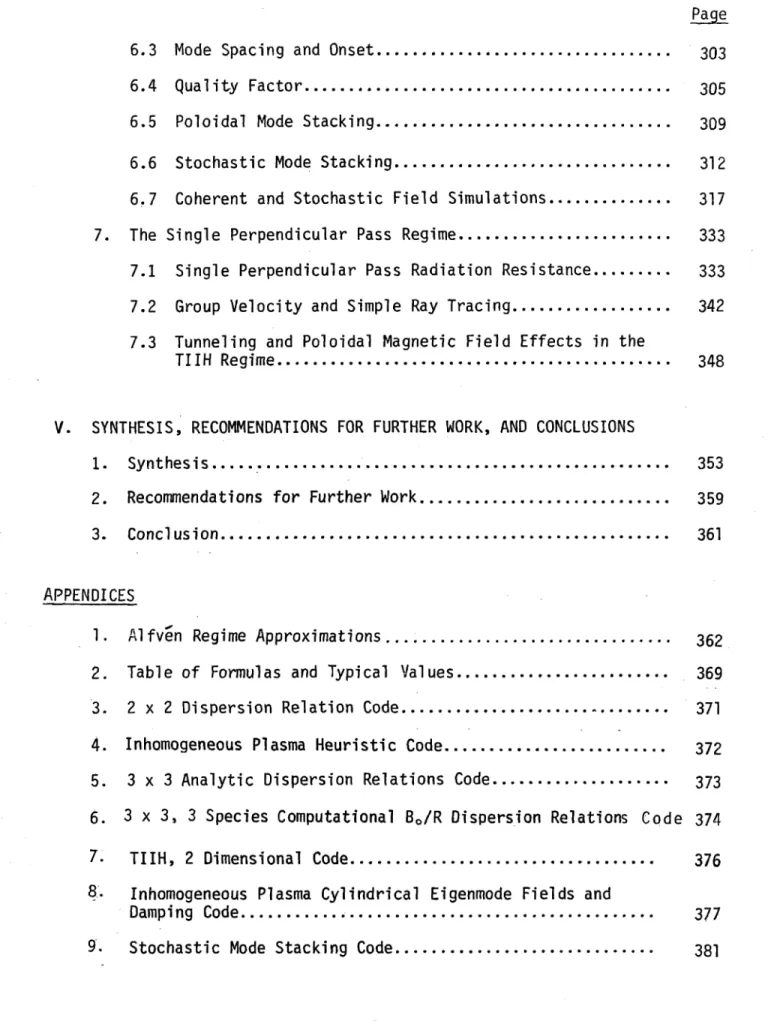
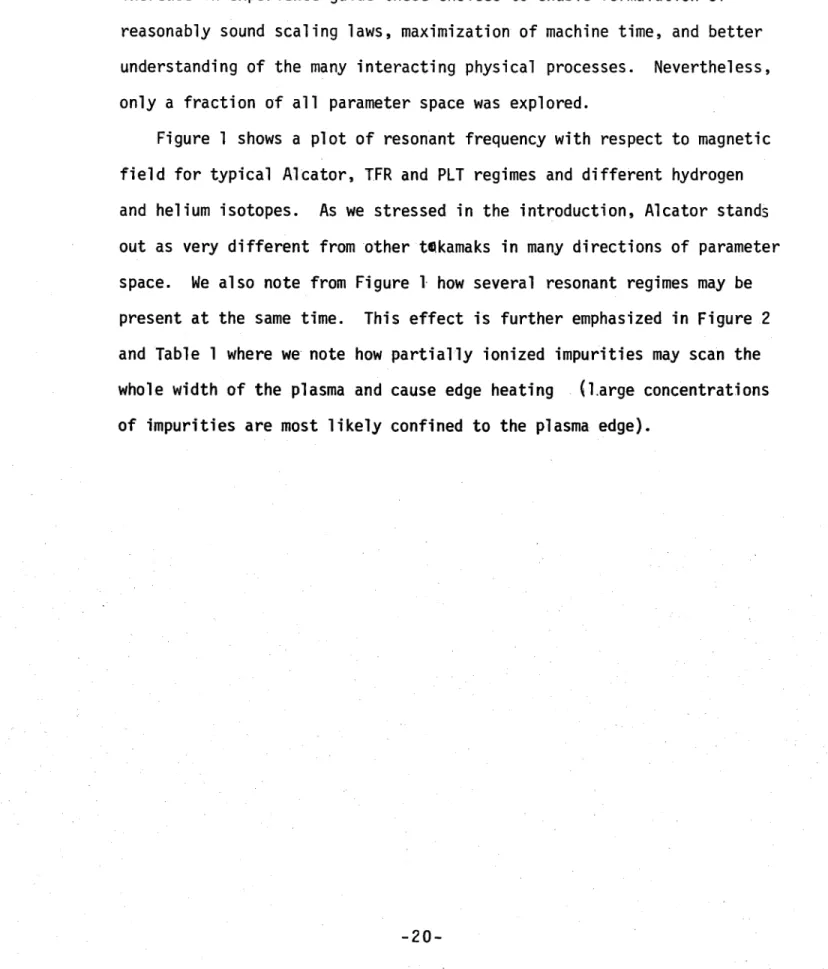
-19-This represents considerable amounts of machine time,and efficient, judicious choices of parameter scans are necessary. Theory and gradual
increase in experience guide these choices to enable formulation of reasonably sound scaling laws, maximization of machine time, and better understanding of the many interacting physical processes. Nevertheless, only a fraction of all parameter space was explored.
Figure 1 shows a plot of resonant frequency with respect to magnetic field for typical Alcator, TFR and PLT regimes and different hydrogen and helium isotopes. As we stressed in the introduction, Alcator stands out as very different from other takamaks in many directions of parameter space. We also note from Figure 1 how several resonant regimes may be present at the same time. This effect is further emphasized in Figure 2 and Table 1 where we note how partially ionized impurities may scan the whole width of the plasma and cause edge heating (l.arge concentrations of impurities are most likely confined to the plasma edge).
-20-Table 1
Normalized cyclotron frequencies and refractive indicies
gas (ne, Bo = constant)
H1 D2 He3 He4 Fully Ionized Impuri ties Partially Ionized Impuri ties c p 1, .5 .667 .5 to.5
1
to
.5
nA 1. 1.41 .866 1.2 to
/v
LII
-I
-21-- -21-- I'··-21--
I
(9A) pLJoI LepP~o.L co f- L 61)-ct n C O CL-10 o aC C 0 o4-o CI> c E
t
o 0; C-,C>Co
o
o
o
a
S(V't) ;uanj3 au6eW ep•pIoJL •' _N ca E U 0 •.-.43 or Co -o or-to cS er- LL- I-U-o "O a * ooS-(zHW)
Rouanbae.j-22-11-1.2. Principal new experimental results
The most important products of this research are sound experimental
results that preferably can be explained by theory. To date,there are
many important questions that need to be answered, most of which are still unexplored in the high field, high frequency, and high density regime.
The first question is whether or not the minority or second harmonic regime should be used. This is a far reaching question and needs much consideration, many parameter scans and is, of course answered with best heating and engi-neering compatibility.
The second question is whether the antenna should be shielded or not. This is answered for Alcator A by comparing the performance of the A1, A2, and A4 antenna over a wide range of experimental conditions.
Third, also of utmost importance, and closely related to the
first two questions, is the effect of density, working gas, frequency. antenna loop area, shielding, RF power and wave Q on antenna loading Also correlations between RR, H light, impurities, disruptions, X-rays,
etc., are important and not well understood.
Fourth, what are the predominant wave damping mechanisms, near-field power losses, and power deposition profiles? This can be answered by changing the most critical parameters of particular processes, and noting changes in field structure and heating efficiency. A prime example is the effect of the resonant layer position on antenna loading, RF probe signals, and the charge exchange neutral spectra. Wall losses can be directly calculated
from probe signals. Near-field losses could be affected by antenna shielding, etc.
-23-Fifth, what is the wave field structure? In particular, what modes
are predominantly excited, and how are they affected by other parameters such as toroidal field, ion mass, and electron density. Is the cold plasma dispersion relation valid? What is the role of surface waves?
This set of questions will be answeredby detailed study of the RF probe
signal phase measurements and comparison with theory.
Sixth, is what is the role of stochastic mode stacking ? How
many modes are excited simultaneously ? What are their
Q's? Does it explain the increase in radiation resistance and the satura-tion of probe signals with density? This will be tentatively answered by extensive simulations and comparison with experimental values of RR and probe signals and phases. Finally, does large k,, mean small k,,making second harmonical damping small, leading to a natural selection of undamped modes of high Q and RR?
All these questions,and many more omitted here, are not fully answered, but much light is shed on the basic issues. Tables 1 to 4 summarize some of the basic experimental results that will be discussed in this
chapter. The results are broadly categorized as wave propagation (Table 1),
wave coupling (Table 2), wave damping (Table 3) and heating (Table 4). In
this chapter,voltages and currents will always be referred to by their RMS
Peak to Peak)
value (
)2
-24-Table 1
Wave Propagation Measurements from Magnetic Probes Around Torus
- Large number of high Q, closely packed eigenmodes
- Apparent mode cutoff below ne = 0/cm''3
- No significant decrease in amplitude in the toroidal direction, - Magnitude compatible with radiation resistance and stochastic
mode stacking
- Be, Br, Bz , at edge, all have roughly same magnitude ( 3 axis probes
in ceramic thimble)
- 20 cm long, k,, array shows nonuniform wave structure along torus (short wavelength stochastic mode stacking)
- Large apparent k,, = .5 cm-1, hence significant evanescent region at the edge
- k,, fringes show positive going sawteeth
- Electrostatic probe may not contain same phase information (tentative) - Small k from relative phases between probes at different poloidal
positions
-25-Table 2
Antenna Loading Resistance
- Three antennas tested
A1 electrostatically shielded
A2 bare metal, slotted limiters each side
A4 electrostatically shielded, slotted limiters
each side
- RR increases linearly with density
- RR essentially independent of Ip, BO, RF power
- RR roughly increases as Wo2
RR
- RR roughly unaffected by Faraday shield (taking into account antenna
geometry)
- At 180 MHz, H2 and D2 show similar resistances (D2 slightly larger
than H2) and He exhibits a much smaller resistance
- R sensitive to plasma position (RR decreases at end of shot when p asma moves inward)
- RR and H, light have similar time evolution
- Multipactor regime is very wide in the new large ceramic breaks
(5W - 500W)
- RR is roughly proportional to antenna length squared
- RR is roughly independent of antenna phasing (m = 0,1)
-26-N oI E I r a 1N r I " -O 3 o- r -L U 0 0 II 0-CC S-0L N I--- r r" C). o 3 Or S 0 3 0 "-- 3-ao 5-II CC O XQ I= 4-EI C r-2 0 -r
C
00S r--..
CO
oo 21 21 21 S I . V1 " 1 I ° (f "") •) LI) U) S 4..C--(] >jor-O I CO 4-S0• O s o--- E O -I.,-r- I 4 ,r--0 -0 -)- r* -. eOr 4. Q ). 0 -9- 4C C. P = ---. )0 -C C--0 L . -r- I -.0 C u 4-J. 3 E 4-3 -- L--O U :C•v 4- ) (D -0elo0- " to •to %Z ) L=( ) r0 -r-0 .. U -O LC(O e Cr-r I E . -- r-rtor-0)0a
An
0
to W W •{:: ::k::inL S4-) , 4, -aomn ) Q0 o CF LLO 1i= cc:
2:L.
al
-27-E E-= S., CL r -o E0 L4 04 4-0o SCd o 0 0 .-to OTable 4
Medium Power Heating Experiments
High Density:
Typical Parameters ne = 2 - 3 x 10c14cm- 3, Ip = 150 KA
B = 60 kG, 50% H, 50% D (also 100% H or D)
f = 180 MHz = 2FCH = 4FCD P = 30 - 100 kW
Results - Energetic H & D tails (>5 Kev) with short
decay times (<100 ps)
- 30 - 50% increase in soft X-rays
- Bolometric measurement indicates an increase
in (fast particles/radiation) flux
propor-tional to the RF input power
- 30% increase in Ha light both at the antenna and around the torus
- Some evidence of light impurities (extreme UV
spectra)
- Small dip in neutron production
- No significant change in Ip, Vloop, hard X-rays, ne
- With carbon limiter:
- 10% density increase
- carbon deposit on antenna
- no consistent increase in energetic
neutrals Low Density:
- = 5 x 1013 cm3, deuterium (4 Wcm )
- Very energetic ion tail formation (both early and at peak of discharge)
II-2. Low Power Wave Measurements 11-2.1. High Q eigenmodes
In every case examined, except those at high density in the minority
regime, high Q closely packed eigenmodes were observed. An apparent mode cutoff was also observed at about 101 3/cm.
Density measurements below
3 x 10¹³/cm3 were
very crude since the resolution of the alcohol
interferometer was about 10'3/cm3.
Particle recycling usually keeps
the density above 2 x 10"3/cm3. As expected, cutoff was much easier to
reach at 90 MHz than at 200 MHz because kA a to.
Figure 1 shows the plasma current (~150 kA), electron line average density (101' cm-n/fringe), RF pulse timing, forward (58 KW) and reflected voltages (9 kW), antenna current (150 Amps RMS) and a probe signal from
the Thomson port for a typical high density shot at 180 MHz (2WcH' 4mcD )
Figure 2 shows the antenna current, probe signal and square law detected
k,, array probe signals for a medium density shot. Several important
con-clusions can be drawn from these two Figures. First, we obviously see
dozens of eigenmode peaks in as little as 8 msec (in agreement with IV-6.3.).
Second ,these eigenmodes are very closely packed, overlap, and constitute a virtual continuum. Nevertheless, some resonances are larger than others (because of higher Q or coherent stacking of two modes ),nd cause dips in the antenna current. The peaks in the probe signal do not
necessarily line up with the dips in the antenna current because, with
many eigenmodes, fields add differently at different locations around the torus. This effect is further emphasized in Figure 2,where the different probes are only a few centimeters apart along z (111-3.2), and show qualitatively the same behavior, but with some small but
clearly discernable differences, implying the presence of stochastic
stacking of relatively short wavelength eigenmodes (- array length).
Figures 3 and 4 show probe signals at very low density (=1013/cm3)
where the eigenmode resonances are well separated, and can be compared
to Figures IV-6.7.(3) - (9). From Figure 3 (Min/Max = 7) and equation
IV-6.2(7), we can calculate the damping length as
(1) 1/k = R R 4.5 meters
i A
The eigenmode Q can be crudely estimated from equations IV-6.4.( 6) and
IV -6.4421) as kA .2 (2) Q
4k
44
x
2
2x
10
13 25 at low density 1 100 at high density 2n 2ne 2 x 10³/cm 200 at either low or (3)Q
e 9An n 10 13/cm) -4S-e At 10- sec)10sec high density
Although these two methods should be redundant, the large discrepancy is easily justified by the crudeness of IV-6.4.(6) (k,, is not known),
and the gross inaccuracy of an/9t. FR/FA is also underestimated, since
the antenna current dips (FR is underestimated),and several modes exist (skirts overlap and thus FA is overestimated).
Figure 3 also shows an A cos t signal of two k,, array probe signals. Although the magnitude of probe 76 is almost identical to 77, their
phases are considerably different, as expected.
Figures 4 and 5 show probe signals at 101" and 2 x 10"/cm3 line
average densities and 200 MHz. At 10'4/cm3,the eigenmodes are still
quite discrete, and mode stacking is only partial. At 2 x 101"/cm 3
-30-and above, the individual modes are more difficult to discern, -30-and radiation resistance spikes disappear, in agreement with I'V-6.7., where we concluded that probe signals would always be "noisier" than RR.
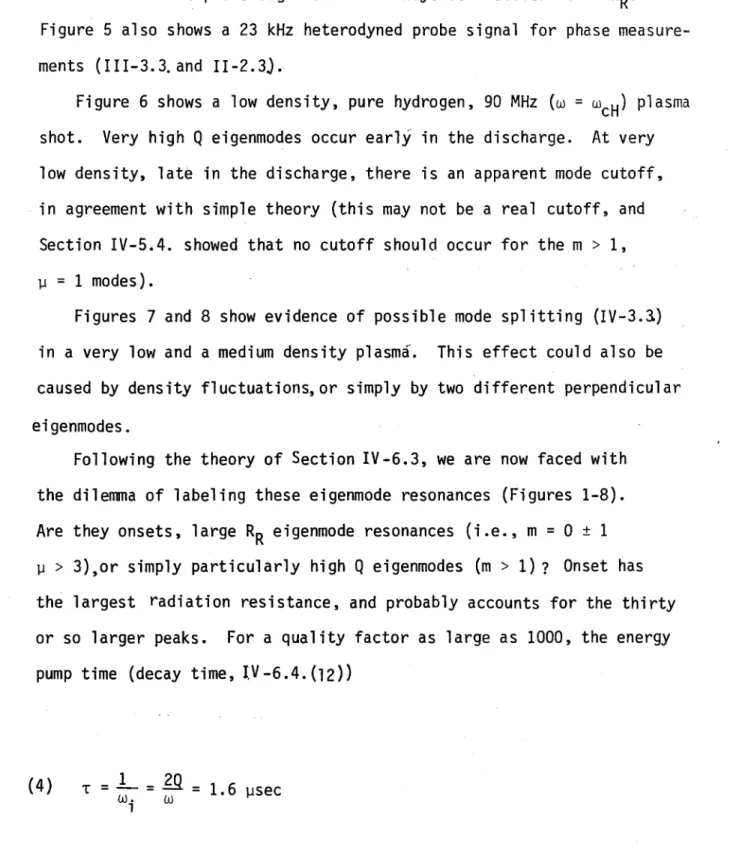
Figure 5 also shows a 23 kHz heterodyned probe signal for phase
measure-ments (III-3.3. and 11-2.3).
Figure 6 shows a low density, pure hydrogen, 90 MHz (w = WcH) plasma
shot. Very high Q eigenmodes occur early in the discharge. At very low density, late in the discharge, there is an apparent mode cutoff, in agreement with simple theory (this may not be a real cutoff, and
Section IV-5.4. showed that no cutoff should occur for the m > 1, I = 1 modes).
Figures 7 and 8 show evidence of possible mode splitting (IV-3.3) in a very low and a medium density plasma. This effect could also be caused by density fluctuations,or simply by two different perpendicular eigenmodes.
Following the theory of Section IV-6.3, we are now faced with
the dilemma of labeling these eigenmode resonances (Figures 1-8). Are they onsets, large RR eigenmode resonances (i.e., m = 0 ± 1
p > 3),or simply particularly high Q eigenmodes (m > 1)? Onset has
the largest radiation resistance, and probably accounts for the thirty
or so larger peaks. For a quality factor as large as 1000, the energy
pump time (decay time, IV-6.4. (12))
(4) T = 1 1. j) L" = 1.6 pisec
1
-31-is much less than any experimental resonance width. From Figures
IV-5.4.(3-14), we can approximately write
(5)
ak,,
10-14 cm2 an + 0 for ' = 1, m > 1 + O for P > 1 (6) k, k,, an 50 cm'l sec- I 10' cm' sec1) t an att and for (7) Ak,, = ki 10-3/cm (1/k i = 10 meters) we havekl-(8) At
at
Ak,,
20 p,
sec
which is much longer than the pump time. 1
Until now, we have assumed RR a near onset. Taking into account
k i k,,i = 10-3 , and substituting k,,i 2rR ÷ k i4a and z - r in IV-6.2.(5),
we have instead a coherent, perpendicular stacking, limiting factor of the form
1 + e- ki 4a
(9) RR a 1- ekxi4a 50
and RR does not go to infinity even for k,, = 0.
Away from onset,toroidal resonance radiation resistance peaks are
critically dependent on the evanescent edge and Q. Large perpendicular
mode numbers have smaller k,, (small evanescence),but also larger damping
-32-(small Q), and the two effects compete. The m > 0 modes have larger Q
(IV-5.3), but cannot be discerned from the m < 0 by probes at the plasma
edge. Some peaks may also be beats between different perpendicular
eigenmodes (even for ki R > 1).
Eigenmodes at High Density Ip n e t 74 Figure 1 -34-P13, B4, S50 Hydrogen 183 MHz 57.7 kW 8.9 kW 149 amps VF VR Ia
C-E CI C') al € C:: I. IC L- . N cns a CM) 00 C\1
V) Im
IS, F4j) opt a r,,I -" CO} J,•C a wLL.0 t ra C COC
0) a) *-o .0 O S L ,.•:_ :, o-,--. .. aO -e (00 1/) *:r *r ~to -j* (U -35-~-rrrasE~Cn~F~i~/~E~~UI"~·C~l~g~l9F--·. ~a~rrasa~u i: ; · bkO r---(0O 0N co CO LO N
ai
LL.
a w U UL r-4 (a 0 IN flo N CO S-COC D. O co ~T" 4-C E Q) *r-U) -3E '-CL 43o -ol-'-. -p CY) L-4d 4i (0 r--to a:: ca P.--4 CL -36-BP. -.. I .~.-111..~17~YT~qIj~PL~U~RJsB·L~a~S32, P6, B4 200 MHz at Medium Density Ip n e t VF VR I a t P7 4 P76 a 77 Figure 4 -37-Im*l*l·ri~*nCSP*~g4~C~2~8s~846
Eigenmode at Medium Detail Density S61, P69, B1 Deuterium Figure 5 S41, P52, B2 Heterodyne to 23 kHZ ne p t Ia 'a Pt a P8 -38-iYY~a~·~;Pn~fiqn*bg~~I
Hydrogen at 90 MHz S7, P2, B8 'p n e t VF VR Ia 70 HCN 71 HCN 2 Near field Figure 6 -39-c~*"RP~i~tpe~;y~$gggC$~Bf&~~SI"C
a, w1· C 1-CL 00 ccLL LL *r 4-) Co ar -o 4--o~ LU a . w r -C:) OcQ" O N C U-LL
C)D
CAl
I
C) rCM in-4
0-11-2.2. Wave amplitude measurements
Neglecting near-field power absorption, we show in IV-6. that, for high Q toroidal resonances and many overlapping eigenmodes, the probe signal average is proportional to <RR>/Vi-.
Figure 1 shows a standard high density low power shot with the forward and reflected voltage, antenna current and probe signal at HCN port.
Figure 2 shows the radiation resistance
(antenna
,
current,
antenna electric field (I) and probe signal for the same shot. Note
how the radiation resistance and electric field increase with density, but the probe signal saturates and even decreases with density. Figures 3 and 4 are similar shots, and we noticei (Figure 3) the top and bottom antenna currents are loaded in an almost identical manner (good balance in: push-push mode). Probe signals around the torus (68 HCN top, 69 HCN bottom and 67 top limiter), on the other hand, have significantly different time histories (Figure 4). Many of these different behaviors are believed to be due to the wandering plasma position. Radiation resistance is usually lower at the end of the shot (for the same density), and is most likely due to the plasma moving inward, since there is usually too much vertical field for the decreasing plasma current. In all cases examined (hundreds of shots in almost all directions of available parameter space) except the fundamental regime (with the cyclotron layer in the center of the plasma), probe signals around the torus (±90Q, 1800 from antenna) were all about the same magnitude (probe position in the complicated port geometry is critical). These measurements were done very carefully,and are strong evidence of
long damping length.
Figures 5 and 6 show radial probe scans with a large magnetic probe (Figure III-3.2.(3)) and a standard small unshielded probe
-41-(Figure II111-3.2.(2)). With the large probe fully inserted, it
becomes a good model of a short section of the A2 antennaand we can
write (without mode stacking) A
(1) V ~Aprobe
Probe Theoretical A antenn antenna R
antenna
3 V
p experimentaland the discrepancy could be explained by some 9 eigenmodes or, of course, by
near-field or single toroidal pass power absorption. Figure 6 shows similar
results,but at three different power levels, and also showing a discrepancy
factor of three or so. If mode stacking is not invoked, this means that
only some 10% of wave power reaches 90' away from the antenna. The
measurement is very crude because of the extreme sensitivity of the probe and
plasma position (evanescent edge),and the mere fact that power is
propor-tional to voltage squared ( 50% error can easily be due to the average probe
signal value estimation from the oscillograph).
Figures 5 and 6 are indicative of large k,,,since,for small k,,,the edge magnetic field should be roughly independent of distance from the
wall, which is clearly not the case here. For large k,, (= .5/cm), the edge
B vs r should be either linear or exponential, in agreement with experiment.
z
(Note again the extreme sensitivity of the port geometry.)
The results shown in Figures 5 and 6 can also be used to estimate wall power losses as
(2) Pwall Awall wall 2 )1 aR
.O
WattP. 500 W 500 (3) in 500 : 1W Pwa 11 -42-lura4~Alp~B~s~l~s~---`~----cl~p~·*h~Lk~~
and wall losses can be totally neglected in any power balance calcula-tion (this is a lower limit due to the bellows convolucalcula-tions and port geometry).
High and low power experiments showed exactly the same results (except obviously,during multipactor), and all processes (coupling, damping, etc.) were linear over six orders of magnitude (.1 W to 100 kW) (except perhaps some preliminary measurements of low level and frequency parametric activity at the 50 kW input power level).
Figures 7 and 8 show low and high density shots with predominantly
SHe
4plasma composition. The eigenmodes are High Q and very similar
to those for H2 or D2 plasmas. RR , on the other hand, is very small
(11-2.4). The lower traces of Figures 7 and 8 show RF pickup by the electrostatic Langmuir probe at the HCN port (Figure 111-3.2.(5)). The probe signal was shunted by a 1 pH inductor acting as a high
pass filter. At low density, the electrostatic and magnetic probe
signals show the same behavior (high Q eigenmodes), but differ considerably
at high density (activity continues even after RF is shut off).
-43-Radiation Resistance and Probe Signal at High Density B2, P61, 558 I n e t VF VR I a 73 Figure 1
-44-Radiation Resistance, Antenna Electric Field,and
Probe Voltage as a Function of Density
B2, P61, S58 PF - PR RR R RJ I IR A -1 2 3 4
ELECTRON DENSITY 1014cm'3(ne)
2 -45-9
8
CL
ci, -o E Cz ci 6 5 4 3 2 I FigureS17, B15, P57
Low Power with A2 Fed
in Push-Push Mode H2, 67.5 kA 200 MHz I'p VF VR 1.6 W 'T .46 A IB RR = 7.62 LT LB pin H
OC
68 HCN top 69 HCN Bot. Figure 3-46-S52, P20, B13
D2 and He" Mixture
at 183 MHz I t RR VF VR 68 HCN top 69 HCN bot 67 Limiter top Figure 4
-47-(ddA) Ieub!s aqo.d o!.au6e, cnC' ddAwU 6 Saqoij ^w u ! Iu6 !S aqo~j -48-U) 4) *-0C
r-o= O -o 0 ·C• C<C
C3
1-C LJ a 0 S. Lr-S t 0 cr -%--- c 'Of LOr/) a0 1.n oN 0-I-U)LO
(CN *0 I-L CL_ O)L-Dz and He4 Mixture at 183 MHz S43, & 45, P16, B13 Ip n e t RR VF VR Iaa 68 69 S43 Figure 8 -49-S45 Figure 7 -I
11-2.3. Wave phase measurements
As outlined in III-3.3.,extensive probe phase measurement schemes were used to estimate parallel and perpendicular wavelengths. Figure 1 shows a typical high density shot with 50% H2 and 50% D2. The lowest
trace is the phase (2w/fringe) between the oscillator (= antenna current) and a magnetic probe 90' away from the antenna. For a finite Q system and large dynamic range, the phase is never lost,and the phase difference
simply increases as k,, (v/ne). Thus
(1) k - .61/cm at 2.2 x 10¹⁴/cm3 Rand
from IV-22. the maximum k
and from IV-2.2. the maximum ki, (k, = 0) is
(N = 8.3) (2) k =• A _ wpi_ 4.4 x
l~~~a
i;t
108tV-+
-£ -vl
.78/cm where (3) 1 a2 = 1.15 = .82 = 1.26 S1.2 for for for forand the eigenmodes could be very near
I2 R
initial phase shift (o - X0 R )
fringes at breakdown (ne =10' 3/cm3)
(4) 1013
=
k,, .5R=rR
4 x 10- 6\/
1013
would give k,, = .76 - k,, (k, = 0).
cutoff. Note that including an and perhaps one to three initial
S2rr -50- £2-n= S= 50% 2 2 4 H2, H2 D2 D2 50% D2
At this point, we must caution the reader thataccording to Figure
IV-2.2.(4), even for a large k,, = .8 klcutoff, k, = .5 kA,and many radial and poloidal mode numbers are still possible at high density.
Figure 2 shows an expanded view of a pure deuterium shot (k,, .5/cm
at 2 x 10¹⁴/cm3) with the phase difference between the HCN port and
antenna (68/ref), top and bottom of HCN (68/69) and HCN and limiter
(68/67). Although more difficult to read (due to the large dynamic range on both inputs to the phase correlator), the phase difference between the HCN and
limiter is the same as between the antenna and HCN ports. Of course, the phase difference between the antenna and limiter was twice as large as between the antenna and HCN ports (Figure 3). The shots shown in
Figures 2 and 3 were at the 40 kW level, and the antenna broke down after 60 msec.
The phase difference between the top and bottom of the HCN (68/69, Figure 2) does not indicate any average increase in phase, and is
very noisy, as expected with a mixture of many randomly phased eigenmodes. Eigenmode identification at high density would clearly be very difficult if not impossible.
Fringe measurements during a single run were also done at 90
and 180 MHz, and as expected from (3)
(5).82
90
and there were about twice as many fringes at 180 MHz as at 90 MHz f-r about the same experimental conditions. A similar effect was ose ed by changing the magnetic field from 40 to 80 kG in 11-2.4.
Figures 4 and 5 show phase measurements between the reference and a near-field probe (5/2) and reference and HCN (5/68), with a linear
-51-and cosine phase correlator for He3 and He4 plasmas at 183 MHz. Note
how the linear correlator is easier to read. The cosine correlator had a bandwidth of about 10 MHz. As expected, the near-field phase deviation was less than +± , and was highly dependent on eigenmode resonances. The radiation resistance for these He shots was much lower than for H2 or D2 at the same density, in agreement with the accepted belief that helium
profiles are much narrower. (kAHe kAH,but evanescent edge is much larger). k,, is also very large (-.6/cm), even for medium density
(n
1.6 x 10¹⁴/cm3).Figure 6 shows an expanded view of phase measurement at medium power (=50 kW). Note the slight phase difference between the top and bottom HCN probes, and the usual slight dip in the thermonuclear neutron production rate.
Figure 7 shows a close up of fringes and soft X-rays,where we note the correlation between the "positive going" fringe sawteeth and the
central soft X-rays. This correlation could be an argument supporting the hypothesis that these measurements represent bulk k,,.
Phase Measurements at 206 MHz and D2 50%, H2 50% B18, P66, S49 I ne t Neutrons VF VR Ia HCN Bottom, 69 Ref/HCN Top, 68
Ref/HCN Bottom in., 69
Ref/HCN Bottom out., 70
Figure 1
-53-Phase Measurements at 183.5 MHz and D2 B13, P21, S57 I P n e t RR VF
vF
VR Ia HCN Top 68 HCN Bottom 69 Limiter 67 68/REF 68/69 Figure 2 68/67 -54-'"~~~ " ` '~~$I -~'~ .~a~i~u~P·rr~*B·I~Ug-~-L--lPhase Measurements Between MW, HCN and Limiter Ports B13, P4, S12 Deuterium 183.5 MHz Figure 3 Ip n t RR VF "F VR Ia P 68 P6 9 P 67 OSC/68 OSC/69 -55- OSC/67
Phase Measurements at 183 MHz and He3 P33, B10, S37-38 I P ne t RR VF VR Ia
5/68
S37 5/68 5/2 S38 5/2 Figure 4-56-Radiation Resistance and Probe Measurements in He4 at 183 MHz S53, B10, P58 p n e t RR VF VR Ia 68 HCN 67 2 Limiter Near-field osc/68 Figure 5 osc/67 -57-~R-sPs~,~i~l~[$ipR)HQ~BEI~(Li~l~xrl~-3·r
Phase Measurements at 206 MHz and D2 B18, P51, S53 I'p n e t neutrons VF VR
IaHCN Bottom inside 69
HCN Bottom inside 69
68/69
REF/HCN Top outside 68
REF/HCN Bot. inside 69
REF/HCN Bot. outside 70
Figure 6
-58-B18, S45, P64 11/1/80 Sawteeth on k,, Measurements 205.5 MHz 100% D2 65.3 kA I
center soft X-rays
n e
I P
center soft X-rays
n e
I P
center soft X-rays Figure 7
-59-11-2.4. Radiation resistance and magnetic field scans
Radiation resistance is the single most important parameter to
characterize ICRF wave coupling. Figure 1 shows how RR roughly
increases linearly with density,and is slightly higher for deuterium than hydrogen. Although RR is usually quite repeatable within a given run, significant changes were noted from run to run with roughly similar experimental conditions. RR background seemed essentially independent of plasma currents and magnetic field. Plasma in out position is believed
to be responsible for much of the variations, but this was not
con-firmed, since all the position loops on Alcator were inoperative (Figure 2).
Most of the data in this work was taken with the A2 unshielded
antenna but RR behaved essentially the same for the A1, A2 and A4 antennas,
except of course, for their relative value. At 200 MHz and 3 x 10¹⁴/cm3, A1 was about 3 ohms while A2 and A4 were typically 8 ohms. At 90 MHz,
RR was lower by a factor of about 4, so that A2 could only couple 30 kW
or less.
Figures 3 and 4 show typical 90 MHz shots with D2 fill and H2 minority
(recycling), and with the resonant layer either in (65.4 kA) or outside the plasma (79.2 kA). The radiation resistance was calculated with a high speed on-line analog computer (III-3.1.). RR background is independent of magnetic fieldbut the eigenmode spikes on RR and probe signal are very
sensitive to layer position. Figure 5 is a plot of probe signal versus layer position, and unambiguously exhibits strong magnetic field dependence
in agreement with theory. The minority concentration was small (<5%),
so the TIIH layer was very near the cyclotron layer.Also note the difference between the field probe signals for the two resonant layer positions. This may
-60-suggest that eigenmode spikes are due to toroidal resonances rather than on-sets, because even with short damping lengths (no probe spikes), RR and near-field should still exhibit large onsets (which they do not in Figure 3).
Figures 6 to 9 show the results of similar experiments at 180 MHz. Only three fields were used in this case (smaller increments were used
in other experiments), but many shots were averaged to gain good statistics. No significant field dependence was found on either the probe signals or radiation resistance (except for the expected k,, a 1/Bo dependence). Medium power field scans (11-3.3.) were also done in 50% H2 and 50% D2 plasmas,
again with about the same result (except for the neutral flux dependence), indicating that second harmonic damping is weak. RR background is not necessarily expected to change (both single perpendicular pass and high Q average RR are independent of damping), but eigenmode peaks should be inversely proportional to damping if they are representative of the bulk power and second harmonic damping (the most important unknown).
Figure 10 shows a high density D2 fill and He4 pulse shot,where we
again note (11-2.3.) how RR stays small with a predominantly helium plasma. Figures 11 and 12 show Hc and total light in front (MW bottom) and inside
(through holding pins) the antenna for two low power, high density, disruptive plasma shots. Note in particular, the close resemblance between the RR and the light signals. The increase in RR could be due to a broader profile
(thinner evanescent layer) or increased near-field losses (also edge density). At medium power, this light increases by 30% (11-3.3 ) all around the torus. Also note (Figure 12) the close resemblance between the alcohol
interfero-meter fringes (q 0 ne) and the ICRF k,, fringes (q 0
Ane).
-Radiation Resistance vs. Density
Hydrogen
1 2 3
Line Average Density (10' cm-3) Figure 1
Radiation Resistance vs. Density
A2 antenna S15, B15, P57 2 a 20[0 MH7 I , I - _I III -62-4 S Cn an E t= 4--i0 to -o to Cc %.--07 a 01 w'r 4-3 co,1 3d -Ll"• 1 2
Line Average Density (1014 cm-3)
Figure 2
I I
Radiation Resistance with Resonant Layer at Plasma Center B9, P7, S21 90 MHz D2 fill H2 minority 65.4 kA 2.3 at 2 fringes 'p n e t VF VR I a RR Near-field 2 Limiter 67 HCN Top 68 Fiqure 3
-63-Radiation Resistance with Resonant Layer Outside Plasma 90 MHz D2 fill H2 minority 79.2 kA 2.3 at fringes B9, P7, S32 p ne t VF VR Ia RR Near--field 2 Limiter 67 HCN Top 68 Figure 4
-64-(sWJO) 30NVISIS38 • , -NO lIVIOVd (-,, I ' I ' I ' I N 0 ) fl S n 0a 0 O r-U)U 0
q
e-
-4
*
soF
1 -0 'L) O II C NC D o m if E C0 C 00 c C.) C3.0 L . N c -_' --Co
c
0 -. L. a-C, Lii MCC a1 4 cD U) 0r 0± 0. E '-E 0-u ,r-U -, 0, d--O -o Ln O r- 4-a) 4-) or--n3 C) 00.
CL Cd ab-o " en N t--(sý!un AjejliqJC) "IlVNDIS 3806d C, C% If) • ItoC*
rd
-(AM) leubis aqoJdd -65-O N C r--C) a, a,C3
Lb C, Lt r --0 o 0 I--0) ZJ 0) U-0 U') I I I I II I Ii- I N cLn -D U-r--- 5 °0-Z O L. OI--1 __ _ _Resonant Layer on High Field Side Hydrogen 183.5 MHz IB - 44 kA 3 Q at 2 fringes B10, P16, S50 2/13/80 p n e t RR
V
F VR I a P2 P 70 P 71 P 72 osc./72 5/72 Figure 7-66-Resonant Layer at Plasma Center HCIrnn n 183.5 MHz I = 65 kA 3 Q at 2 fringes 810, P19, S57 2/13/80 Ip n e t RR VF VR' Ia P2 P 70 P 71 P 72 osc. /72 5/72 Figure 8
-67-Resonant Layer on Low Field Side Hydrogen 183.5 MHz IB = 85.8 KA 3 2 at 2 fringes Figure 9 B10, P18, S55 2/13/80 Ip n e t RR VF VR Ia P2 P 70 P 71 P 72 osc./72 5/72
-68-Radiation Resistance at 183.5 MHz with D2 Fill He" Pulsed 65.2 Ka 1.6 0 at 2 fringes 39, P41, S6 'p n
e
t VFvF
VR I a RR Near-field 2 Limiter 67 HCN Top 68 Figure 1O-69-Light Radiation and Radiation Resistance B9, P70, S48 Ip P ne t RR H Lt pin t VF VR Ia Figure 11
-70-Effect of Disruptions on Ha, total light and RR B9, P71, 2/10/80 S50 D2 , 183 MHz 'p n e t RR Ha Total Light Arc Det t OSC./68 OSC./68 2/5 Figure 12
-71-11-2.5. Wave coupling experiments
Aside from the carefully controlled A1, A2 and A4 antenna coupling
experi-ments, many other simple preliminary measurements were also performed. Ener-gizing only half of the antenna produced between half and a quarter of the
original RR , in rough agreement with IV-1.3, IV-6.5, and IV-7.1. RR also
seemed independent of phasing, further supporting IV-6.5.
It was most unfortunate that RR a d2 scaling (center conductor to wall
distance) was not proven (a + d remained constant), but the antenna was kept
as close as possible to the plasma to maximize coupling (both the A1
Faraday shield and the A2 side limiters showed some minor plasma erosion).
The Faraday shield did not affect coupling, as A2 and A4 proved to be
almost identical in all respects (slightly lower RR as expected from bench tests 111-2.5.).
Figure 1 shows capacitive probe (111-3.2.) coupling at high density and
180 MHz. The front of the 1.2 inch diameter molybdenum block was about
3/4 inch from the chamber wall. Note how the probe impedence was almost
exactly 50 Q without any matching network,in plausible agreement with
Section 111-3.2. V + V
(1) Z p VF F VR R 5 0 RR
From shot to shot during a single run, it was consistently noted that,for
a given power (-10 watts), the capacitive probe and the A2 antenna produced
roughly equivalent probe signals around the torus. Although very easily per-formed,radial probe scans were not done because the probe had to be removed for