Publisher’s version / Version de l'éditeur:
Materiaux et constructions. Materials and Structures, 17, 101, pp. 351-357,
1984-09
READ THESE TERMS AND CONDITIONS CAREFULLY BEFORE USING THIS WEBSITE.
https://nrc-publications.canada.ca/eng/copyright
Vous avez des questions? Nous pouvons vous aider. Pour communiquer directement avec un auteur, consultez la première page de la revue dans laquelle son article a été publié afin de trouver ses coordonnées. Si vous n’arrivez pas à les repérer, communiquez avec nous à [email protected].
Questions? Contact the NRC Publications Archive team at
[email protected]. If you wish to email the authors directly, please see the first page of the publication for their contact information.
NRC Publications Archive
Archives des publications du CNRC
This publication could be one of several versions: author’s original, accepted manuscript or the publisher’s version. / La version de cette publication peut être l’une des suivantes : la version prépublication de l’auteur, la version acceptée du manuscrit ou la version de l’éditeur.
Access and use of this website and the material on it are subject to the Terms and Conditions set forth at
Thermal stresses in mortar-tile systems
Yoshikawa, K.; Litvan, G. G.
https://publications-cnrc.canada.ca/fra/droits
L’accès à ce site Web et l’utilisation de son contenu sont assujettis aux conditions présentées dans le site LISEZ CES CONDITIONS ATTENTIVEMENT AVANT D’UTILISER CE SITE WEB.
NRC Publications Record / Notice d'Archives des publications de CNRC:
https://nrc-publications.canada.ca/eng/view/object/?id=a3f87373-6778-4436-aa8e-110ad50f82ca https://publications-cnrc.canada.ca/fra/voir/objet/?id=a3f87373-6778-4436-aa8e-110ad50f82ca
Ser
THl
lalt30
N21d
no. 1251
National Research
Conseil national
c. 2 I
I*
Council Canada
de recherches Canada
BLDG
-
-THERMAL STRESSES I N MORTAR-TILE SYSTEMS
by Kazumi Yoshikawa and G.G. Litvan
AP!.q
LYZEP
Reprinted from
Materiaux et Constructions
Vol. 17, No. 101, septembre-octobre 1984 p. 351 - 357
DBR Paper No. 1251
Division of Building Research
Price $1 .OO OTTAWA NRCC 23967
Canads
On a examin'e l e s v a r i a t i o n s de l o n g u e u r d a n s l e s syst'emes c o m p o s i t e s m o r t i e r t u i l e de p o r c e l a i n e e t m o r t i e r - t u i l e de p i e r r e ( e n g 6 n 6 r a l 10 x 3 x 8 mm), 2 d e s t e m p g r a t u r e s v a r i a n t e n t r e -10°C e t 50°C. On a 6valu'e l ' e f f e t de l a v a l e u r d e 1 1 6 c h a u f f e m e n t ( 1 e t 4"C/min), d e s dimensions d e s 6 c h a n t i l l o n s , d u r a p p o r t e n t r e l e s volumes d e s composants e t d e l'emplacement du p o i n t d e mesure p a r r a p p o r t
2
l ' i n t e r f a c e . L e s v a r i a t i o n s d e l o n g u e u r d e l a zone i n t e r f a c i a l e 6 t a i e n t trGs 6loign'ees d e s v a l e u r s t h ' e o r i q u e s bas'ees s u r l a p r ' e d i c t i o n du comportement 6 l a s t i q u e . Cependant, 2 l ' e x t ' e r i e u r d e l a zone i n t e r f a c i a l e q u i s 1 6 t e n dB
5 mm d a n s l e m o r t i e r e tB
3 , 5 mm d a n s l e m a t 6 r i a u composant l a t u i l e , o n a o b t e n u une bonne concordance e n t r e l e s v a l e u r s mesurges e t c e l l e s c a l c u l 6 e s .M. C .
101
YOSHIKAWA
Thermal stresses in mortar-tile systems
Kazumi Yoshikawa
Visiting Scientist, Materials Section, Division of Building Research, National Research Council Canada, Ottawa, Canada.
G.
G.
Litvan
Research Officer, Materials Section, Division of Building Research, National Research Council Canada, Ottawa, Canada.
Length changes of mortar-porcelain and mortar-quarry tile composites (typically 10 x 3 x 8 mm) have been examined in the temperature range - 10 to
+
50°C. The effect of heating rate (1 and 4"C/min.), dimensions of specimens, volume ratio of components and location of the measuring point with reference to the interface were evaluated. Length changes of the interfmial zone significantly deviated from the values predicted by assumption of elastic behaviour. Good agreement between measured and calculated values was obtained, however, outside the interfacial zone extending 5 mm into the mortar and 3.5 mm into the tile component.Glazed and unglazed porcelain and unglazed quarry tile are widely used in Japan as cladding for external wall surfaces of low and high-rise buildings. As these finishes are aesthetically pleasing, fairly durable and maintenance free, they enjoy great popularity. In a small but significant number of cases, however, the tiled wall systems fail in service. Adhesive failure may occur 4 to 5 years after installation or at some later time. Typically, groups of adjacent tiles, sometimes a few sometimes a great many, are dislodged. The compo- site system (consisting of tiles, plain or modified bon- ding mortar, and concrete) breaks down owing to dis- similarities of the coefficients of thermal and moisture expansion of the various parts, giving rise to differential movements and stresses. Temperature and moisture gradients, which always exist under field conditions, further aggravate the situation.
A study of stress development at the interface between building elements is of increasing importance, with the trend towards use of large-sized prefabricated assemblies. Stresses exist also at the interface between disperse phases of composites such as cement paste and aggregate [ I ] or reinforcement and matrix [2], affecting bond strength between components. In spite of the importance of restrained shrinkage and expansion in mortar and concrete, only limited data exist in the literature [3].
In the present study the coefficients of thermal expan- sion were measured in an effort to clarify the processes limiting durability of composite systems. The effect of changing moisture content will be the subject of a second investigation. Stresses created by changing tem- perature conditions have been examined by measuring the dimensional changes of composites. But strain gau-
ges can only be installed at the interface, where they seriously alter the interfacial bond, or in the interior of the phases far removed from the stress zone. Mea- surement of length changes was therefore chosen as the experimental technique because it does not have these limitations.
2 EXPERIMENTAL
2.1. Materials
Normal portland cement and Ottawa sand were used to make mortar with a cement: sand: water ratio of
1 : 1 : 0 . 3 . In some cases it was modified with acrylic
resin dispersion with a cement : resin ratio of 1 : 0 . 0 7 .
A two-part epoxy resin was used as adhesive. Some of the properties of the porcelain and quarry tiles used in the study are shown in table I.
2.2. Equipment
A DuPont Model 1090 Thermal Analyser (TA) with Model 990 Mechanical Cooling Accessory (MCA) and a Model 941 Thermomechanical Analyser (TMA) were
TABLE I
PROPERTIES OF nLEs AND MORTAR
Porcelain Mortar
1 - 1
tileWater absorption (%) .
.
. . . ..
5.13 1.14 15.04 Young's modulus (GPa).. . . .
. 52.5 57.7 33.7I
Coefficient of thermal expansion(
4,1M(4°C/min. x . . .
(
4.3741
12.62I
Vol. 1 7 - No 1 0 1 - Materiaux et Constructions
Fig. 1. - IUmtration of specimen geometry.
used. Length changes of the specimen, resting on a quartz plate, were registered by movement of a probe of 0.5 mm diameter. To ensure good contact the probe was loaded with a 2 g weight. The rate of temperature change controlled by the TA was based on the signal provided by a thermocouple on the surface of the specimen. The cooling element of the MCA surrounded the TMA heater in the cell. An insulated aluminum collar was placed on the top of the cooling element to prevent condensation and minimize temperature fluctua- tions.
subsequent experiments. Depth (d) was 3 mm, except for Series 1 S and 2 Cp, in which specimens 6 mm deep were also used. Width (w) was 12 mrn in Series 1 S and 2 Cp, and 6, 8 or 10 mm in Series 3 S. When the effect of the volume ratio of the components was stu- died (4 and 5 Cp), specimens with w = 6, 7, 8 and 10 mm were tested. The specimens in 6 and 7 Cp had w = 8 mm; in Series 8 Cp, w = 6 mm.
2.4. Procedure
Specimens of known dimensions were placed in the TMA and the temperature of the cell was increased at constant rate (1,4 or S°C/min.), specified by the pro- gram, to +60°C, followed immediately by cooling to
- 20°C at the same constant rate. Each run consisted of five temperature cycles. Only length changes occurring between - 10 and
+
50°C in the last three cycles were tabulated. These could be read to 0.01 pm and tempera- ture to O.Ol°C. The test program was designed and the results evaluated by the statistical methods of randomi- zed complete block design [4].2.3. Sample preparation 3. EXPERIMENTAL PROGRAM AND RESULTS
The composite specimens were fabricated by casting mortar against tiles, conditioned at 100% RH, whose surfaces were ground smooth to provide a well-defined interface. After two months' curing in a fog room, the specimens were cut to exact dimensions with a metallographic blade-saw, then dried at 90°C for 48 hours and stored over Mg(ClO,), in a desiccator until tested.
Prism shaped specimens (fig. 1) were used. Height
(h) was 12 mm in Series 1 S and 2 Cp, and 10 mm in
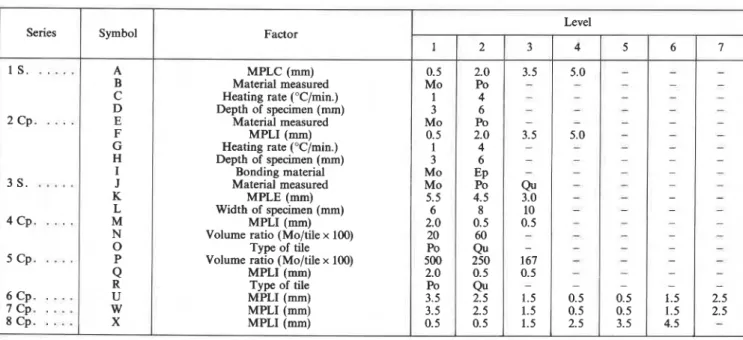
The effects of the various factors investigated in the eight series of experiments are shown in table 11.
In Series 1 S and 3 S single materials were used and in the rest, composite specimens.
Table I11 shows the layout of the factors and their levels, together with measured values. To illustrate the method of tabulation, consider specimen No. 3. The probe was positioned 2 mm from the centre of the specimen (factor A, level 2), on the mortar surface (factor B, level I), and the cell was heated at 1°C/min.
TABLE I1
Level
Series Symbol Factor
1 2 3 4 5 6 7
pp pp
1 s .
. . .
A MPLC (mm) 0.5 2.0 3.5 5.0B Material measured Mo Po
-
-
C Heating rate ("Clmin.) 1 4 -
-
D Depth of specimen (mm) 3 6 - -
2 C p .
. . . .
E Material measured Mo Po-
-
F MPLI (mm) 0.5 2.0 3.5 5.0
G Heating rate ("Clmin.) 1 4 - -
H Depth of specimen (mm) 3 6 - - I Bonding material Mo Ep
-
-
-
- - 3 s .. . .
J Material measured Mo Po Qu - - --
K MPLE (mm) 5.5 4.5 3.0-
-
-
-
L Width of specimen (mm) 6 8 10 - - - - 4 C p . . . . , M MPLI (mm) 2.0 0.5 0.5-
-
- -N Volume ratio (Moltile x 100) 20 60 - - - -
-
0 Type of tile PO Qu
-
-
-
-
-5 C p . . . . . P Volume ratio (Moltile x 100) 500 250 167 - - - -
Q MPLI
(v)
2.0 0.5 0.5-
--
-
R Type of tile Po Qu
-
-
- -6 C p . . . . , U MPLI (mm) 3.5 2.5 1.5 0.5 0.5 1.5 2.5
7 C p .
. . . .
W MPLI (mm) 3.5 2.5 1.5 0.5 0.5 1.5 2.58 C p .
. . . .
X MPLI (mm) 0.5 0.5 1.5 2.5 3.5 4.5-
S = Single material; Cp = Composite; Mo = Mortar; Po = Porcelain; Ep = Epoxy; Qu = Quarry; MPLC = Measuring point location with reference to centre of specimen; MPLI = Measuring point location with reference to the interface; MPLE= Measuring point location with reference to edge of specimen.
No 101 - Matbriaux et Constructions
TABLE VIII
SERIES 3 S, ANALYSIS OF VARIANCE
Source Degree Sum
Mean
of of of F
variation freedom squares ratio f . . . 1 41.764,8 41.764,8 467.17 (**) 51-2 . . . . 1 73.309,6 73.309,6 820.02 (**I 52-3..
. .
1 0.140,8 0.140,8-
K1-2.. .
1 0.154,l 0.154,l - K2-3.. .
1 0.028,O 0.028,O-
L1-2.. .
1 0.073,6 0.073,6-
L2-3. . . 1 0.050,7 0.050,7 - e 2 . . . 16 0.005,9 0.000,4 - (e). . .
(5) (0.447,2) (0.089,4) - Total.. . .
23 115.527,5 - - TABLE IXSERIES 4 Cp, ANALYSIS OF VARIANCE
Source Degree Sum
Mean
of of of F
variation freedom squares ratio f
. . .
1 3.580,s 3.5845 11.04 MI-2. 1 18.179,4 18.179,4 56.04(b) M 2-3. 1 6.249,6 6.249,6 19.27(3 N. . .
1 4.191,7 4.191,7 12.92(3 0.. . .
1 3.161,O 3.161,O 9.74(3 e 1.. . .
2 0.648,8 0.324,4 - e 2. . .
16 0.068,7 0.004,3-
(e). . .
(2) (0.648,8) (0.324,4) - Total.. . .
23 36.0797 - - TABLE XSERIES 5 Cp, ANALYSIS OF VARIANCE
Source Degree Sun
Mean
of of of F
variation freedom squares square ratio
f
. . .
1 1.596.5 1.596,5 64.37 (**) P I - 2 . . 1 0.084,l 0.084,l-
P2-3..
1 0.043,2 0.043,2 - 4 1 - 2 . I 29.799,O 29.799,O 1201.57 (**) 4 2 - 3 . 1 9.720,O 9.720,O 391.94(**) R. . .
1 1.349,O 1.349,O 54.40 (**) e 1.. . .
1 O.OO0,O O.OO0,O-
e 2. . .
16 0.344,7 0.021,5 - (e).. . .
(19) (0.4770) (0.024,8)-
Total. . . 23 42.9408 - - TABLE XISERIES 6 Cp, ANALYSIS OF VARIANCE
I
Source Degree Sum
Mean
of of of F
variation freedom squares ratio f
. . .
1 19.958,6 19.958,6 324.00 (**) U 1-4. 3 0.864,9 0.288,3 4.68 (*) U 2-7. 3 9.320,3 3.106,8 50.44 (*) e 2 .. . .
8 0.492,5 0.061,6 - (e) . . . (8) (0.492,5) (0.061,6)-
Total.. . .
15 30.636,3 - -Increasing the depth of the specimen resulted in larger mass and, for composites, larger interfaces, but neither the mass ratio of the components nor the posi- tion of the interface with reference to the boundaries was altered. Doubling the smallest dimension of the specimen, as was done in these experiments, affected the thermal gradient in addition to increasing the area of the interface.
Because the other parameters remained unchanged while d was varied, failure to observe any effect in the composites must be ascribed to the presence of the interface. Most probably the uncertainties introduced in the fabrication of the composite specimen prevent measurement of the effect of d, although the possibility that some unknown factor is responsible for the insensi- tivity of composites cannot be excluded.
4.2. Effect of bonding material
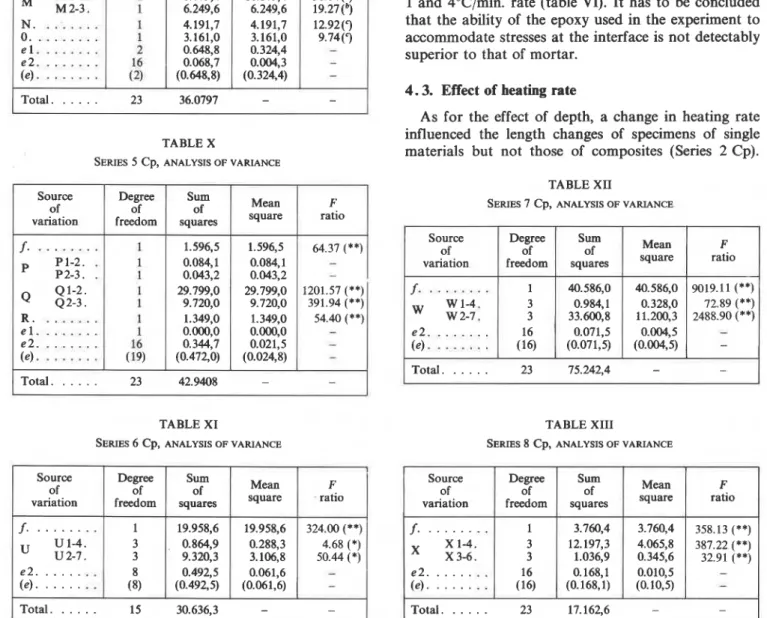
In Series 2 Cp the ability of epoxy and mortar bon- ding agents to minimize thermal stresses at the inter- face was examined (Factor I). No significant differences could be detected for the two bonding materials when the temperature was raised from -10 to +5O0C at 1 and 4"C/min. rate (table VI). It has to be concluded that the ability of the epoxy used in the experiment to accommodate stresses at the interface is not detectably superior to that of mortar.
4.3. Effect of heating rate
As for the effect of depth, a change in heating rate influenced the length changes of specimens of single materials but not those of composites (Series 2 Cp).
TABLE XII
SERIES 7 Cp, ANALYSIS OF VARIANCE
Source Degree Sun Mean
of of of F
variation freedom squares ratio
f.
. . .
1 40.586,O 40.586,O 9019.11 (**) W1-4. 3 0.984,l 0.328,O 72.89 (**) W 2-7. 3 33.600,8 11.200,3 2488.90 (**) e 2. . .
16 0.071,5 0.004,5 - (e).. . .
(16) (0.071,5) (0.004,5)-
Total.. . .
23 75.242,4 - - TABLE XI11SERIES 8 Cp, ANALYSIS OF VARIANCE
Source Degree Sum
Mean
of of of F
variation freedom squares square ratio f . . . 1 3.760,4 3.7644 358.13 (**)
x
::I::
3 3 12.197,3 1.036,9 4.065,8 0.345,6 387.22 32.91 (**) (**) . . . e 2 16 0.168,l 0.010,5-
(e) . . . (16) (0.168,l) (0.10,5) -. . .
Total. 23 17.162,6 - -In Series 1 S the dimensional changes of mortar and porcelain were larger at 1°C/min. than at 4"C/min.
Temperature rate sensitivity could be interpreted as an indication that at higher rates the temperature range traversed by the interior of the specimen is reduced. In cyclical heating, lowering of the temperature of the specimen may commence well before the interior can reach the upper temperature limit if the lag between
1
interior and exterior is sufficiently large. This effect is proportional to heating rate, and the larger length changes at 1°C/min. than at 4"C/min. support this assumption.
On the other hand, when 4 hours of residence time at
the temperature extremes (called "static" measurement) was included in the temperature cycles (the difference between interior and exterior of the specimen at the extreme temperatures was essentially nil), the length change of the mortar component was smaller and that of the tile component larger than at the 5°C deg/min. rate (fig. 2). It is concluded, therefore, that either the temperature lag between the interior and exterior of the specimen is not significant (even at a rate of 4°C deglmin.) and rate dependence is due to some
.
other cause, or the temperature lag assumption is validand the results of the static experiments are affected by another factor (such as plastic flow) operative during the long residency period. No indication of this could
be detected in the length change versus time curves.
1
4.4. Restriction of stress by the interfaceOn heating of a composite of two materials with
different coefficients of expansion, the equalizing in-
fluence of the components is quite clear (fig. 2). This
is, of course, to be expected. Adopting the multi-layer
model for a beam (although the length-to-width ratio
is somewhat less than ideal) and changing the temperat- ure by T (consisting of layers of materials with different
Young's moduli, E, and coefficients of expansion, a),
I N T E R F A C E
< >
ETg. 2 - Length changes of porcelain-mortar (100: 60) compaqite as
a function of measuring point, in temperat~~re cycles without (1) and with (2) residency time at extreme values.
8 7 6 5 4 3 2 I 0 - 5
Kazumi Yoshikawa - G. G. Litvan
D I S T A N C E F R O M I N T E R F A C E , mm D I S T A N C E F R O M I N T E R F A C E , m m P O R C E L A I N ! M O R T A R 11001 1 (601 - a ' -
-
--
-Fig. 3. - Comparison of cakulated and measured valnes of length
change as a function of measuring point.
- - - - - '
the thermal stress, o , can be calculated by the
formula [5] : - - - ' I ' I I where: - 4 - 3 - 2 - 1 0 1 2 3 E = and
p=
where y is the coordinate normal to the interfaces, and
c is half the width of the beam. The term
( - a T + E
+
p
y) gives the strain produced by thermal stress at the various points of the beam. The calculated theoretical and measured expansions of porcelain- mortar composite specimens are shown in figure 3.There is general agreement between measured and calculated values, with some deviations occurring at and in the vicinity of the interface. Owing to its higher
Young's modulus (57,665 MPa compared to
33,736 MPa for cement), porcelain is less deformed by restrictive stress at the interface with mortar than would be the case if the positions were reversed. This is demonstrated by the difference in the width of the interfacial zone; expansion of the mortar component reaches the value of free mortar at 5 mm from the interface, while for porcelain this occurs at 3.5 mm from the interface (fig. 4).
To analyse the significance of the deviation of the measured values from those predicted by theory, the
results of Series 4 Cp (table IX) and 5 Cp (table X) are
examined. The slopes of length change, as a function of distance from the interface, were divided by the slope of the theoretical curve and compared with similar ratios in the region of the single component (mortar
Vol. 17 - No 101 - Matbriaux et Constructions
D I S T A N C E F R O M I N T E R F A C E . m m
fig. 4.
-
Length changes of composites as a f d o a of ~~g point in relation to length changes of individual co-or porcelain) of the composite. As a function of dis- tance from the interface, length changes are presented in graphical form in figure 5.
Testing the difference between the populations of data pertaining to the interface and component side of the composite, the variance ratio is:
Xi
= variable;xi
=mean of sample set;n = number of observations; subscript 1 refers to interface;
subscript 2 refers to one component of the composite. Because the value of the F distribution,
(0.05) = 6.39, is greater than the computed value of F, both sets belong to the same population, i. e., there is no real difference between the variances of the data sets.
Next, the equality of the means of the two sets can be tested:
(n1 +n2-2) =5.46>t8 (0.01)
= 3.355, value of the t distribution.
There is a real difference between the means of the ratios of experimentally-determined to calculated slopes in the interfacial and single-component regions of the composite. Calculations for the quarry tile-mortar com- posite obtained in this series yield the same conclusion. The mean ratio of the slopes of the measured and calculated length changes versus distance from the inter- face (range extending from 0.5 to 2.0 mm distance from the interface) is 1.03. Because the calculated value assumes elastic behaviour, good agreement indica- tes that 0.5 mm from the interface the response of the material to the stresses created by the other component
7 . I I 6 - 5 .- u WRCELAIN (80) + a
/>
' ,I/ MORTAR llml 4 - .- PORCELAIN 1401 t - n MORTAR (1WI PORCELAIN 1601 + MORTAR l l W l 6 I' P M S U R E D ,' CALCULATED PORCELAIN 11671 MORTAR I I W I -.-. PORCELAIN ISOOI MORTAR I E U I 2 I I I I1
- 2 . 0 - 0 . 5 0 0 . 5 2 . 0 D I S T A N C E FROh1 I N T E R F A C E , m mfig. 6. - Comparison of measured and calenlpted v d w s of length changes of mortar-porceIain~~mposites.
9 D I S T A N C E F R O M I N T E R F A C E , m m
- 3 - 2 - 1 0 1 - 3 - 2 - 1 0 1 D I S T A N C E F R O M I N T E R F A C E , m m
Fig. 5. - Comparison of measured and calculated v d w s of length
changes of porcelain-mortar-co~itea in interfacial zone
0 I I I I I I
0 2 0 4 0 6 0 8 0 1 0 0 1 2 0 1 4 0
V O L U M E R A T I O , V m , , l a r l V , i l e x 1 0 0 %
fig. 7. - Calculated axial streas in mortar component at interface of
Kazumi Yoshikawa - G. G. Litvan
is elastic. In contrast, within 0 . 5 mm on either side of the interface the high value (2.12) of the mean ratio of the slopes (calculated: measured) can be explained by viscoelastic behaviour. Owing to difficulties of experimentation, the width of the interfacial region could not be narrowed further, but it is very probable that the zone with viscoelastic behaviour is mainly on the mortar side or in the immediate vicinity of the interface.
4.5. Effect of volume ratio
In Series 4 (table IX) the effect of the volume ratio of the components on length changes was investigated. The results with porcelain-mortar ratios of 100: 60 and 100: 20 are shown in figure 6 together with calculated values (equation 1). The theoretical values are quite sensitive to change in volume ratio and, significantly, the measured values clearly exhibit a similar trend. Deviation of the measured values from the calculated ones is greatest for the interfacial region, but the experi- mental points are in general agreement with the pre- dicted values.
When the volume of the mortar component was constant and that of the porcelain component varied, porcelain-mortar ratio = 20: 100, 40 : 100, and 60 : 100 (Series 5, table X), the theoretical values were found to be quite insensitive to the ratio changes and the differen- ces could not be established experimentally (fig. 6). The axial stress of porcelain-mortar composites as a function of volume ratio of the components created by changing temperature were calculated. A 60°C deg temperature rise in the composite beam was considered, assuming no temperature gradient in either the initial or final state. Axial stress was calculated using equation (1)-
Axial stress in the mortar at the interface is plotted as a function of volume ratio in figure 7 for a freely- bending porcelain-mortar composite and for one restrai- ned by a rigid concrete substrate. With decreasing thick- ness of the mortar layer the axial stress of the mortar increased.
5. CONCLUSIONS
1. Strain in the interfacial zone of mortar-porcelain and mortar-quarry tile composites created by thermal effects shows viscoelastic behaviour.
2. Mortar, porcelain and quarry tile in composites behave elastically outside the interfacial zone.
3. The restrictive influence of components on the strain produced by temperature change can be observed within 3 . 5 rnm of the interface on the porcelain side and within 5 . 0 mm on the mortar side.
4. The volume ratio of components affects the strain of the composite, particularly in the interfacial zone.
5. Epoxy, used as a binding agent in the experiment, does not reduce interfacial stress.
ACKNOWLEDGEMENT
The valuable assistance of G. Polomark in the ther- momechanical measurements is gratefully acknowled- ged. This paper is a contribution from the Division of Building Research, National Research Council Canada, and is published with the approval of the director of the Division.
REFERENCES
[I] Hsu T. T. C., SLATE F. O., STURMAN G. M., WINTER G.
-
Microcracking of plain concrete and the shape of the stress-strain curve, Journal of the American Concrete Insti- tute, Proceedings, Vol. 60, 1963, p. 209.[2] PINCHIN D. J., TABOR D. - Inelastic behaviour in steel wire pull-out from portland cement mortar, Journal of Materials Science, Vol. 13, 1978, p. 1261.
[3] SWAMY R. N., BANDYOPADHYAY A. K., STAVRIDES H.
-
The ring method of measuring restrained shrinkage in mor- tar and concrete, Cement and Concrete Aggr., Vol. 1, 1979, p. 13.
[4] OSTLE B., MENSING R. W. - Statistics in research, 3rd ed., Iowa State University Press, Ames, 1975.
[5] TIMOSHENKO S. P., GOODIER J. N.
-
Theory of elasticity,3rd ed., McGraw-H111 Book Company, 1970, p. 433. [6] Zbid. In Ref. [5], p. 118.
RESUME ctramique ont rtvklt un comportement visco-tlastique.
Contraintes thermiques dans les carrelages au mortier.
-
On a examint les variations de longueur de carre- lages mortier-porceiaine et mortier-carreau ckramique(10 x 3 x 8 mm en moyenne) d des temptratures variant
de - 10 a 50°C. On a relevt les effets de la vitesse de
chauffage (1 et 4"C/mn), des dimensions des Lchantillons, du rapport entre les volumes des constituants, et de Pemplacement du point de mesure par rapport d l'inter- face.
Les conclusions ont kte' les suivantes :
2. Le mortier, la porcelaine et la pierre juxtaposks
se comportent tlastiquement en dehors de la zone de Pinterface.
3. L'effet restrictif des tltments sur les contraintes thermiques duex aux variations de temptrature a pu &tre observt jusqu'd 3,5 mm de Pinterface du cbtk de la porcelaine et jusqu'd 5,O mm du cbtt du mortier.
4. Le rapport entre les volumes des constituants modi- fie la de'formation de Pensemble, notamment duns la zone
de tinterface.
1. Les contraintes thermiques dam la zone de Pinter- 5. La rtsine tpoxyde, qui a servi de liant au cours de