HAL Id: hal-02324105
https://hal.archives-ouvertes.fr/hal-02324105
Submitted on 22 Oct 2019
HAL is a multi-disciplinary open access
archive for the deposit and dissemination of
sci-entific research documents, whether they are
pub-lished or not. The documents may come from
teaching and research institutions in France or
abroad, or from public or private research centers.
L’archive ouverte pluridisciplinaire HAL, est
destinée au dépôt et à la diffusion de documents
scientifiques de niveau recherche, publiés ou non,
émanant des établissements d’enseignement et de
recherche français ou étrangers, des laboratoires
publics ou privés.
EXPERIMENTAL STUDY OF A PLASMA BUBBLE
CREATED BY A WIRE EXPLOSION IN WATER
Zoé Laforest, Jean Jacques Gonzalez, Pierre Freton
To cite this version:
Zoé Laforest, Jean Jacques Gonzalez, Pierre Freton. EXPERIMENTAL STUDY OF A PLASMA
BUBBLE CREATED BY A WIRE EXPLOSION IN WATER. IJRRAS, 2018, 34. �hal-02324105�
1
EXPERIMENTAL STUDY OF A PLASMA BUBBLE CREATED BY A
WIRE EXPLOSION IN WATER
Zoé Laforest, Jean-Jacques Gonzalez, Pierre Freton
LAPLACE, Université de Toulouse, CNRS, INPT, UPS 118 rte de Narbonne, 31062 Toulouse cedex France
ABSTRACT
An experimental setup is developed to study the bubble dynamic created by a wire explosion in a liquid. This arrangement can be encountered in many configurations and processes and differs by the level and frequency of the applied energy and of the liquid nature. In our study the wire explosion is due to a current intensity around one thousand amps during 10ms in a water medium and a distance between the electrodes of few millimeters. By fast imaging the bubble radius is determined versus time depending on the applied energy. The results indicate that the maximum radius of the bubble versus the applied energy leads to a linear variation of 2.3 cm/kJ roughly. A modification of the Rayleigh model is proposed to consider not an empty bubble but pressure variation inside. The experimental results coupled with the Rayleigh model allow determining the maximum bubble radius, the bubble dynamic and to evaluate its mean temperature. For electrical arc energy of 846 J and an inter-electrode distance of 1 mm, the bubble presents an expansion and a collapse. A maximal radius is reached near 4 cm before 1.5 ms the end of the half current period, due to the leak of energy to feed the bubble.
Keywords: Wire explosion, plasma, bubble expansion, collapse.
1. INTRODUCTION
Many experimental works are devoted to the study of plasma medium nevertheless only few of them are related to the expansion of an arc channel in a liquid. However this physical phenomenon is included in many processes as the electrical fracturing [1], the underwater cutting [2] and welding [3], the production of nanoparticles [4] [5] or nanostructures [6] or in several environmental applications such as micro-organisms degradation [7].
Each of these quoted processes have distinct experimental conditions as the applied time of the pulsed current, the energy injected or the nature of the liquid. For example the underwater fracturing uses energy in the order of magnitude of the kilo Joule during time from nanoseconds to few microseconds following the level of the pressure wave wished [8] and the material permeability to fracture [1] while carbon nanostructures production in water [6] or in other aqueous solution NaCl, KCl [9] necessitates lower energy in the order of magnitude of hundred Joules during time from one to few ten minutes [6] to obtain a good quality.
Despite these different experimental conditions, common mechanisms exist: the Joule effect [4] [10], the liquid evaporation [1] [6] [11], the pressure wave [1] [11] [12], the arc cooling [13], radiation [11], the ionization, dissociation, recombination or other chemical reaction [6] [10] [13]. Some of these mechanisms participate to the arc ignition and extinction [4].
Once established the electric arc leads to a bubble of gas which has generally a spherical form. In case of an energy injected by pulses the bubble gas grows then collapses [11]; this cycle occurs following the applied frequency and is well described by Qotba [12] in its experimental work. In case of pulses energy higher than a frequency of 1 kHz the bubble of gas still grows [11] [13] or maintains the same size due to the good stability of the arc [9]. When the applied energy is switched off the bubble of gas collapses leading to a “mushroom form” [14] [15] [16].
The aims of our work were to build one experimental setup with the associated diagnostic in order to observe and to analyze the dynamic of the bubble of gas and to correlate its behavior with the electrical characteristics. One time observed, the second aim consists to determine from theoretical models the mean plasma temperature and the maximum bubble radius. Many models were proposed in the literature as the Rayleigh model [17] or improved versions. The Rayleigh model is developed with the assumption of an empty bubble. This model is
2
modified by Beeching et al [18] to take into account the gas and the surface tension effects, the Rayleigh-Plesset model [19] takes into account the viscosity term, then Nigmatulin et al. [20] improvement of the Rayleigh model is related to the effect of the heat transfer, the vaporization and condensation phenomena. In this study which is related to an electrical arc in a liquid, we choose to apply the Rayleigh model [17] developed with the assumption of an empty bubble.
This paper is divided in two mains parts: in a first part the experimental setup and the instrumental acquisition will be presented then the obtained results will be analyzed. A comparison with the Rayleigh model is performed and a mean plasma temperature evaluated before the conclusion.
2. MATERIALS
The experimental setup can be divided in three parts: the alimentation power, the reactor and the apparatus for the medium characterization. These three parts are now detailed.
2.1 Alimentation power
The power alimentation is included in a RLC circuit and produces half current period during 10 ms. Capacities are discharged in the experimental setup through an inductance: Lind - Ceq: 317 µH and 30 mF. The current level
is controlled by the voltage charge at the capacities using an auto transformer from 0 V to 600 V. To produce the discharge and to protect the circuit, additional electronic components are necessaries. For their rapid commutation, two thyristors are used: the first one commands the wave of the current intensity and the second the switch off. The additional power is transferred to a resistance and one diode is used to protect the capacities.
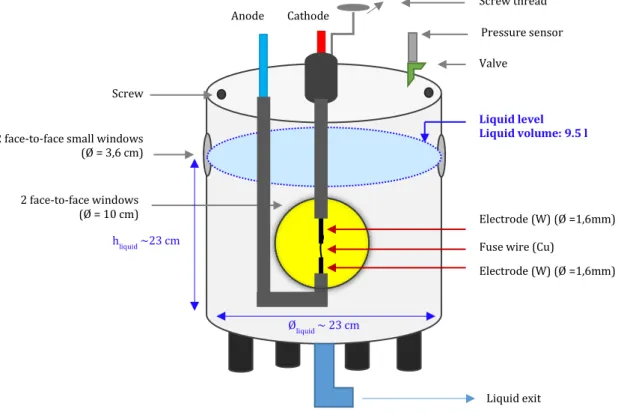
Figure 1 Scheme of the reactor
2.2 Reactor
Figure 1 presents the experimental reactor. It’s an aluminum cylindrical reactor with a height of 36 cm and a total exterior diameter equals to 30 cm. The mean walls thickness is 3 cm. The discharge can be observed by two face to face circular windows (diameter equals to 10 cm). Two others smaller windows (diameter equals to 6.4 cm) are also located in the upper part of the reactor. They allow observing the liquid movement as the liquid in the reactor is filled until the middle of these small windows. The liquid height is 23 cm and the inlet diameter 23 cm (total 9.5 liters). One time the reactor filled one space of 1/3 of air is present in the reactor. The pressure of this space is controlled during the discharge by the captor pressure located on the cover. The reactor is filled with water.
Screw 2 face-to-face small windows
(Ø = 3,6 cm) 2 face-to-face windows (Ø = 10 cm) Cathode -Anode + Screw thread Electrode (W) (Ø =1,6mm) Electrode (W) (Ø =1,6mm) Fuse wire (Cu)
Liquid level Liquid volume:9.5 l Liquid exit Valve hliquid ~23 cm Øliquid ~ 23 cm Pressure sensor
3
2.3 The Electrodes
One micrometric control allows fixing the distance between the two tungsten electrodes. The diameter of the electrodes is 1.6 mm. Only half current period is applied and we assume the lower electrode polarity as the
2.4 The liquid
The liquid used in the reactor is a classical water of the network distribution. The liquid is introduced in the reactor at ambient temperature keeping out the cover of the upper part. The pH is close to 7. We do not have measured the conductivity but its value according to the parameter given by the operator is in the range 180 to 1000S/cm at 293K.
2.5 Apparatus
In order to characterize the discharge, apparatus are used for the measurements of the drop voltage, the current intensity, the pressure and to visualize the bubbles.
Fast camera:
The fast camera is a Photron SA5 with 16 Go of memory linked to a PC to visualize the discharge. One TRIG system is used with the command circuit to synchronize the acquisition with the beginning of the pulsed current. The parameters of the camera as the resolution, the frequency or the exposure time are fixed on the PC using the PFV FASTCAM Viewer v.3.3.7 software proposed by Photron [16]. During the pulse a halogen lamp is placed on the opposite side of the camera; a better contrast is obtained by ombroscopy. To visualize the discharge a 512 by 456 pixels resolution is chosen with 30 000 im/s.
Current and voltage probes:
Electrical characteristics are obtained by probes measurements. One probe is located at the electrodes to measure the drop voltage in the discharge: Uarc and the second one at the exit of the capacities Ucapa to estimate the energy
transferred to the system. The current intensity Iarc is measured by a Rogowski loop adapted for alternative or
pulse currents. These electrical measurements allow obtaining the instantaneous arc power Parc (equation (1)) and
so the energy Earc of the electric arc and the energy given by the capacities Ecapa respectively equations (2) and
(3):
Parc= IarcVarc (1)
Earc= ∫ Parc dt (2)
Ecapa=
1
2 CeqUcapa2 (3)
Pressure sensor:
The sensor is placed in the cover allowing following time to measure the air pressure in the space between the cover and the liquid. This is a Keller piezo resistive sensor model M5HB. It allows dynamic and static measures with a frequency from 0 to 50 kHz up to 10 bar. The diameter of the sensor is 4 mm.
3. RESULTS 3.1 General result
In order to illustrate the plasma behavior, pictures obtained by the fast camera in water are presented in the Figure 2. The electrodes surfaces are plane and their diameter is 1.6 mm. The distance between the two electrodes is d = 1 mm. The charge equals to Ucapa = 494 V allowed obtaining 3.66 kJ. The half current wave is
applied during 11.2 ms. The maxima of the current 2.47kA and of the voltage Uarc = 58.5 V are obtained at t =
3.9 ms.
Figure 2 presents ten pictures corresponding to different times. The first picture (time t = 0) in the left upper position shows the two electrodes with the anode (down position) and the cathode (up position). We can also distinguish the lamp filament in the horizontal position. At time 0.4 ms small bubbles are located on the electrodes. At time 0.67 ms the discharge is ignited. From times t = 0.67 ms to t = 11.2 ms the gas bubble grows although the maximum pic current is reached at t = 3.9 ms. The maximum of the bubble diameter is obtained at
4
time t = 9.8 ms. At time t = 11.2 ms the applied current is null nevertheless the gas bubble is always present. At time t = 14 ms even if we observe a diminution of the bubble diameter its dimension keeps important. We can note a flattening of the upper part of the bubble. This flattening can be observed easily at time t = 15 ms where the bubble was transformed to a half spherical bubble. The upper part of the spherical bubble seems to be collapsed inside the down part at 16 ms. The bubble emissivity drastically diminishes and the bubble disappears at time 19 ms.
Figure 2 Bubbles evolution obtained by fast camera during 19 ms. The energy given by the capacities is 3.66 kJ delivered during 11.2 ms. K and A are respectively the cathode and anode electrodes (d =1 mm)
3.2 Measures and steps description
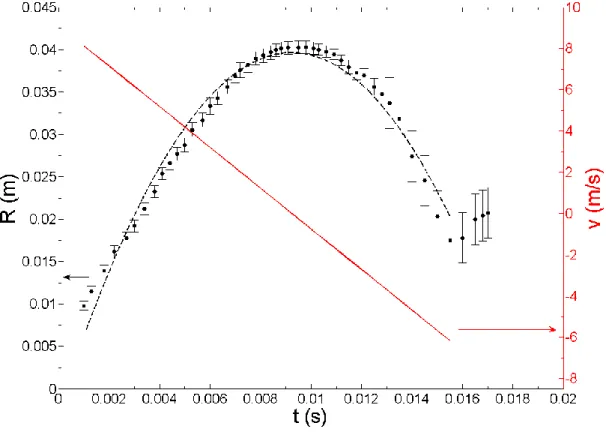
During the bubble existence its diameter can be measured. From the pictures acquisition, the Figure 3 gives the bubble radius evolution versus time.
Figure 3 Bubble radius (black) and the velocity (red) evolutions following time. The input energy was 3.66 kJ during 11.2 ms and the inter electrodes distance is 1 mm
The bubble radius evolution presents a parabolic form. The derivate of this function in red color is also plotted and represents the expansion (positive values) and the collapse (negative values) velocities of the bubble. From
0 ms 0.4 ms 0.67 ms 3.9 ms 9.8ms
11.2 ms
14 ms
15 ms
16 ms
19 ms
A
5
the radius evolution, the velocity can be deduced. It presents a linear evolution. Sometime the bubble is not a perfect sphere so the diameter is evaluated several times for each picture. The error bars correspond to the dispersion from the mean value. In a first time the bubble expands with a mean velocity of 9.11 m/s reaching a maximal diameter equals to 40.25 mm at time t = 9.8 ms, then the bubble collapses. After 17 ms the bubble diameters is difficult to estimate as the bubble is not so spherical.
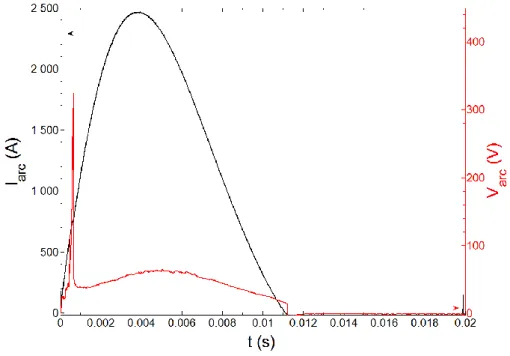
Synchronized with the pressure captor, current and voltage measurements versus time are presented in the Figure 4. The maxima of the current and voltage pics (around t = 3.9 ms) correspond respectively to 2472 A and 58.5 V. The voltage presents also one pic around 0.65 ms attributed to the wire explosion. The phenomenon of electric explosion of wire can be described as follows [21]: At high-density (104-107 A/mm2) current pulse produced by the discharge of the capacitor bank passes through the wire (maximum value 105 A/mm2 in our case). In this case the density of the energy in the wire may considerably exceed the binding energy because of the high rate of the energy injection and the expansion lag of the heated material. As a result, the material boils to a burst and a mixture of metallic and water vapors is produced allowing the discharge to be ignited in this medium [21].
Figure 4 Current intensity (black curve) and drop voltage (red) versus time for an applied energy of 3.66 kJ during 11.2 ms and the inter electrodes distance is 1 mm
6
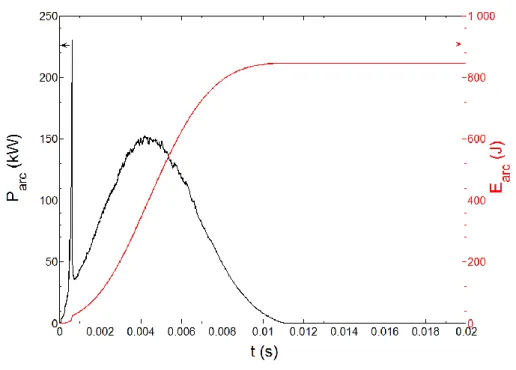
Figure 5 Arc power (black curve) and energy (red) versus time. Total energy applied 3.66 kJ during 11.2 ms and the inter electrodes distance is 1 mm
The energy presented
Figure 5 is directly deduced from the arc power evolution (equation (2)) and can be linked to the bubble radius evolution. More the energy is high; more the Joule effect acts and increases the plasma and the bubble radius. After 9.8 ms the bubble radius decreases as the instantaneous power is not enough to maintain so large plasma and due to the surrounding water the bubble collapses.
This bubble behavior was obtained for energy equals to 3.66 kJ and a distance between the two electrodes d = 1 mm. We propose to analyze the influence of the energy applied in the discharge on the plasma behavior with this distance inter electrode d = 1mm.
3.2 Influence of the energy injected
In this section we study the influence of the energy injected on the plasma behavior for a distance between the two electrodes equals to 1 mm. The injected energy depends on the value of the charge applied. For a charge of Ucapa = 600 V the maximum current intensity is 2.949 kA and the associated energy reaches 5.151 kJ. Table 1
presents plasma and electrical characteristics for several values of Ucapa.
Quantity Unit Values
Ucapa V 200 300 397 494 586 Ecapa J 600 1350 2364 3661 5151 Iarc max A 912.1 1415 1937 2472 2949 Parc max kW 30.0 65.4 97.9 144.5 202.8 tarc max ms 3.8 4.1 3.9 3.9 3.7 Earc J 196.8 407.9 605.4 846.0 1217 Rmax mm 22.9 ± 0.6 30.6 ± 1 34.2 ± 0.8 40.25 ± 0.75 47.7 ± 3 tR max ms 8.4 9.1 8.6 9.8 10.3 ∆Pmax bar 0.065 0.095 0.139 0.159 0.219
7
Table 1 Quantities obtained in water for a distance between the two electrodes d = 1 mm
The increase of the charge leads to an increase of the applied current intensity and of the energy Ecapa. Depending
on the charge, tarc max corresponding to time value of the maximum intensity Iarc max and power Parc max can slightly
differs from 0.4 ms. Nevertheless this time is small compared to the time tR max of the maximum radius Rmax,
which can differs from 2 ms between the lowest and the greatest injected energy Ecapa. For these injected
energies ranged from 600 J to 5.151 kJ, the value of Rmax increases from 22.9 mm at tR max = 8.4 ms with a
differential pressure ∆Pmax of 65 mbar, to 47.7 mm at tR max = 10.3 ms with a differential pressure ∆Pmax of 219
mbar. This bubble behaviors’ tendency is also observed by others authors [11] [12] [22]. The increase of the energy injected to the arc Earc can so be linked to the maximum value of the plasma bubble and so to the
measured pressure.
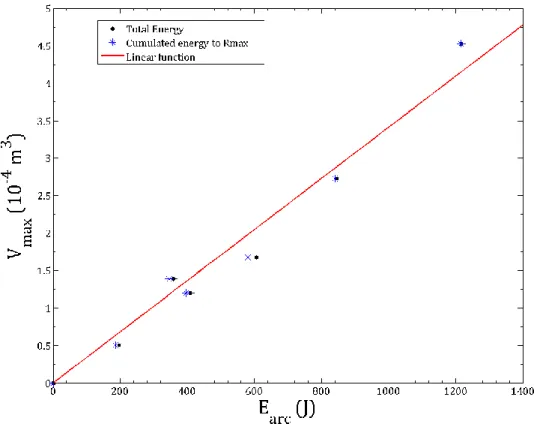
The Figure 6 presents the evolution of the maximum bubble volume versus the injected energy. This linear evolution has a slope of 341.1 cm3/kJ. For a distance between the two electrodes d = 3 mm, the slope is roughly the same ≈ 309.1cm3/kJ. The volume is deduced from experimental measurements based on statistical
measurements on the bubble diameter. The boundary between the two middles (liquid water and water plasma) can be determined by a change on the luminosity which is due to the ombroscopy, and to the arc emissivity. For the two sources the light propagation is different due to the refraction index leading to a highlight of the boundary.
Figure 6 Evolution of the maximal volume of the bubble Vmax versus energy Earc (d = 1 mm)
4. DISCUSSION 4.1 Energy in the bubble
In order to interpret their experimental results, Kattan et al. [23] [24] proposed a model. In their experimental setup charges are injected by pulses (around 250MHz) in a small area of 0.5 by 3 mm between the electrodes in pin-pin configuration. This injected energy is few nano Joules. A maximal radius can be estimated in relation with the electrical energy injected Wi = Earc supposed to be used entirely to heat and to vaporize the liquid and
8 Rw= k ( Wi P∞) 1 3 (4)
According to Kattan et al. [23], Qotba [12] and Jomni et al. [25] k is a coefficient of proportionality depending on thermodynamics properties of the liquid and on initial conditions at P∞ :
k = (3RgTb(P∞) 4πWeb )
1 3
(5)
Rg is the perfect gas constant, Tb the boiling temperature (373.15 K) and Web the enthalpy for the vaporization of
1 mole of liquid.
Web= ∫ CPL(T)dT Tb
T∞
+ Lv(Tb) (6)
CPL is the specific heat of the liquid and LV the latent heat of vaporization of the liquid.
The authors mentioned that differences between theoretical and experimental radius prediction can occur due to some neglected processes as the shock wave. Nevertheless, we have tried to apply this formalism with ours results.
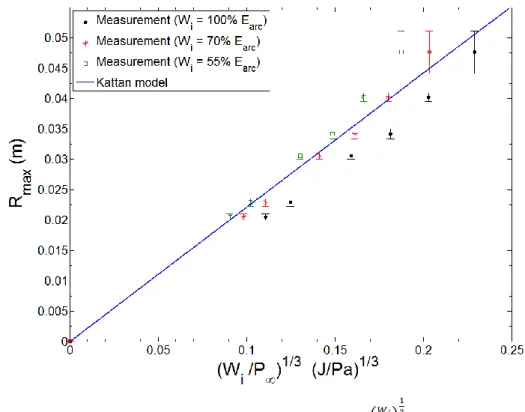
Figure 7 presents the radius evolution versus the energy applied in the plasma. The black symbols represent the maximum radius of the bubble in the experimental case assuming that all the energy is used in the plasma discharge. This is the same assumption than the Kattan [23] work.
Figure 7 Maximum radius of the bubble plotted vs (𝑊𝑖
𝑃∞) 1 3
with d = 1 mm
Differences can be observed. In the Kattan model or with ours experimental data the evolutions of the bubble radius versus the energy present a linear evolution. In arc plasma the losses by radiation can represent roughly 30% of the applied energy as reported by Lu et al. [26]. In the Figure 7 we have plotted with the symbols in red color the radius evolution versus 70% of the energy applied. A better agreement with the Kattan model is found considering the red symbols. It is difficult to quantify the losses by conduction in the electrodes, nevertheless in the Figure 7, the green symbols correspond to 55% of the energy assuming that the losses to the electrodes represent 15% of the energy applied. The well agreement with the Kattan model corresponds to 55%Earc < Wi <
9
4.2 Temperature estimation
In the previous section and Figure 6, the maximum radius can be deduced from the injected energy considering that the losses by radiation represent 30% and that the energy lost in the electrodes is around 15%. The slope of the radius evolution versus the applied energy is 23.5 mm/kJ. Assuming the radiation losses and the losses by conduction to the electrodes, only 55% of the applied energy is available for the plasma bubble. So 550 J are necessary to obtain one radius bubble of 23.5 mm. If we consider a perfect gas with an ambient temperature in this bubble and the atmospheric pressure: Vbubble = 24.10-4 mole. The necessary enthalpy to convert this liquid to
sed. That is to say that the energy available to increase the temperature in the bubble is 452.5 J.
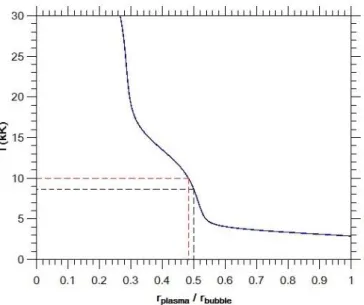
In the bubble the hot temperatures are not present in the entire volume. A big temperature gradient exists from the bubble center to the interface with the liquid dues to oxygen dissociation. A scheme is given Figure 8. With the losses assumptions a parametric study can be performed to estimate the temperature following the ratio of the plasma radius on the bubble one. The Figure 9 represents the mean temperature in the plasma core (Bubble center) depending on the ratio of the plasma radius on the bubble one.
Figure 8 Scheme for the temperature assumption
Figure 9: Mean temperature in the bubble core versus the ratio of the plasma radius on the bubble radius.
Arc
Electrode
Electrode
Radiation losses (30%)
Losses in the electrodes (15%) Bubble radius Estimated radius Plasma Gas Interface liquid-gas Arc
10
For example, if we consider that the radius of the plasma corresponds to the bubble radius divided by two, it is possible to estimate the mean plasma temperature. In this case the volume of the bubble corresponds to Vbubble =
6.8 10-3 l. The enthalpy data versus temperature indicates that in case of water in gaseous phase, 452.5 J allows obtaining a mean temperature in the bubble around 8.9 kK.
4.3 Dynamic Model
Models describing the dynamic of one bubble began with the study of the collapse of an empty spherical cavity in a liquid by Rayleigh in 1917 [17]. This model is then used by others authors as Brenner et al [27] for sonoluminescence, or by Supponen [28] for a short and localized energy induced by laser, or in case of electrical discharges [12] [15] [24] [25] [26]. Nevertheless no studies are related to a bubble created by an electrical arc due to an energy applied during few milliseconds. The Rayleigh’s model is based on the inertia of the liquid surrounding the bubble. It considered the following hypothesis: the fluid is Newtonian and incompressible, the gravity as the surface tension and the viscosity are neglected. The bubble’s cavity is assumed spherical during volume variations [12] [19] [29]. These hypotheses are integrated in the continuity and momentum equations in order to represent the motion of the bubble radius R (equation (7)) [19]:
RR̈ + 3 2 Ṙ2=
PLi(R) − P∞
ρL (7)
With R the instantaneous radius, the dot means the derivative time, PLi(R) the pressure of the liquid at the
bubble interface, ρL is the liquid density, and P∞ the pressure in the liquid at large distance from the bubble. The
first model of Rayleigh considered that the bubble is an empty cavity [17], and the conservation laws at the interface lead to consider PLi(R) = 0 [12]. However in our case, the bubble is full of gas and some additional
hypotheses are needed to establish an expression of PLi(R) linked to the initial conditions. According to Plesset
and Prosperetti [19] PLi(R) is also the pressure within the bubble.
After the applied current wave and the maximum bubble radius reached, due to the fast plasma cooling (> 108 K/s [30]) we assume that the adiabatic evolution of the gas regulates the dynamic of the bubble and that the model proposed by Rayleigh can be used [12] [17]. Thus, the expression of PLi(R) is given by equation (8):
PLi(R) = Pgm(RmaxR ) 3
(8)
Pgm is the gas pressure at the maximal radius of the bubble. We deduced from equation (8) that PLi(Rmax) = Pgm.
Based on the analysis of the movie giving the temporal bubble evolution, we have compared using equation (7), the results model with the experimental evolution from the maximum radius to the total extinguish. Due to the fact that in our case the pressure is unknown we can only perform the comparison from the time which corresponds to the maximum radius. At this instant equilibrium exists and the pressure of the gas is equal to the pressure at the interface. Others models exit to estimate the pressure as the model proposed by Gilmore [31-32]. However in our case the alimentation power can only to distribute 10ms half wave and only one maximum of the bubble radius is reached. Nevertheless we have tried to estimate from the Rayleigh model the pressure.
11
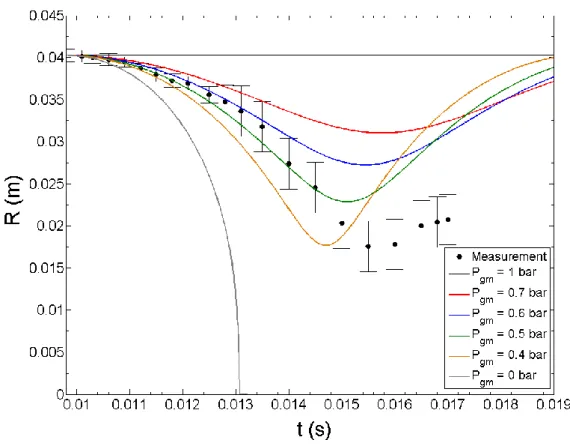
Figure 9 Bubble radius measurements (point) and calculated adapting Rayleigh equation for different values of Pgm. Total energy applied 3.66 kJ during 11.2 ms and the inter electrodes distance is 1 mm
In
Figure , we have plotted the bubble radius versus time for different values of Pgm. The solution of the
equation (8) was obtained by a Runge-Kutta method proposed by Tian et al. [29]. The initial condition is considered at the maximal radius time t = 9.8 ms with a value of R = 40.25 mm and a velocity considered as null Ṙ = 0 m/s. In the
Figure 9, the first model of Rayleigh [12] [17] is presented with PLi(R) = 0 (Pgm = 0 bar in grey). The
theoretical results decrease faster versus time may be due to an underestimation of the pressure at the interface liquid-gas. If we assume that the pressure at the interface equals the atmospheric pressure: Pgm = 1 bar (in black)
and the size of the bubble is stable. These two curves (grey and black ones) correspond to boundary values. We can note that the experimental points are located between the two curves. We have so plotted the variation of the radius versus time for different values of Pgm . The better agreement corresponds to the value Pgm = 0.5 bar (in
green). As observed in
Figure , the resolution of the equation (7) allows describing the bubble radius evolution and the existence of these oscillations is observed in many publications, nevertheless the model assumption needs to consider a spherical shape for the bubble. After time t = 15 ms, due to the collapse, the bubble is not spherical and it is not possible to determine one radius bubble from experimental values.
5. CONCLUSIONS
An experimental setup was developed in order to characterize the bubble expansion due to a wire explosion in water with an inter electrode distance of 1 mm. The energy is distributed through half current wave during ten
12
milliseconds. Electrical measurements are performed on current and voltage. These data are completed by a pressure captor and fast imaging.
The analysis of the movies allows plotting the radius bubble evolution versus time and the maximum bubble radius following the applied energy. The results indicate that few milliseconds separate the time of maximum applied power to the time where the maximum bubble radius was observed. We have also noted that the maximum bubble radius evolution presents a linear evolution changing the applied energy from 200 J to 1300 J. The hot plasma core inside the bubble may represent only one part of the bubble volume. The movies analyze indicates through the luminosity that the ratio of the plasma radius on the plasma bubble should be around 0.5 leading to a mean temperature close to 9kK.
The study was completed by the model proposed by Rayleigh. As initial values are necessaries we have performed the comparison during the collapse phase after the maximum radius of the bubble. Nevertheless, as this model considers first an empty bubble, we do not obtain a good agreement with the comparison with ours experimental results. We have so proposed one modification of the model by adjusting one parameter. The pressure Pgm allows considering the existence of an under-pressure in the bubble, once the energy is not
sufficient to feed the expansion of the bubble. The parametric study on this pressure shows that a value equals to 0.5 bar allows obtaining a good agreement between the model and experimental results for the first moment of collapse. Further investigations are needed for the meaning of the pressure effect on this bubble and the consideration of others parameters such as temperature, in order to integrate it in an advanced dynamic’s models.
6. REFERENCES
[1] W. Chen, O. Maurel, C. LaBorderie, T. D. A. Reess, M. Mattallah, G. Pijaudier-Cabot, A. Jacques et F. Rey-Bethbeder, «Experimental and numerical study of shock wave propagation in water generated by pulsed arc electrohydraulic discharges,» Heat Mass Transfer, vol. 50, pp. 673-684, 2014.
[2] B. Hendricks, «Simulation of plasma arc cutting,» Peninsula Technikon Theses & Dissertations, Cape Town, 1999.
[3] R. Brown et K. Masubuchi, «Fundamental Research on Underwater Welding,» Metal Construction, vol. 6, n° %154, pp. 178s-188s, 1975.
[4] V. Burakov, N. E.A., M. Nedel'ko et N. Tarasenko, «Synthesis and Modification of Molecular Nanoparticles in Electrical Discharge Plasma in Liquids,» Russian Journal of General Chemistry, vol. 85, n° %15, pp. 1222-1237, 2015.
[5] J. Lung, J. Huang, D. Tien, C. Liao, K. Tseng, T. Tsung, W. Kao et e. al., «Preparation of gold nanoparticules by arc discharge in water,» Journal of Alloys and Compounds, Vols. %1 sur %2434-435, pp. 655-658, 2007. [6] H. Lange, M. Sioda, A. Huczko, Y. Zhu, H. Kroto et D. Walton, «Nanocarbon production by arc discharge in water,» Carbon, vol. 41, n° %18, pp. 1617-1623, 2003.
[7] A. Yamatake, D. Angeloni, S. Dickson, M. Emelko, K. Yasuoka et J. Chang, «Characteristics of Pulsed Arc Electrohydraulic Discharge for Eccentric Electrode Cylindrical Reactor using Phosphate-Buffered Saline Water,»
Japanese Journal of Applied Physics, vol. 45, n° %110B, pp. 8298-8301, 2005.
[8] Y. E. Karsik, A. Grinenko, A. Sayapin, S. Efimov, A. Fedotov, V. Gurovich et V. Oreshkin, «Underwater Electrical Wire Explosion and Its Applications,» IEEE Transactions on Plasma Science, vol. 36, n° %12, pp. 423-434, 2008.
[9] A. Kiadehi, M. Jahanshahi, M. Mozdianfard et G. Vakili-Nezhaad, «Investigation of the Solution Electrical Conductivity Effect upon the Synthesis of Carbon Nanotubes by Arc Discharge Method,» Iranica Journal of
Energy & Environment, Special Issue on Nanotechnology, vol. 1, n° %14, pp. 43-48, 2013.
[10] B. Locke et T. S.M., «Analysis and Review of Chemical Reactions and Transport Processes in Pulsed Electrical Discharge Plasma Formed Directly in Liquid Water,» Plamsa Chem Plasma Process, vol. 5, n° %132, pp. 875-917, 2012.
[11] A. Claverie, J. Deroy, M. Boustie, G. Avrillaud, A. Chuvatin, E. Mazanchenko, G. Demol et B. Dramane, «Experimental characterization of plasma formation and shockwave propagation induced by high power pulsed underwater electrical discharge,» Review of Scientific Instruments, vol. 85, n° %16, p. 063701 (8pp), 2014. [12] R. Qotba, Etude expérimentale des phénomènes induits dans un liquide par une injection fortement localisée d'énergie, Grenoble: Université Joseph Fourier - Grenoble 1, Phd Dissertation, 2005.
[13] E. B. Wedmore, W. B. Whitney et C. E. R. Bruce, «An introduction to researches on circuit breaking,»
Journal of the Institution of Electrical Engineers, vol. 67, n° %1389, pp. 557-578, 1929.
[14] G. Blank, Contribution à l'étude du phénomène de rupture dans les disjoncteurs sous huile, Zurich: Ecole Polytechnique Fédérale Zurich, 1932.
13
[15] M. Kanemaru, S. Sorimachi, S. Ibuka et S. Ishii, «Single bubble generated by a pulsed discharge in liquids as a plasma microreactor,» Plasma Sources Science and Technology, vol. 20, n° %13, p. 034007 (7pp), 2011. [16] P. F. series, «FASTCAM SA5 - Photron,» Photron, 1999-2013. [En ligne]. Available: https://photron.com/high-speed/cameras/fastcam-sa5/ .
[17] L. Rayleigh, «VIII. On the pressure developed in a liquid during the collaspe of a spherical cavity,»
Philosophical Magazine Series 6, vol. 34, pp. 94-98, 1917.
[18] R. Beeching, «Resistance to Cavitation erosion,» Trans. Instn. Engrs. Shipb. Scot., vol. 85, pp. 210-276, 1942.
[19] M. Plesset et A. Prosperetti, «Bubble dynamics and Cavitation,» Annual Review Fluid Mechanics, vol. 9, pp. 145-185, 1977.
[20] R. I. Nigmatulin, N. S. Khabeev et F. B. Nagiev, «Dynamics, heat and mass transfer of vapour-gas bubbles in a liquid,» Int. J. Heat Mass Transfer, vol. 24, n° %16, pp. 1033-1044, 1981.
[21] X. Li, Y. Chao, J. Wu, R. Han, H. Zhou et A. Qiu, «Study of the shock waves characteristics generated by underwater electrical wire explosion,» Journal of Applied Physics, vol. 118, n° %12, 2015.
[22] K.-J. Chung, S.-G. Lee, Y. Hwang et C. Kim, «Modeling of pulsed spark discharge inwater and its application to well cleaning,» Current Applied Physics, vol. 15, n° %19, pp. 977-986, 2015.
[23] R. Kattan, N. Bonifaci et A. Denat, «Etude de la génération de bulles dans les hydrocarbures liquides générés par les impulsions de Trichel,» Journal Appleid Physics III, n° %17, pp. 1209-1216, 1991.
[24] R. Kattan, A. Denat et O. Lesaint, «Generation, growth, and collapse of vapor bubbles in hydrocarbon liquids under a high divergent electric field,» Journal of Applied Physics, vol. 66, n° %19, pp. 4062-4066, 1989. [25] F. Jomni, F. Aitken et A. Denat, «Investigation of the Behavior of Microscopic Bubbles in Insulating Liquids: Transition from the Inertial Regime to the Viscous One.,» pp. pp. 194-198, 2002.
[26] X. Lu, Y. Pan, K. Liu et M. Liu, «Spark model of pulsed discharge in water,» Journal of Applied Physics, vol. 91, n° %11, pp. 24-31, 2002.
[27] M. Brenner, S. Hilgenfeldt et D. Lohse, «Single bubble sonoluminescence,» Reviews of Modern Physics, vol. 74, pp. 425-484, 2002.
[28] O. Supponen, D. Obreschkow, M. Tinguely, P. Kobel, N. Dorsaz et M. Farhat, «Scaling laws for jets of single cavitation bubbles,» Journal of Fluid Mech., vol. 802, pp. 263-293, 2016.
[29] H. Tian, C. Yang et Z. Liao, «Numerical simulation of cavitation bubble dynamics based on different frame Rayleigh-Plesset equation,» Asia Simulation Conference - 7th International Conference on System Simulation
and Scientific Computing, Beijing, pp. 1312-1316, 2008.
[30] N. Boudesocque, Contribution à l’étude de plasmas d'arc immergé : applications à la décontamination et à la gazéification d'effluents organiques aqueux, Limoges: Université de Limoges, PhD Dissertation, 2007.
[31] F. Gilmore, The growth or collapse of a spherical bubble in a viscous compressible liquid. Technical report n°26-4 California Institute of Technology.
[32] Graaf K.L., Penesis I. and Brandner P.A. Modelling of seismic airgun bubble dynamics ans pressure fiels using the Gilmore equation with additional damping factors. Ocean Engineering 76, 32-39, 2014