HAL Id: hal-03185958
https://hal.archives-ouvertes.fr/hal-03185958
Submitted on 30 Mar 2021
HAL is a multi-disciplinary open access
archive for the deposit and dissemination of sci-entific research documents, whether they are pub-lished or not. The documents may come from teaching and research institutions in France or abroad, or from public or private research centers.
L’archive ouverte pluridisciplinaire HAL, est destinée au dépôt et à la diffusion de documents scientifiques de niveau recherche, publiés ou non, émanant des établissements d’enseignement et de recherche français ou étrangers, des laboratoires publics ou privés.
Distributed under a Creative Commons Attribution| 4.0 International License
To cite this version:
Frédéric Lalanne, Pierrick Bedouch, Cyril Simonnet, Vincent Depras, Georgeta Bordea, et al.. Visual-izing food-drug interactions in the Thériaque database. 31st Medical Informatics Europe Conference (MIE), May 2021, Athens (virtual), Greece. �hal-03185958�
Visualizing food-drug interactions
in the Thériaque database
Frédéric LALANNEa, Pierrick BEDOUCHb,c,1, Cyril SIMONNETd,
Vincent DEPRASb, Georgeta BORDEAd, Romain BOURQUIa,
Thierry HAMONe,f, Frantz THIESSARDd, Fleur MOUGINd a Univ. Bordeaux, CNRS, LaBRI UMR 5800, F-33000 Bordeaux, France
bCNHIM, F-75014, Paris, France
c Univ. Grenoble Alpes, CNRS, TIMC UMR 5525, F-38000 Grenoble, France d Univ. Bordeaux, INSERM, BPH, U1219, F-33000 Bordeaux, France
e Univ. Paris-Saclay, CNRS, LISN, F-91400 Orsay, France f Univ. Sorbonne Paris Nord, F-93430 Villetaneuse, France
Abstract. This paper presents a prototype for the visualization of food-drug
interactions implemented in the MIAM project, whose objective is to develop methods for the extraction and representation of these interactions and to make them available in the Thériaque database. The prototype provides users with a graphical visualization showing the hierarchies of drugs and foods in front of each other and the links between them representing the existing interactions as well as additional details about them, including the number of articles reporting the interaction. The prototype is interactive in the following ways: hierarchies can be easily folded and unfolded, a filter can be applied to view only certain types of interactions, and details about a given interaction are displayed when the mouse is moved over the corresponding link. Future work includes proposing a version more suitable for non-health professional users and the representation of the food hierarchy based on a reference classification.
Keywords. food-drug interactions, data visualization, hierarchical data
1. Introduction
The French ANR PRCE MIAM project2 (2017-2020) aims to identify and model
food-drug interactions. It focuses on the problems that can emerge when an interaction occurs between a food and a drug. In practice, the consumption of a food associated with the intake of a drug can have three effects: (i) the attenuation or suppression of the effect of a drug, (ii) the increase of the effect of a drug, and (iii) the occurrence of unknown adverse effects. This information, when available, is described in scientific publications or knowledge bases in an unstructured manner. Thus, MIAM partners have used natural language processing methods to extract such information and made it available within the Thériaque database3. This database has been approved by the French National
Authority for Health (HAS) and aims at providing health professionals and patients with
1 Corresponding author: Pierrick Bedouch; E-mail: [email protected]
2https://miam.limsi.fr
exhaustive and reliable information about the drugs available in France. Thériaque is integrated into many French hospital computerized prescription order entry systems in order to propose drug decision systems and it is accessible through a website. In addition to drug-drug interaction and drug recommended dosage, Thériaque will therefore be able to provide information on food-drug interactions in the near future.
In this frame, a prototype has been created in order to show and visually explore interactions between foods and drugs. To visually represent foods, drugs and their interactions, we have taken advantage of the fact that foods and drugs can both be organized hierarchically. Each interaction may be displayed as a link between a node from each tree and may have a type and a degree of confidence as well as a source reference.
In their survey of multi-tree visualization approaches, the authors listed five types of representations for visualizing two trees: edge-drawing, matrix, colouring, animation, and agglomeration [1]. The last three approaches did not suit our needs because they do not allow to link a node of a tree with several nodes of the other tree. On the other hand, the use of the matrix did not seem appropriate given the low density of the edges between the trees and the size of the trees as this would have led to a too large drawing (i.e. most of the boxes of the matrix would have been empty).
We thus chose the edge-drawing approach, and more precisely the technique presented by Holten et al. [2] as a starting point for the design of the visualization prototype. More specifically, the goal is to visualize two hierarchies and matching elements between those hierarchies. This is achieved by displaying both hierarchies using icicle plots [3,4] on opposite sides of the window. This layout method consists in displaying children nodes beneath their common parent. The horizontal abutment of the children nodes next to their parent gives the hierarchical relations. Matched elements of the hierarchies are linked by a line drawn between them using hierarchical edge bundles [5] to decrease visual clutter. Hierarchical edge bundles help to assess the proximity of extremities of links in the hierarchical structure: a couple of links connected to nodes with a common parent will join a same bundle close to their extremities. On the opposite, if link extremities have no non-trivial common ancestor, they will not form a bundle.
2. Methods
2.1. Materials
First of all, we collected food-drug interactions from the 2008 and 2016 versions of the Stockley’s Drug interactions compendium4, which include interactions involving foods.
As described in [6], we manually extracted the food-drug interactions and automatically retrieved the corresponding PubMed identifiers from the title and year of each reference listed for each interaction.
2.2. Visualization approach
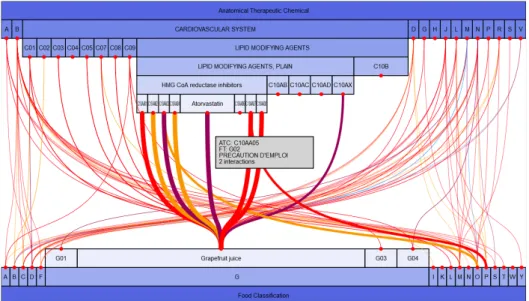
In this work, the hierarchical structures displayed in the icicle plots represent the hierarchy of drugs (using the Anatomical Therapeutic Chemical (ATC) Classification
System) and a hierarchy of foods, based on the alphabetical order. Links between hierarchies depict interactions between foods and drugs (Figure 1).
The main adaptations we had to make to the work of Holten et al. [2] are as follows: • visualization of supplementary information: (i) the type of food-drug interactions, being one of Contraindication, Discouraged association, Precaution of use and To be taken into account (four types, ordered from the most harmful to the least damaging, as recommended by the French Agency for the Safety of Medicines and Health Products), and (ii) the number of articles reporting the interaction,
• multiple links between elements of the two hierarchies as each food might interact with several drugs, and the other way around. Thus, we both needed to represent elements with multiple links and a number of links that might be, for matching the size of hierarchies, substantially higher than in [2].
Thus, we use different colors to represent the type of each interaction. If multiple types are associated with a given food-drug interaction (thus described in more than one article), the chosen color is the one of the more harmful type. On the other hand, the nodes in the same hierarchy have the same color, from the darkest color for the root to the lightest color for the leaves.
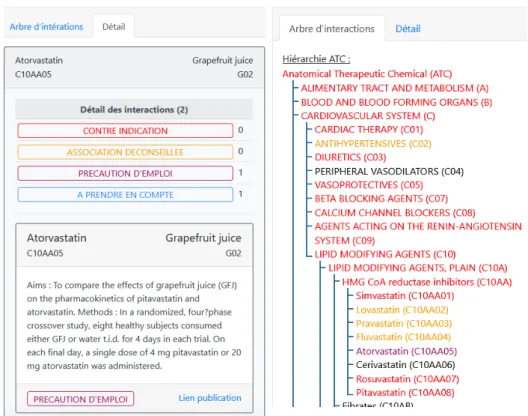
In addition to the graphical view of hierarchies and interactions between them, a more traditional view has been created on the right side of the interface. The right view provides a representation of hierarchies in the form of trees (“Arbre d’interactions” tab) and details about the interaction (“Détail” tab), i.e. the type of interaction, the number of articles reporting it and the list of corresponding articles (abstract and the hyperlink to access the article).
3. Results
A total of 560 interactions were acquired from the 2008 and 2016 versions of the Stock-ley Drug interactions compendium. Only 444 were selected for use in the prototype be-cause a match had to be found between the drug name and a corresponding label in the ATC. The prototype allows users to perform their analysis by looking for interactions based on: (i) a drug or a set of drugs (including drugs classes), (ii) a food or a set of foods, or (iii) a combination of both.
Figure 1 presents the left-hand side of the interface, that is the graphical view of food-drug interactions implemented in the prototype. Figure 2 exhibits the right-hand side of the interface, that is either the tab showing the tree view of hierarchies or the tab displaying details about the interactions described hereafter.
We provide a system of on-demand details, as well as an element-based filtering of the interactions to allow users to focus on a limited part of the hierarchies. To cope with the potentially high number of links, hindering both the tool’s performance and visual perception, we choose to first display an overview of the data by displaying only nodes of depth one at most. In this state, instead of being connected to leaf nodes of the hierarchies, links can be connected to the nearest ancestor of an undisplayed leaf node. Users can then choose to unfold some of the hierarchy elements to get a higher level of detail on the specific part of the hierarchies they are interested in. Alternatively, users can choose to fold a previously unfolded inner node to hide its subtree. If users want more or less detail on an entire hierarchy, the same operation can be performed level- wise: all nodes of the same depth will be folded or unfolded. In addition, a mouse-over
Figure 1. Graphical view of interactions existing between Atorvastatin and Grapefruit juice. Red, orange,
purple and blue links correspond respectively to the following types of interaction: contraindication, discouraged association, precaution of use and to be taken into account. The broader links correspond to interactions involving the element(s) initially searched for (here, Grapefruit juice).
of the link gives details of the interaction in a small grey window. Specifically, the two connected nodes, the type(s) of interaction and the number of articles reporting it are displayed. Finally, the graphical (left side of the interface) and more traditional (right side of the interface) views are automatically updated based on user actions in either view. In particular, users can filter interactions according to their type by clicking on the desired type in the right view, which results in only that type of interaction being displayed in the graphical view.
4. Discussion
The proposed prototype provides an original and graphical way to explore food-drug interactions. It will be integrated within the Thériaque database in the coming weeks.
It should be noted that the exploration of the drug hierarchy requires familiarity with the ATC system, and in particular its codes. This is of course a limitation to the use of the prototype by patients, who are also a target audience for Thériaque. An obvious perspective is to proceed to the evaluation of the prototype with the different user groups to which the Thériaque database is addressed. Moreover, the food hierarchy is based on the alphabet whereas the use of a hierarchy with semantic meaning would be more relevant. In this framework, the food hierarchy described in FIDEO [7] could be used.
In our future work, we also plan to recover other food-drug interactions. This is the broader goal of the MIAM project and one of the avenues currently being explored is the contents of DrugBank. The latter is a knowledge base in which 1195 food-drug interactions are described [8]. This information is provided in free text and thus needs to be processed with NLP algorithms so that the food(s) mentioned as interacting with the drug of interest are identified.
Figure 2. Right hand side of the interface. On the left, the tab listing details about the food-drug interactions.
On the right, the tab presenting the drug and food hierarchies (only the drug hierarchy is visible here). Acknowledgements. This work was supported by the projects MIAM through
grantANR-16-CE23-0012 and kANNa through grant H2020 MSCA-IF-217 number 800578.
References
[1] Graham M, Kennedy J. A survey of multiple tree visualisation. Information Visualization. 2010;9(4):235-52.
[2] Holten D, Van Wijk JJ. Visual comparison of hierarchically organized data. Computer Graphics Forum. 2008;27(3):759-66.
[3] Graham M, Kennedy J. Extending taxonomic visualisation to incorporate synonymy and structural markers. Information Visualization. 2005;4(3):206-23.
[4] Sifer M. Filter co-ordinations for exploring multi-dimensional data. Journal of Visual Languages and Computing. 2006;17(2):107-25.
[5] Holten D, Hierarchical edge bundles: Visualization of adjacency relations in hierarchical data, IEEE Transactions on Visualization and Computer Graphics. 2006;12(5):741-48.
[6] Bordea G, Thiessard F, Hamon T, Mougin F. Automatic query selection for acquisition and discovery of food-drug interactions. Proceedings of CLEF: Experimental IR Meets Multilinguality, Multimodality, and Interaction, Springer International Publishing. 2018. p. 115-20.
[7] Bordea G, Nikiema JN, Griffier R, Hamon T, Mougin F. FIDEO: Food Interactions with Drugs Evidence Ontology. Proceedings of the 11th International Conference on Biomedical Ontologies. 2020. p. L.1-10. [8] Wishart DS, Feunang YD, Guo AC, Lo EJ, and colleagues. DrugBank 5.0: a major update to the DrugBank