HAL Id: hal-02001975
https://hal.archives-ouvertes.fr/hal-02001975
Submitted on 31 Jan 2019
HAL is a multi-disciplinary open access
archive for the deposit and dissemination of
sci-entific research documents, whether they are
pub-lished or not. The documents may come from
teaching and research institutions in France or
abroad, or from public or private research centers.
L’archive ouverte pluridisciplinaire HAL, est
destinée au dépôt et à la diffusion de documents
scientifiques de niveau recherche, publiés ou non,
émanant des établissements d’enseignement et de
recherche français ou étrangers, des laboratoires
publics ou privés.
Chemiluminescence based operating point control of
domestic gas boilers with variable natural gas
composition
Yi Ding, Daniel Durox, Nasser Darabiha, Thierry Schuller
To cite this version:
Yi Ding, Daniel Durox, Nasser Darabiha, Thierry Schuller. Chemiluminescence based operating point
control of domestic gas boilers with variable natural gas composition. Applied Thermal Engineering,
Elsevier, 2019, 149, pp.1052-1060. �10.1016/j.applthermaleng.2018.12.106�. �hal-02001975�
OATAO is an open access repository that collects the work of Toulouse
researchers and makes it freely available over the web where possible
Any correspondence concerning this service should be sent
to the repository administrator:
[email protected]
This is an author’s version published in:
http://oatao.univ-toulouse.fr/21452
To cite this version:
Ding, Yi and Durox, Daniel and Darabiha, Nasser and
Schuller, Thierry Chemiluminescence based operating point
control of domestic gas boilers with variable natural gas
composition. (2019) Applied Thermal Engineering, 149.
1052-1060. ISSN 1359-4311
Official URL:
https://doi.org/10.1016/j.applthermaleng.2018.12.106
Chemiluminescence based operating point control of domestic gas boilers
with variable natural gas composition
Yi Ding
a,b,⁎, Daniel Durox
a, Nasser Darabiha
a, Thierry Schuller
a,ca Laboratoire EM2C, CNRS, CentraleSupélec, Université Paris Saclay, 3 rue Joliot Curie, 91192 Gif-sur-Yvette, France b Bosch Thermotechnologie, 126 rue de Stalingrad, 93700 Drancy, France
c Institut de Mécanique des Fluides de Toulouse, IMFT, Université de Toulouse, CNRS, 2 Allée du Professeur Camille Soula, 31400 Toulouse, France
H I G H L I G H T S
•
Equivalence ratio control of domestic gas boilers using chemiluminescence signal.•
Demonstrative equivalence ratio control loop using OH∗signal and air flow rate.•
Regulation strategy validated with different natural gas compositions. A R T I C L E I N F OKeywords:
Domestic gas boiler Flame chemiluminescence Equivalence ratio regulation Biogas
Hydrogen
A B S T R A C T
The current control strategy of domestic gas boilers optimizes the heating efficiency and pollutant gas emissions assuming a fixed fuel composition. However, larger and more frequent variations of gas composition are ex-pected in the European natural gas network. New control systems capable of monitoring and regulating the flame equivalence ratio in real time are therefore necessary. The present work investigates one equivalence ratio sensing strategy by analyzing the flame chemiluminescence signal from a laminar premixed burner widely used in domestic gas boilers. The OH∗chemiluminescence intensity is first identified as a reliable equivalence ratio indicator, valid for different natural gas composition scenarios with CH4diluted by N2or CO2or enriched by H2, C2H6or C3H8. These fuel mixtures are representative of biogas and hydrogen enriched natural gas. A demon-strative control loop is developed based on the OH∗signal measured by a photomultiplier tube mounted with a bandpass optical filter. The system is tested by changing the equivalence ratio set value and the fuel composition. It is shown to be capable of regulating the equivalence ratio of these natural gas fuel blends with a good pre-cision. The differences observed between the real and target values for the equivalence ratio are in most cases lower than| |=0.01. Only fuel blends with C H3 8lead to slightly larger errors of| |=0.03.
1. Introduction
The European natural gas network is expecting larger and more frequent variations of the gas composition in the future. This evolution results first from a more diversified set of supply sources due to the liberalization of the gas market. It results also from the growing in-tegration in the network of gases from renewable resources as biogas and hydrogen[1,2]. These evolutions set a challenge for domestic gas boiler manufacturers, who must ensure optimized performances of their apparatus despite the composition variations of gas supply.
Fully premixed burners are widely used in modern household gas boilers[3,4]. To maximize the heat efficiency and reduce CO and NOx emissions, it is important to control the combustible mixture
equivalence ratio at all operating conditions including the transient states. Insufficient excess air leads to high CO emissions due to in-complete combustion and high flame temperatures also promote NOx production[5]. On the other hand, too much excess air causes flame detachment, prone to CO production as well, and the heat efficiency is also compromised due to higher heat losses in the flue gases[6]. A compromise is therefore sought and the equivalence ratio should be maintained within an optimized range[4]. The current boiler control strategy assumes a fixed natural gas composition but this paradigm is not valid anymore. An automatic combustion control system is neces-sary to regulate the operating point according to the changes of the fuel blend composition. For this purpose, the first challenge is to detect the equivalence ratio in real time with low cost sensors.
⁎Corresponding author at: Laboratoire EM2C, CNRS, CentraleSupélec, Université Paris Saclay, 3 rue Joliot Curie, 91192 Gif-sur-Yvette, France.
E-mail address:[email protected](Y. Ding).
Reviews on potential sensor technologies for the equivalence ratio detection have been carried by Docquier and Candel[7]and by Tschu-lena and Lahrmann [8]. Current regulation systems emerging on the market are generally based on sensing the flame ionization current [9,10], thanks to the simplicity of this technique. However, the ioniza-tion current intensity is sensitive to the fuel composiioniza-tion, which may cause errors for detecting the equivalence ratio. These errors may have two origins. First, variations of the fuel composition modify the laminar burning velocity and hence the flame standoff distance with respect to the burner outlet[11], which largely decides the ionization current in-tensity[12–14]. The magnitude of the resulting error on the equivalence ratio has been characterized in a previous work[12]. Secondly, when the ionization probe is set downstream the flame front in the burnt gases region, the ionization current intensity becomes very sensitive to the flame-probe distance, which may vary with different gas compositions.
The present work explores an alternative solution to control the equivalence ratio of methane blends with a secondary component by analyzing the flame chemiluminescence signal. This signal is well known to be sensitive to the equivalence ratio and is also easy to measure [15–18]. Techniques based on sensing the chemiluminescence signal from flames to monitor the equivalence ratio of industrial burners have been reviewed by Ballester and García-Armingol[18]. These techniques have also been recently envisaged to control gasification processes by relating the chemiluminescence signal with the oxygen to carbon ratio[19,20].
A commonly used equivalence ratio indicator for lean hydrocarbon fuel/air flames is the CH∗/OH∗intensity ratio[21]. This signal has the
advantage to barely depend on flame power and strain rate [22–25]. Docquier et al.[26]developed a laboratory demonstrative equivalence ratio controller for a conical methane-air flame based on a lookup table consisting of two intensity ratios OH∗/CH∗ andCO
2/CH∗. This control
strategy was tested with success to adjust the equivalence ratio to the set value for methane/air mixtures and also when the fuel is diluted with N2.
However, it has recently been shown that, although the CH∗/OH∗intensity
ratio remains a reliable indicator of the equivalence ratio for N2and CO2
diluted methane mixtures, considerable errors are introduced forC H2 6and
C H3 8enriched methane blends even with relatively low volumetric
frac-tions of these secondary components[12]. These two latter components are common in natural gases[27]and their impact on equivalence ratio sensing needs to be considered. An alternative indicator valid for all possible natural gas compositions needs therefore to be identified.
The present work aims at demonstrating the feasibility of equiva-lence ratio regulation by real time analysis of the chemiluminescence signal for a laminar premixed burner widely used in domestic gas boilers. A new equivalence ratio sensing strategy is first developed using the OH∗intensity and additional information on the air flow rate.
This strategy validated for pure methane/air mixtures is then tested by adding different concentrations of N2, CO2, H2,C H2 6and C H3 8to the
pureCH4. The transient response of the OH∗signal following a cold
start of the burner is also investigated. These tests are then used to develop a control loop of the equivalence ratio with a LabVIEW pro-gram. The demonstrative control loop is finally tested by changing the equivalence ratio set value and also the fuel composition and examining the performances of the regulation system.
2. Experimental setup
2.1. Burner
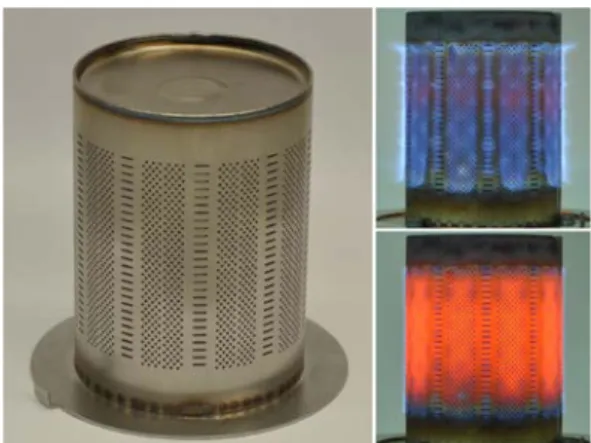
Experiments are performed on the cylindrical multi-perforated burner shown inFig. 1widely used in modern household gas boilers and operating with fully premixed combustible mixtures. It is made of stainless steel designed to resist high flame temperatures. The surface of the burner consists of hundreds of tiny circular holes ( = 0.8 mm) and rectangular slits (4 mm×0.5 mm). The operational power of this burner covers a range of 3 to 14 kW or 3 to 30 kW when the burner is equipped with slightly different internal flow guiding structures. The
large power modulation range of this type of burner allows to meet the needs of varying heating power demand without frequent ON/OFF cycles that compromise the global energy efficiency of the system. At high power, small blue flames are stabilized above the burner surface and the operational mode is designated as “regular” as illustrated in Fig. 1(upper right). In this regime, the thermal power is essentially transmitted to the load by convection. At low power, the flames are stabilized close to burner surface with significant heat transfer to the metallic burner components. In this case, the heat is transferred to the heat exchanger through thermal radiation of the hot burner compo-nents as well and the burner works under the so-called “radiation mode” as inFig. 1(lower right).
2.2. Chemiluminescence intensity measurement
Fig. 2shows a schematic of the experimental setup for the chemi-luminescence signal characterization. The flame light emission is re-corded in two ways. For the analysis conducted in Section3aiming at identifying an equivalence ratio indicator, a spectral decomposition of the light detected over 200–900 nm is made with an OceanOptics USB2000 + spectrometer. This device is represented on the left side in Fig. 2. The optical signal is collected by a lens (F = 10 mm, =3 mm) set at a distance of about 30 cm away from the burner surface. The field of view integrates therefore a representative circular interrogation area of about = 30 mm on the burner surface.
A typical spectrum gathered from the burner is shown inFig. 3. In addition to the chemiluminescence emissions of OH∗, CH∗,C
2andCO2
radicals, a strong continuous spectrum associated to the blackbody diation is visible above 500 nm when the burner operates under the ra-diation mode. The detected spectrum I ( ) is the real spectrum I ( )
emitted by the flame filtered by the device response function:
=
I( ) I( ) ( )R . Correction for the apparatus response functionR ( )is not performed in this study, since only evolutions of the emission in-tensities rather than their absolute values are of interest in the present study. The chemiluminescence intensities of OH∗, CH∗andC
2 are
de-termined by measuring the height of the emission peaks with respect to the baseline emission background[28]. Indeed, the interpretation of the
Fig. 1. Photos of the fully premixed cylindrical multi-perforated burner (left),
working under regular mode (upper right) and radiation mode (lower right).
chemiluminescence intensity by taking the peak height or the peak area makes no significant difference as the shapes of the peaks are generally self-similar[29]. The broadband emission ofCO2is often represented by
its value at 450 nm[30]. However, invasion of the blackbody radiation is probable at this wavelength when the burner operates under the radia-tion mode. An alternative choice is to infer theCO2signal at a slightly
shorter wavelength of 370 nm to avoid any interference with the thermal radiation of the hot metallic components of the burner.
The chemiluminescence intensity is also determined, as represented on the right side in Fig. 2, with a photomultiplier tube (Hamamatsu H11902-110) mounted with a bandpass optical filter centered at the corresponding wavelength, set at about 50 cm from the burner. Mea-surements with this second technique are easier and faster. They are used in Section4for the equivalence ratio control loop. The field of view is large in this case and includes the whole burner. However, all the light emission originating from the different radicals within the filter passband is integrated, without the possibility of removing the continuous baseline attributed essentially to the CO2 emission and
thermal radiation from the hot metallic components. This is acceptable to detect the OH∗contribution as its intensity is dominant in the
cor-responding range of wavelengths from 300 to 325 nm. However, the weaker peak emissions of CH∗around 431 nm andC
2around 516 nm
cannot be measured reliably in this way.
3. Equivalence ratio sensing
3.1. Indicator for equivalence ratio
The aim of the present work is to monitor and automatically reg-ulate the equivalence ratio by analyzing the flame chemiluminescence signal when the natural gas composition varies. A reliable indicator for the equivalence ratio is required for this purpose. The indicator should be sensitive to changes of equivalence ratio, but insensitive to the fuel composition. Ideally it is also desirable to be independent of flame power. Possible indicators are tested with pure methane and binary fuel blends composed of methane and one of the secondary components including N , CO , H , C H2 2 2 2 6 and C H3 8. The volumetric fractions of
secondary components in the fuel blends are selected as follows:
= = = = =
Xfuel(N )2 10%,Xfuel(CO )2 10%, Xfuel(H )2 20%, Xfuel(C H )2 6 10%, Xfuel(C H )3 8 5%.
In these expressions, Xfuel( )Y stands for the volumetric fraction of the
secondary component Y with respect to the methane and secondary component blend: Xfuel( )Y =XY/(XCH4+XY). They are chosen to re-present the maximum values expected in future natural gas blends in EU by also considering the injection of biogas and hydrogen[27,31].
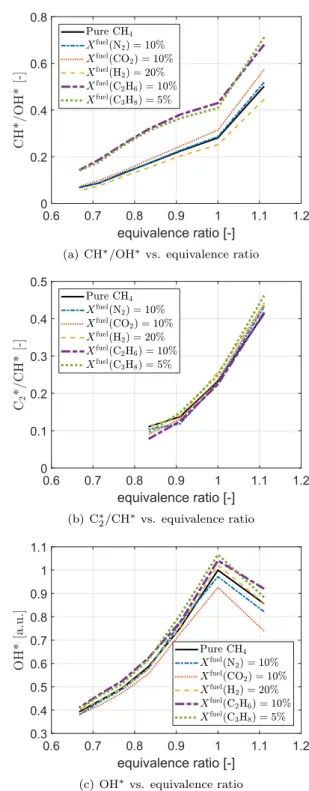
Three indicators including the CH∗/OH∗andC
2/CH∗intensity ratios
and the OH∗intensity are plotted as a function of the equivalence ratio
inFig. 4for different fuel compositions and a fixed power of =P 13 kW.
The intensity ratio CH∗/OH∗is commonly used to deduce the
equiva-lence ratio in many premixed systems powered by methane/air flames. However,Fig. 4a reveals that addition ofC H2 6 and C H3 8 leads to a
considerable drift of the response with respect to the reference case with pure CH4. The resulting bias error| |>0.1between the predicted
and real values for the equivalence ratio of the fuel mixture with these secondary component concentrations is too big for the targeted appli-cation of flame monitoring. The same conclusion was reached in[12] for a conical flame. The CH∗/OH∗intensity ratio is therefore not a
re-liable and robust indicator for methane blends with heavier hydro-carbon components.
Fig. 3. Typical spectrum of a methane-air flame stabilized on the cylindrical
multi-perforated burner. =P 13 kW, =1.0.
Fig. 4. Evolutions of CH∗/OH∗, C
2/CH∗intensity ratios and OH∗intensity as a function of equivalence ratio for different fuel compositions and a fixed power
= P 13 kW.
C2
Injection of secondary components cause very small drifts of theC2/CH∗
signal. Differences between the real and predicted equivalence ratios remain lower than| |=0.03. However, theC2emission intensity remains weak
for methane-air flames and is hardly detectable at lean conditions for 0.8. The operable range of theC2/CH∗intensity ratio available to safely
recover the equivalence ratio in Fig. 4b is insufficient for domestic gas boilers operating around = 0.8. Nevertheless, the curves inFig. 4b are monotonic over the range 0.83 1.11and this indicator exhibits ex-cellent robust properties with respect to fuel composition variations. It then has the potential to be used to control combustion apparatus operating closer to stoichiometry, or used in combination with another indicator more suitable to leaner operating conditions.
A simpler alternative is envisaged inFig. 4c by examining the OH∗
intensity alone. The response of the OH∗intensity as the equivalence
ratio changes is barely altered by the injection of all secondary com-ponents tested and the bias error on the detected equivalence ratio remains limited within| |<0.03. Also, the response is monotonic over 0.67 1.00, a dynamical range which is large enough and covers that of many gas boiler burners. One may however note a different trend beyond stoichiometry.
The OH∗intensity signal is therefore an appropriate equivalence
ratio indicator for the targeted application of flame monitoring in a domestic gas boiler. Nevertheless, as only one emission intensity is used, the impact of flame power needs to be considered as well. This issue is addressed below in Section3.2.
3.2. Equivalence ratio sensing with OH∗signal
The previous experiments led to the conclusion that the OH∗intensity
signal is a reliable equivalence ratio indicator, with very limited impact of the fuel composition. In addition, from the viewpoint of application to real gas boilers, this strategy also offers several important advantages:
•
The OH∗intensity can be measured reliably with a photomultipliertube equipped with a narrow bandpass filter, without the need of subtracting the CO2 background emission intensity. This record
technique has the advantage of being easier, faster and less ex-pensive than using a spectrometer.
•
The simplicity of the technique based on a unique signal intensity without various correction procedures makes it promising to be realized with low cost alternative sensors. Use of UV light sensing photodiodes might for example lead to further cost cutting.•
The fact that the OH∗intensity lies in the UV range makes itin-sensitive to the impact of indoor lighting and also inin-sensitive to thermal radiation from the hot solid surfaces of the burner with light emission covering the visible and IR bands, even though the sunlight radiation might still need to be considered.
Despite these advantages, one difficulty is that the OH∗intensity
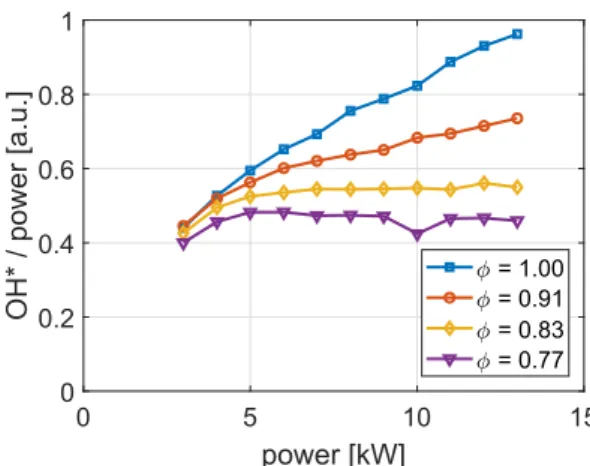
directly depends on the flame thermal power. In addition, previous studies have highlighted that for the cylindrical multi-perforated burner used in the present study, the chemiluminescence intensity does not evolve linearly with the flame power over all the operating range of the burner[29]. The OH∗specific intensity corresponding to the
chemilu-minescence intensity normalized by the flame power inFig. 5does not remain constant at low power or close to stoichiometric operating conditions. Sensing the equivalence ratio based on the OH∗emission
intensity can therefore not be envisaged with a single calibration curve. In a gas boiler, the flame power is not readily known and can only be determined from the natural gas flow rate and its composition. How-ever, this missing information on the power can substituted by the air flow rate, which can be easily deduced from the air fan speed.
A sensing strategy relying on a series of calibration curves for dif-ferent air flow rates is here developped. For each air flow rate, the OH∗
intensity alone is used as an indicator of the equivalence ratio of the
combustible mixture. The equivalence ratio can therefore be de-termined during operation by measuring the OH∗intensity, the air flow
rate being deduced from the air fan speed.
Calibration curves of the OH∗intensity vs. equivalence ratio are first
recorded for methane/air mixtures at fixed air flow rates.Fig. 6gathers data for six equivalence ratios and seven air flow rates. Measurements are carried out only when the OH∗signal intensity has reached steady
state conditions, considering the time necessary for the signal to sta-bilize following a cold start of the burner or a sudden change of the flow operating conditions. Results for different operating conditions are discussed below in Section3.3. This set of curves is then transformed into a 3-D calibration surface inFig. 7by interpolation of the data. For the burner in operation powered by an unknown fuel blend mixture, the equivalence ratio of the combustible mixture is deduced by interpola-tion of the data gathered for the air flowrate and the OH∗intensity on
the 3-D calibration surface built for pure methane.
3.3. Uncertainty analysis 3.3.1. Impact of fuel composition
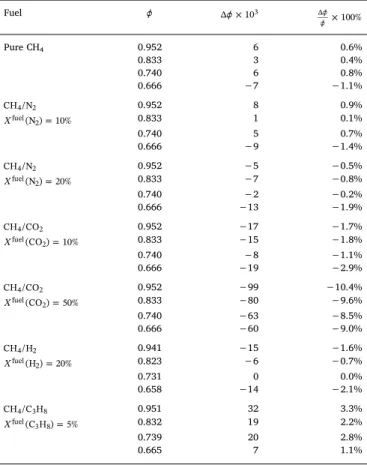
The performance of the equivalence ratio sensing strategy is investigated for the different fuel compositions listed in the first column ofTable 1. Four equivalence ratios = 0.67, 0.74 , 0.83, 0.95 are considered for each sce-nario. The investigated secondary components include N , CO , H2 2 2 and
C H3 8. The impact ofC H2 6enrichment can be deduced from the results for
C H3 8enrichment and is not repeated. A scenario with unpurified biogas is
also considered with 50 vol.%CO2in the fuel blend.
Fig. 5. OH∗specific intensity vs. power. CH
4-air flames at different equivalence ratios .
Fig. 6. Calibration curves of OH∗intensity vs. equivalence ratio for different air flow rates Vair. OH∗intensities are measured by a photomultiplier tube mounted
with a bandpass filter centered at 310 nm. CH4-air mixture.
Equivalence ratio sensing is performed when the OH∗signal is well
stabilized and each measurement is repeated five times to get an average value and determine a standard deviation. With a record time of one second of the photomulitplier signal, the standard deviation of the deduced equivalence ratio is lower than 0.001. The absolute and relative bias errors of are listed in the third and fourth columns in Table 1. The absolute bias error | |remains below 0.01 for op-eration with pure methane or with N2dilution up to 20 vol.% This bias
error slightly increases to 0.02 with 10 vol.%CO2or 20 vol.% H2in the
fuel blend. However, for unpurified biogas with 50 vol.%CO2, the
equivalence ratio becomes largely underestimated with | |up to 0.1, making the results unusable for control purpose. With 5 vol.%
C H3 8, the bias error is relatively large near stoichiometry with
| | 0.05but drops within the acceptable limit at leaner condi-tions. Since a domestic gas boiler operates typically around = 0.8 these bias errors remain acceptable.
3.3.2. Impact of signal transient
Another potential source of error is the transient response of the OH∗
signal following a cold start of the burner after ignition or a sudden change of the flow operating conditions. InFig. 8, the burner is ignited from cold conditions at different powers =P 4and 9 kW and different equivalence ratios = 0.67 and 0.95. The OH∗signal is recorded over a
period of 6 min and the signal intensities are normalized by their steady state value reached at the end. The OH∗intensity during the first instants
is only 60–80% of the final value Imax, and it takes 2–3 min to reach the
stabilized final value. This transient response is attributed to the time necessary for the burner temperature to reach steady conditions.
The delayed response of the OH∗signal can also be observed after a
sudden change of the flow operating conditions, as shown for example in Section4.2. The equivalence ratio deduced from the OH∗signal is
therefore incorrect during this transient period, which typically takes 10–20 s. The lag of the OH∗intensity response may be an issue if the
characteristic time of the changes of the flow operating conditions is of the same order of magnitude or shorter than the time requested for signal stabilization. For example, the burner power is likely to be sub-ject to frequent and drastic changes according to the demand for heating and hot water. This time lag needs therefore to be taken into account in the design of the future control algorithm in a real gas boiler. On the other hand, variations of the natural gas composition are rela-tively slow and mild, hence a certain time lag can be tolerated.
4. Demonstrative equivalence ratio control loop
4.1. Control loop construction
A demonstrative equivalence ratio control system is now developed. The system uses three Bronkhorst mass flow meters controlled by a LabVIEW program. They are used to change separately the mass flow
Fig. 7. Equivalence ratio sensing with the OH∗intensity. CH
4-air mixture.
Table 1
Tests of the equivalence ratio sensing strategy based on OH∗emission records. denotes the equivalence ratio of the combustible mixture deduced from the gas flow rates injected in the system. is the equivalence ratio deduced from the sensing strategy. = denotes the bias error between the real and de-tected equivalence ratios. The power is fixed at =P 7 kW.
Fuel × 103 × 100% Pure CH4 0.952 6 0.6% 0.833 3 0.4% 0.740 6 0.8% 0.666 −7 −1.1% CH /N4 2 0.952 8 0.9% = Xfuel(N )2 10% 0.833 1 0.1% 0.740 5 0.7% 0.666 −9 −1.4% CH /N4 2 0.952 −5 −0.5% = Xfuel(N )2 20% 0.833 −7 −0.8% 0.740 −2 −0.2% 0.666 −13 −1.9% CH /CO4 2 0.952 −17 −1.7% = Xfuel(CO )2 10% 0.833 −15 −1.8% 0.740 −8 −1.1% 0.666 −19 −2.9% CH /CO4 2 0.952 −99 −10.4% = Xfuel(CO )2 50% 0.833 −80 −9.6% 0.740 −63 −8.5% 0.666 −60 −9.0% CH /H4 2 0.941 −15 −1.6% = Xfuel(H )2 20% 0.823 −6 −0.7% 0.731 0 0.0% 0.658 −14 −2.1% CH /C H4 3 8 0.951 32 3.3% = Xfuel(C H )3 8 5% 0.832 19 2.2% 0.739 20 2.8% 0.665 7 1.1%
Fig. 8. Evolution of the OH∗signal measured with a photomultiplier tube over 6 min after a cold start of the burner. Intensity values are normalized by the steady state value. CH4-air mixture.
rates of air, methane and another secondary component (N2, CO2, H2,
C3H8). They are for convenience designated in the following by AIR, F1
(CH4) and F2 (N2, CO2, H2, C3H8) respectively.
Fig. 9shows a simplified chart of the control loop. Each iteration of the loop is a three-step sequence:
•
The first step is used to set the fuel composition according to the required secondary component molar fractionXF2fuelin the fuel blend.The global volumetric fuel flow rate (VF1+VF2) is kept constant in
this process. It mimics the situation of gas composition variations in a real gas boiler. The front panel gives a boolean signal which de-cides whether this step is executed or not. The set values for the flow meters F1 and F2 are calculated from the current value:
= + = + V V V X V V V X ( )(1 ) ( ) F F F F F F F F 1 01 02 fuel2 2 01 02 fuel2
The superscript 0 denotes the initial flow rate given by the mass flow meters. After sending the set values to the mass flow rate controllers, the program is forced to wait two seconds to let the flow controllers to reach their desired values by changing the opening of their integrated valves.
•
In the second step, the equivalence ratio is deduced from the OH∗signalaccording to the procedure described in Section3.2. The air flow rate needed for this calculation is given by the air mass flow meter.
•
The third step, executed when approved by a boolean signal from the front panel of the LabVIEW program, serves to regulate the global fuel flow rate, while keeping the fuel blend compositionconstant. The fuel flow rate is adjusted with the ratio of the detected equivalence ratio detectedto the set value setas:
= = V V V V F F F F 1 01 2 02 set detected set detected
A waiting time of one second is forced after sending the set points to the mass flow controllers.
It is worth mentioning that the control loop does not modify the air flow rate VAIR.
4.2. Control algorithm validation
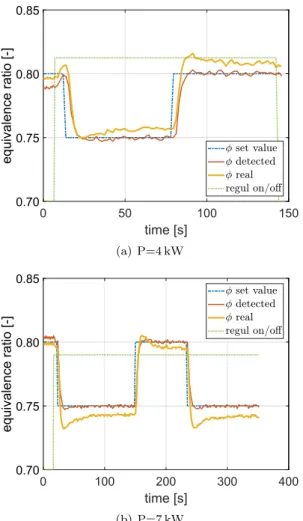
4.2.1. Change of equivalence ratio set value
The performance of the control algorithm is first tested with pure methane by changing the set value of the equivalence ratio setat two
different flame powers =P 4and7 kW. Results are shown inFig. 10. The initial operating point of the burner is set to an equivalence ratio
= 0.80. Automatic fuel flow rate regulation is started at the beginning and corresponds to the green dotted line with arbitrary scale. The set point of the equivalence ratio (blue line) is then switched back and forth between = 0.80 and = 0.75. The real equivalence ratio de-duced from the mass flow meters is represented as a yellow line in Fig. 10and serves as a reference which is not disclosed to the system. This quantity follows the set value inFig. 10, with a small offset of | | 0.01.
4.2.2. Change of fuel composition
Validation proceeds by changing the fuel composition. The fol-lowing scenarios of binary fuel blends are considered. Some of them are chosen in accordance with reference gases used for gas boiler certifi-cation:
•
CH4/N ,2 Xfuel(N )2 =14%(reference gas G25).•
CH4/CO ,2 Xfuel(CO )2 =10%•
CH4/C H ,3 8 Xfuel(C H )3 8 =5%(typical in many natural gases).•
CH4/C H ,3 8 Xfuel(C H )3 8 =13%(reference gas G21).•
CH4/H , X2 fuel(H )2 =23%(reference gas G222).The secondary components are first added to and then removed from the methane injection to test the ability of the control algorithm to regulate the fuel flow rate in both ways.
A first example is given inFig. 11in which the fuel switches be-tween pure methane and the reference gas G222 containing 23 vol.%
Fig. 10. Tests of the control algorithm with methane/air mixtures at two
dif-ferent operating powers by changing the equivalence ratio set value. Automatic fuel flow rate regulation (green dotted line with arbitrary scale) is enabled from the beginning.
Fig. 11. Tests of the control system with fuel switching between pure methane
and a CH4/H2blend withXfuel(H )2 =23%. The signal for automatic fuel flow rate regulation (green dotted line with arbitrary scale) is sent manually after the detected equivalence ratio is stabilized.
H2. Modifications of the fuel composition and automatic regulation are
intentionally separated. The burner operates at = 0.8 at the beginning of the test and the automatic regulation (green dotted line) is disabled. At t 20 s, H2is injected to the fuel while the global fuel flow rate is
kept constant. The real equivalence ratio is automatically affected and drops to 0.66. This drift is also detected by the control algorithm, but with a lag of about 25 s before reaching the correct value. The main contribution to this time lag is the lapse of time required by the burner to reach a stable temperature as discussed in Section3.3. The regulation is then manually turned on at t 50 s. The real equivalence ratio quickly goes back to the set value, despite a slight over-shoot during about 25 s, corresponding again to the time for signal stabilization. When the secondary components are removed from the fuel in the
second part of the test, the automatic regulation also successfully brings the equivalence ratio back to the set value.
Further validation tests are presented with other fuel compositions in Fig. 12. The automatic regulation is permanently enabled during these tests. The control system is found to react correctly to changes of the fuel composition for all cases tested and allows to regulate the equivalence ratio. The difference between the real equivalence ratio with respect to the set value remains generally below| |=0.01as shown by the results inFig. 12a with 14 vol.% N2, inFig. 12b with
10 vol.% CO2and inFig. 12e with 23 vol.% H2. Only C3H8enrichment
causes relatively bigger deviations of | | 0.03 forXfuel(C H )=0.05
3 8
inFig. 12c and | | 0.05 forXfuel(C H )=0.13
3 8 inFig. 12d. The same
differences are also expected forC H2 6enrichment which is not tested
C H3 8
4.2.3. Discussion
The tests made revealed that the control strategy based on sensing the OH∗intensity combined with an information on the air flowrate is
capable of regulating the equivalence ratio of unknown natural gas fuel blends with an excellent precision. The bias error remains below
=
| | 0.01for pure methane and its blends with N2, CO2and H2. Only
C H3 8 enriched fuel mixtures cause relatively larger differences with
| | 0.03 for Xfuel(C H )=0.05
3 8 and | | 0.05 for
= Xfuel(C H ) 0.13
3 8 . These slight differences remain nevertheless
toler-able for the targeted application in a domestic gas boiler.
The control loop developed in this work for a commercial burner used in real gas boilers, differs in some aspects from the work of Docquier et al.[26]conducted on a laboratory conical flame. In their work the equivalence ratio sensing is realized with a lookup table consisting of two intensity ratios OH∗/CH∗andCO
2/CH∗, while in the
present work the OH∗intensity from the photomultiplier tube scaled by
the different air flow rates is preferred to detect the equivalence ratio. This sensing strategy allows the control system to be extended to a wider set of fuel scenarios. Tests with modifications of the equivalence ratio set value from methane/air mixtures and effects of N2dilution
were already carried out by Docquier et al.[26]. The validation is ex-tended here to different flame powers and to a wider set of secondary components including CO2, H2and C H3 8as well. On the other hand, no
special attempt was made in the present work to optimize the PID controller of the different flow regulator devices, which is out of the scope of the present study. Also, the impact of the contamination of light-collecting equipments was not tested. Domestic gas boilers gen-erally don’t suffer from soot pollutions. It is nevertheless reminded that by selecting only one narrow spectral bandwidth relative to OH∗
emission, the control strategy developed in the present work is indeed more vulnerable to signal intensity attenuation due to contamination obscuring the optical path.
Despite the success of the demonstrative control loop developed in this work in a laboratory framework, additional practical issues need to be addressed before envisaging applying this control technique to real gas boilers. For example, the delayed response of the OH∗signal cause
difficulties to handle sudden changes of flame power. A preliminary rough adjustment with other techniques may be necessary before leaving fine regulations to the chemiluminescence-based control loop.
Another issue for an industrial application is that the optical access to the flame region is considerably restricted in a real boiler compared to the experiments made here with a burner taken out of the chamber. In the present laboratory setup, the photomultiplier tube is set perpendicular to the burner axis at a relatively large distance of about50 cmfrom the burner surface. It therefore always safely collects the light emission from half of the small flames anchored on the cylindrical burner facing the sensor, despite variations of flame length with power and equivalence ratio. In a real gas boiler, on the other hand, the distance between the sensor and the flame region is likely to be reduced and the observation angle may largely be restricted by the solid components inside the combustion chamber, espe-cially the heat exchanger set around the burner. In this case, changes of the flame length with power and equivalence ratio have to be considered. Flames may get in and out of the field of view depending on the operating conditions and the fraction of the flame emission collected by the sensor may not remain constant. In addition, as only the OH∗emission intensity is
recorded, these modifications cannot be automatically compensated with a normalization technique using the ratio of two emission intensities. The same problem may arise if the technique is applied to unsteady flames when the flame enters or leaves the view frame covered by the sensor. It would then be important to verify whether monotonic calibration curves as in Fig. 6could still be constructed in a real burner environment.
5. Conclusion
The present work proposes a new equivalence ratio sensing and regulation strategy for a laminar premixed burner used in domestic gas boilers.
Preliminary experiments first allowed to identify a reliable equiva-lence ratio indicator. The commonly used CH∗/OH∗intensity ratio leads
to large errors withC H2 6and C H3 8enriched methane blends, while use
of theC2/CH∗intensity ratio does not cover a sufficiently wide
opera-tional range to safely determine the equivalence ratio. The OH∗signal
has finally been selected because it barely changes with the fuel blend composition and features monotonic changes with 0.67 1.00.
A demonstrative control loop has then been developed with LabVIEW. The equivalence ratio is determined during operation by measuring the OH∗intensity with a photomultiplier tube. An
informa-tion on the air flow rate is also supplied to the control algorithm to account for power modulation. This control strategy has been tested by changing the equivalence ratio set value, the set power and by mod-ifying the fuel composition with different fractions of N2, CO2, H2and
C H3 8mixed with methane. Regulation of the equivalence ratio of
un-known natural gas fuel blends with an excellent precision has been proven for this fuel mixtures. Only C3H8enriched fuel mixtures cause
relatively larger, but tolerable bias errors on the detected equivalence ratio.
This control strategy validated in a laboratory framework on an industrial burner may easily be transferred to real domestic gas boilers as the information required on the air flow rate and OH∗intensity are
both accessible in these systems. Nevertheless, potential difficulties that need be considered include the lag of the OH∗signal response due to
thermal transients and the geometrical restriction of optical access to the flame region in the real system.
Acknowledgments
This work was supported by FUI (Fonds Unique Interministériel) [ZEM-R]. The authors also wish to thank David Charalampous for his help with spectrometry and Yannick Le Teno for the preparation of the experimental setup.
References
[1] M. Pöschl, S. Ward, P. Owende, Evaluation of energy efficiency of various biogas production and utilization pathways, Appl. Energy 87 (11) (2010) 3305–3321. [2] T. Estermann, M. Newborough, M. Sterner, Power-to-gas systems for absorbing
excess solar power in electricity distribution networks, Int. J. Hydrogen Energy 41 (32) (2016) 13950–13959.
[3] S. Lee, S.-M. Kum, C.-E. Lee, An experimental study of a cylindrical multi-hole premixed burner for the development of a condensing gas boiler, Energy 36 (7) (2011) 4150–4157.
[4] S. Lee, S.-M. Kum, C.-E. Lee, Performances of a heat exchanger and pilot boiler for the development of a condensing gas boiler, Energy 36 (7) (2011) 3945–3951. [5] V. Dupont, M. Pourkashanian, A. Williams, R. Woolley, The reduction of NOx
for-mation in natural gas burner flames, Fuel 72 (4) (1993) 497–503.
[6] H.R.N. Jones, The Application of Combustion Principles to Domestic Gas Burner Design, Taylor & Francis, 1989.
[7] N. Docquier, S. Candel, Combustion control and sensors: a review, Prog. Energy Combust. Sci. 28 (2) (2002) 107–150.
[8] G. Tschulena, A. Lahrmann, Sensors applications, Sensors in Household Appliances vol. 5, John Wiley & Sons, 2006.
[9] M. Kiefer, U. Maas, S. Park, X. Pian, G. Köllmann, G.O. Loohuis, D. Leerkes, H. Kalk, D. Markus, T. Langer, Combustion control based on flame ionization, in: 25th World Gas Conference, 04–08 June 2012, Kuala Lumpur, Malaysia.
[10] M. Näslund, Combustion control in domestic gas appliances - fuel gases containing hydrogen, Tech. rep., Danish Gas Technology Centre, 04 2014.
[11] B. Lewis, G. von Elbe, Chapter V - combustion waves in laminar flow, in: B. Lewis, G.V. Elbe (Eds.), Combustion, Flames and Explosions of Gases, Third ed., Academic Press, San Diego, 1987, pp. 215–417.
[12] Y. Ding, D. Durox, N. Darabiha, T. Schuller, Combustion state monitoring of pre-mixed heating appliances with flame ionization current and chemiluminescence, Combust. Sci. Technol.,doi:10.1080/00102202.2018.1472085.
[13] M. Karrer, Diagnostic des plasmas de combustion par sonde d’ionisation: applica-tion à l’étude de l’interacapplica-tion flamme-paroi instaapplica-tionnaire, Ph.D. thesis, Chasseneuil-du-Poitou, Ecole nationale supérieure de mécanique et d’aéronautique,
here. However, these differences still remain tolerable considering that the concentration of in real natural gases remains generally lower than in the tested scenarios.
France, 2009.
[14] J.M. Rodrigues, Analyse de la répartition du potentiel et des charges dans une flamme polarisée. corrélation avec la distance d’extinction, Ph.D. thesis, Université de Rouen, 2005.
[15] V. Nori, J. Seitzman, Chemiluminescence measurements and modeling in syngas, methane and jet-a fueled combustors, in: AIAA-2007-0466, 45th AIAA Aerospace Sciences Meeting and Exhibit, Reno, NV, January, 2007, pp. 8–11.
[16] L. Zimmer, S. Tachibana, T. Yamamoto, Y. Kurosawa, K. Suzuki, Evaluation of chemiluminescence as sensor for lean premixed combustion, in: 4th Symposium on Smart Control of Turbulence, March 2–4, 2003, Tokyo, Japan.
[17] Y. Hardalupas, M. Orain, C.S. Panoutsos, A. Taylor, J. Olofsson, H. Seyfried, M. Richter, J. Hult, M. Aldén, F. Hermann, J. Klingmann, Chemiluminescence sensor for local equivalence ratio of reacting mixtures of fuel and air (FLAMESEEK), Appl. Therm. Eng. 24 (11–12) (2004) 1619–1632.
[18] J. Ballester, T. García-Armingol, Diagnostic techniques for the monitoring and control of practical flames, Prog. Energy Combust. Sci. 36 (4) (2010) 375–411. [19] C. Hu, Y. Gong, Q. Guo, Y. Wang, G. Yu, Experimental study on the spectroscopy of
opposed impinging diesel flames based on a bench-scale gasifier, Energy Fuels 31 (4) (2017) 4469–4478.
[20] C. Hu, Y. Gong, Q. Guo, L. He, G. Yu, Investigations of ch chemiluminescence and blackbody radiation in opposed impinging coal-water slurry flames based on an entrained-flow gasifier, Fuel 211 (2018) 688–696.
[21] J. Kojima, Y. Ikeda, T. Nakajima, Spatially resolved measurement of OH∗, CH∗, and
C2chemiluminescence in the reaction zone of laminar methane/air premixed
flames, Proc. Combust. Inst. 28 (2) (2000) 1757–1764.
[22] B. Higgins, M. McQuay, F. Lacas, J.-C. Rolon, N. Darabiha, S. Candel, Systematic measurements of OH chemiluminescence for fuel-lean, high-pressure, premixed,
laminar flames, Fuel 80 (1) (2001) 67–74.
[23] B. Higgins, M. McQuay, F. Lacas, S. Candel, An experimental study on the effect of pressure and strain rate on CH∗chemiluminescence of premixed fuel-lean methane/ air flames, Fuel 80 (11) (2001) 1583–1591.
[24] Y. Hardalupas, M. Orain, Local measurements of the time-dependent heat release rate and equivalence ratio using chemiluminescent emission from a flame, Combust. Flame 139 (3) (2004) 188–207.
[25] C. Panoutsos, Y. Hardalupas, A. Taylor, Numerical evaluation of equivalence ratio measurement using OH∗and CH∗chemiluminescence in premixed and non-pre-mixed methane-air flames, Combust. Flame 156 (2) (2009) 273–291.
[26] N. Docquier, F. Lacas, S. Candel, Closed-loop equivalence ratio control of premixed combustors using spectrally resolved chemiluminescence measurements, Proc. Combust. Inst. 29 (1) (2002) 139–145.
[27] M. Adelt, M. Hoppe, M. Montero, G. Peureux, Report on gas composition range in Europe DB0.1, Tech. rep., INGAS, 2010.
[28] T. García-Armingol, J. Ballester, A. Smolarz, Chemiluminescence-based sensing of flame stoichiometry: influence of the measurement method, Measurement 46 (9) (2013) 3084–3097.
[29] Y. Ding, Use of flame chemiluminescence and ionization current for the combustion state monitoring of a domestic gas boiler, Ph.D. thesis, Université Paris-Saclay, 2018.
[30] J.-M. Samaniego, F. Egolfopoulos, C. Bowman,CO2chemiluminescence in premixed
flames, Combust. Sci. Technol. 109 (1–6) (1995) 183–203.
[31] S. Schiebahn, T. Grube, M. Robinius, V. Tietze, B. Kumar, D. Stolten, Power to gas: technological overview, systems analysis and economic assessment for a case study in Germany, Int. J. Hydrogen Energy 40 (12) (2015) 4285–4294.