CHEMICAL FRACTIONATIONS IN SOLAR COMPOSITION MATERIAL
by
MELVIN BRUCE FEGLEY, JR.
S.B., MASSACHUSETTS INSTITUTE OF TECHNOLOGY (1975)
SUBMITTED IN PARTIAL FULFILLMENT OF THE REQUIREMENTS OF THE
DEGREE OF
DOCTOR OF PHILOSOPHY IN EARTH AND PLANETARY SCIENCE
at the
MASSACHUSETTS INSTITUTE OF TECHNOLOGY June 1980
QMassachusetts Institute of Technology 1980
Signature of Author 7
Department of Earth and Pl netary Sciences May 5, 1980 Certified by John S. Lewis Thesis Supervisor Accepted by , -,_ Theodore Madden irman, Department Committee
-F
ECH
2
CHEMICAL FRACTIONATIONS IN SOLAR COMPOSITION MATERIAL
by
MELVIN BRUCE FEGLEY, JR.
Submitted to the Department of Earth and Planetary Sciences on April 25, 1980 in partial fulfillment of the
requirements for the Degree of Doctor of Philosophy in Earth and Planetary Science
ABSTRACT
Chemical thermodynamic techniques are used to study three diverse problems in meteoritics and planetary science. The problems are volatile element fractionations in the
solar nebula, barium titanate condensation in the solar nebula, and the thermochemistry of selected trace elements in the
atmosphere of Jupiter.
Chemical equilibrium calculations for the alkalis, halo-gens, and phosphorus are reported for two extreme models of accretion. A comparison of the predicted condensates in the two accretion models with available observations of Na, K, F, Cl, Br and P abundances in the terrestrial planets and with the observed mineralogy of ordinary chondrites indicates that available data are compatible with a close approach to chemi-cal equilibrium in the inner regions of the solar nebula.
The observation of pure BaTiO3 particles in the Allende
meteorite has stimulated the development of a simple and con-sistent model to explain the observations. The suggested model involves nonideality of the BaTiO3-CaTiO3 solid solu-tion. This nonideality permits significant fractionation of Ba from Ca and Sr during condensation, leading to the forma-tion of pure BaTiO03 particles. The quantitative treatment of trace element solid solution formation used in this study provides a firm basis for analogous discussions of trace element fractionations in meteorites or other solar system material.
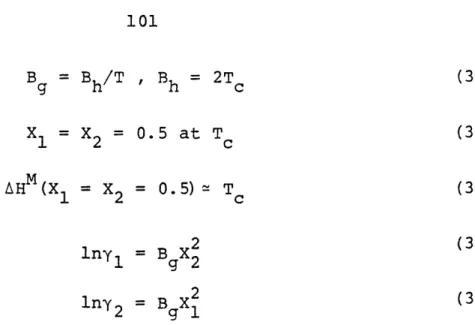
The thermochemistry of several hundred compounds of twelve selected trace elements (Ge, Se, Ga, As, Te, Pb, Sn, Cd, Sb, Tl, In, and Bi) has been investigated in the Jovian atmosphere. The results indicate that AsF3, InBr, TlI and
SbS, in addition to CO, PH3, GeH4, AsH3, H2Se, HC1, HF, and H3B03 proposed by Barshay and Lewis (1978) may be potential chemical tracers of atmospheric dynamics. The reported observation of GeH4 is interpreted on the basis of new cal-culations as implying rapid vertical transport from levels where T > 8000K. Upper limits are also set on the abun-dances of many gaseous compounds of the elements investi-gated.
Thesis Supervisor: Professor John S. Lewis
"Let this book be dedicated to the chemists of the newer generation, who will not wish to reject all inferences from con-jecture or surmise, but who will not care to speculate concerning that which may be surely known. The fascination of a growing science lies in the work of the pioneers at the very borderland of the unknown, but to reach this frontier one must pass over well-traveled roads; of these one of the safest and surest is the broad highway of thermodynamics".
Gilbert Newton Lewis and Merle Randall, Thermodynamics 1923.
TABLE OF CONTENTS Page TITLE PAGE . . . . ABSTRACT ... FRONTISPIECE . . TABLE OF CONTENTS. LIST OF TABLES LIST OF FIGURES PREFACE
PART 1. CHEMICAL FRACTIONATIONS IN THE PRIMITIVE SOLAR NEBULA. CHAPTER I. VOLATILE ELEMENT FRACTIONATIONS
IN THE SOLAR NEBULA: THE ALKALIS, HALOGENS, AND PHOSPHORUS .. . INTRODUCTION. . . . ...
METHOD OF CALCULATION . . . . . . . THE HOMOGENEOUS ACCRETION MODEL . .
SODIUM . . . . . . . . .
PHOSPHORUS . . . . ... HALOGENS . . . . . . . .
POTASSIUM . . . . THE HETEROGENEOUS ACCRETION
MODEL . . . . . . . . .
VOLATILE ELEMENT RETENTION BY THE TERRESTRIAL PLANETS ...
S. 9 10 13 . . 14 35 42 . . . 56
VOLATILE ELEMENT MINERALOGY
OF CHONDRITES . . . . . . . . . .
SUMMARY AND CONCLUSIONS . . . . .
BARIUM TITANATE CONDENSATION
AND ALKALINE EARTH FRACTIONATIONS IN THE SOLAR NEBULA . . . .
INTRODUCTION . . . . . . .
CONDENSATION CALCULATIONS: ASSUMPTIONS AND METHODS CONDENSATION OF TITANIUM AND ZIRCONIUM . . ... CONDENSATION OF ALKALINE EARTH ELEMENTS . . . . . .
TITANATE SOLID SOLUTIONS BaTiO3-CaTiO3 SYSTEM . .
DISCUSSION . . . . . . . 74 74 77 . r 80 85 . . . . . . 88 . . . . 93 ,... 104 PART 2. CHAPTER III.
SUMMARY AND CONCLUSIONS ... CHEMICAL EQUILIBRIA IN PLAUETARY ATMOSPHERES . . . . . . . . . . .
THERMOCHEMISTRY OF SELECTED TRACE ELEMENTS IN JUPITER'S ATMOSPHERE INTRODUCTION. . . . . ...
EQUILIBRIUM CALCULATIONS:
METHODS AND ASSUMPTIONS . ... RESULTS . . . .. .... GERMANIUM . . . . SELENIUM . . . . . . . . . GALLIUM . . . . CHAPTER II. Page 111 114 115 115 117 120 120 121 125 . . * *
ARSENIC . . . TELLURIUM . . LEAD. . TIN. . . . . . CADMIUM . . . ANTIMONY . . . . . . . . .
THALLIUM AND INDIUM . . .
BISMUTH . . . . . . . .
SUMMARY AND CONCLUSIONS . . . . ACKNOWLEDGEMENTS . . . . . ... APPENDIX I. ADDITIONAL COMPOUNDS WHICH
WERE STUDIED . . . . . . .
APPENDIX II. THERMODYNAMIC DATA SOURCES FOR CHAPTER II . . . . . .
APPENDIX
III-1.
APPENDIX 111-2.
ADDITIONAL COMPOUNDS WHICH ARE NOT GRAPHED. . . . . . .
THERMODYNAMIC DATA SOURCES FOR CHAPTER III. . . . . . .
REFERENCES . . . . . . . . . Page 125 128 129 129 129 134 134 134 141 144 146 . . . . . 148 150 151 152 . . a 0 *
LIST OF TABLES
Page
ABUNDANCES OF THE ELEMENTS. . . .... THE HOMOGENEOUS ACCRETION MODEL: CHEMICAL REACTIONS ALONG THE
NEBULAR ADIABAT . . . . . . . . .
THE HETEROGENEOUS ACCRETION MODEL: CHEMICAL REACTIONS ALONG THE
NEBULAR ADIABAT . . . . . . .... TERRESTRIAL/CHONDRITIC ELEMENTAL ABUNDANCE RATIOS. . . . . . . . .
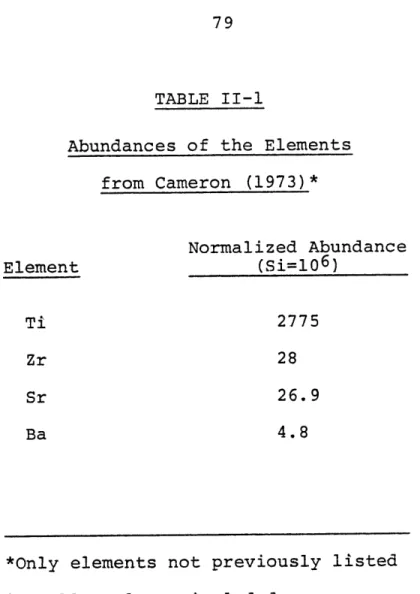
ABUNDANCES OF THE ELEMENTS . . .
MINERAL CONDENSATION TEMPERATURES TWO PHASE DATA FOR BaTiO -CaTiO3
SOLUTIONS . . . . . ... BaTiO3 ACTIVITY COEFFICIENTS . .
4t • • Q
9 • •
III-1: ASSUMED ELEMENTAL ABUNDANCES . . I-1: I-2: I-3: 19 30 54 I-4: II-1: II-2: 11-3: 11-4: 61 79 81 102 105 119 . . 9 .
LIST OF FIGURES
Page STABILITY LIMITS OF CONDENSATES . . .
SODIUM CHEMISTRY ALONG NEBULAR ADIABAT PHOSPHORUS CHEMISTRY ALONG NEBULAR ADIABAT . . . . HALOGEN CHEMISTRY ALONG NEBULAR
ADIABAT. . . . . . . . POTASSIUM CHEMISTRY ALONG NEBULAR ADIABAT .. .... ... CONDENSATION TEMPERATURES FOR ZrO2 AND ALKALINE EARTH TITANATES . . . . . . .
TITANATE SOLID SOLUTIONS . . . . . . .
BaTiO3-CaTiO3 PHASE DIAGRAM . . . . .
BaTiO3 CONDENSATION TEMPERATURES . .
III-1: GERMANIUM CHEMISTRY ALONG THE JOVIAN ADIABAT . . . . . . . . . . . . . .
III-2: ARSENIC AND GALLIUM CHEMISTRY ALONG THE JOVIAN ADIABAT . . . . . . . . . .
111-3: LEAD AND CADMIUM CHEMISTRY ALONG THE JOVIAN ADIABAT . . . . . . . . . . . .
111-4: TIN, INDIUM, AND TELLURIUM CHEMISTRY ALONG THE JOVIAN ADIABAT . . . . . . . 111-5. THALLIUM AND ANTIMONY CHEMISTRY ALONG
THE JOVIAN ADIABAT . . . . . . . . . .
111-6: BISMUTH AND SELENIUM CHEMISTRY ALONG THE JOVIAN ADIABAT . . . . . . . . . .
111-7: HYDROGEN SELENIDE PHOTOLYSIS . . . . . I-i: I-2: 1-3: I-4: 1-5: II-1: II-2: II-3: II-4: S . . 26 29 37 44 51 91 110 123 127 131 133 . . . 136 138 140 0 . 0
PREFACE
Many workers including Grossman, Larimer, Lewis, Lord, Ringwood, Urey, and Wood among others, have used chemical thermodynamic calculations to explain (more or less successfully) a wide variety of chemical fraction-ations in cool stellar atmospheres, meteorites, and the primitive solar nebula. This large body of work, which has been most recently reviewed by Barshay and Lewis (1976) and by Grossman and Larimer (1974), has influenced our concepts of the origin of the solar system.
The principles of chemical thermodynamics have also been applied to many diverse problems in planetary science. Urey (1952) suggested the concept of chemical equilibrium between the lithosphere and atmosphere of a hot planet. This suggestion was later developed by Mueller (1963, 1964, 1965) who presented a strong case for a model in which the temperature, pressure and composition at the surface of Venus determines the composition of its atmosphere. Lewis
later inverted Mueller's model and has used the concept of chemical equilibrium in an atmosphere-lithosphere system plus data on the composition of the atmosphere of Venus to place limits on the temperature, pressure, composition and oxidation state of the surface (Lewis, 1970; Lewis and
Kreimendahl, 1980).
Thermodynamic techniques developed to study the stability and abundance of cloud-forming condensates in the Cytherean atmosphere have been applied by Lewis (1969a) and by Weidenschilling and Lewis (1973) to a study of
cloud-forming condensates in the atmospheres of the outer planets Jupiter, Saturn, Uranus, and Neptune. Furthermore, Lewis
(19.69b), Barshay and Lewis (1978), and Fegley and Lewis (1979) have used the assumption of chemical equilibrium in the lower Jovian atmosphere and the assumption of an adiabatic solar composition atmosphere to predict observable spectro-scopically active species and possible chemical tracers of atmospheric dynamics,
The diversity of problems in meteoritics and in planetary science to which chemical thermodynamics can be applied is illustrated in more detail by the three projects described in this thesis. Part 1 of the thesis, which deals with chemical fractionations in the primitive solar nebula, is composed of two chapters. The first chapter, which is based on results presented by Fegley (1979a,b,c) and Fegley and Lewis (19801, describes an investigation of the equilibrium chemistry of the alkalis, halogens, and phosphorus in a solar composition system. The results of this investigation are then used to discuss volatile element retention by the
12
terrestrial planets and certain features of chondrite
mineralogy. The second chapter, which is based on work by Fegley (1980a,b), describes an investigation of barium
titanate (BaTiO3) formation and alkaline earth fractionation
in the primitive solar nebula. The results of this work are used to explain the observation of BaTiO3 particulates
in the Allende meteorite. Part 2 of the thesis, which deals with chemical equilibria in planetary atmospheres, contains one chapter. This chapter is a study of the thermochemistry of selected trace elements in the Jovian atmosphere and is based on work presented by Fegley (1978) and Fegley and Lewis (1979). The results of this work are used to predict possible chemical tracers of atmospheric dynamics on Jupiter and Saturn.
All three problems, which are currently of great interest in meteoritics and planetary science, can be studied using the well established techniques of chemical thermodynamics. It is the author's intent to illustrate the great versatility of these techniques for research in meteoritics and planetary science by describing three such diverse problems.
PART 1
CHEMICAL FRACTIONATIONS IN THE PRIMITIVE SOLAR NEBULA
CHAPTER I: VOLATILE ELEMENT FRACTIONATIONS IN THE SOLAR NEBULA: THE ALKALIS, HALOGENS, AND PHOSPHORUS.
INTRODUCTION
One of the most intriguing and perplexing problems in planetary science is the method of retention of volatile elements by the terrestrial planets. The retention of volatiles bears upon the origin of the atmospheres of the
terrestrial planets, the origin of the Earth's oceans, the oxidation state of the terrestrial planets and the volatile
content of the interiors of the terrestrial planets, a factor which influences local melting and volcanism.
Previous work on the thermodynamics of volatile element retention by the terrestrial planets includes that of Lewis
(1972) who briefly addressed water retention and that of Lewis et al. (1979) who calculated carbon inventories for the terrestrial planets. In the present study the results of an extensive set of equilibrium calculations for the alkalis, halogens, and phosphorus are described.
The objectives of this study are threefold. The first objective is to describe the equilibrium chemistry of the elements Na, K, F, Cl, Br, and P in a solar composition system over a wide range of temperatures and pressures.
The results of the calculations are presented in some detail because the equilibrium chemistry of the elements studied has been either totally neglected or only cursorily examined by previous workers. No results are presented
for Li, Rb, Cs, and I because there are insufficient thermo-dynamic data for many potentially important gases and con-densates of these elements. Some limited information on the equilibrium chemistry of lithium in a solar composition
system may however be found in Wai and Wasson (1977). The second objective is to use the results of the equilibrium calculations to discuss volatile element re-tention by the terrestrial planets. To this end the results of two extreme models of accretion - the strict homogeneous and strict heterogeneous accretion models - are compared with observational data on abundances of the elements studied. The discussion of the two endmember accretion models is based on the concept of a turbulent, chemically homogeneous
solar nebula. However, recent work by Cameron (1978) suggests that the nebula may have broken up into a collec-tion of giant gaseous protoplanets, especially at great distances from the Sun. Although the chemical consequences
of terrestrial planet formation inside giant gaseous proto-planets may be very different from the consequences of
16
the complex evolutionary histories proposed for the giant gaseous protoplanets make the chemical consequences of
protoplanet formation highly model dependent, and thus
difficult to quantify. The present discussion will therefore be restricted to a comparison of the two extreme accretion models for terrestrial planet formation in the solar nebula.
The third and final objective is to provide a firm basis for further discussion of the chemistry of the
volatile elements studied. The present results can be used to discuss certain features of chondrite mineralogy (Fegley, 1979a,b,c) and can be integrated into a more quantitative condensation-accretion model in preparation (Barshay and Lewis, 1979).
METHOD OF CALCULATION
Chemical equilibrium calculations were done from 10-7 -7 -5 -4 -3 to 10 bars pressure at pressures of 10 , 10 , 10 , 10 3
10-1 , and 10 bars as well as along an adiabatic temperature-pressure profile in the primitive solar nebula (PSN). The temperature range covered was 21000-3000 K.
An adiabatic temperature-pressure profile for the primitive solar nebula was constructed stepwise using the relationship
( (T/T C/R
17
where P is the total pressure, T the temperature, Cp the bulk heat capacity at temperature T, and R the ideal gas constant. The starting point for the adiabat (Po0 T ) was
-4
chosen as 10- 4 bar, 6000K, consistent with available com-positional data on planets and satellites and Cameron's nebular models (Lewis, 1974, and references therein).
The heat capacity data for hydrogen and helium at various temperatures were obtained from the Handbook of
Chemistry and Physics (1961), and a solar abundance ratio (Cameron, 1973) of H2 to He (0.122 He + 0.878 H2) was
assumed. The heat capacities of the other gases, which account for less than 1 mole %, were ignored.
The calculated nebular adiabat is shown in Figure I-1. The horizontal scales in Figures I-3 and I-4 display numerically the relationships between temperature and
pressure and temperature and heliocentric distance along the adiabat. The distance scale was calculated using the relationship
(T/To = (R/Ro) , C2
where T is the temperature and R is the heliocentric distance in astronomical units (A.U.). The starting point for the distance scale (To, Ro was chosen as 6000K, 1A.U. Both the
distance in the nebula, and the (T-o' Ro ) point are con-sistent with the arguments of Lewis (1974).
The assumed solar elemental abundances used in the calculations, which are listed in Table I-1, were taken from Cameron (1973). The equilibrium stability fields and abundances of some silicate minerals and iron metal along the nebular adiabat were taken from Barshay and Lewis
(1979), with some recalculations to adjust for changes in the thermodynamic data for iron oxides, iron-bearing
silicates, and alkali aluminosilicates. Thermodynamic
data were taken from the JANAF Tables and- subsequent supple-ments (Stull and Prophet, 1971; Chase et al., 1974; Chase
et al., 1975; Chase et al., 19781, the Geological Survey thermodynamic tables (Robie et al., 1978: Robie and
Waldbaum, 1968), the National Bureau of Standards compilations (Parker et al., 1971; Wagman et al., 1968; Wagman et al., 1969; Wagman et al., 1976), and a variety of other sources
(Duff, 1972a, 1972b; Gottschal, 1958; Jacques, 1963;
Komarek, 1963; Letoffe et al., 1974; Letoffe et al., 1976; Mills, 1974; Oetting and McDonald, 1963; Orville, 1972;
Richardson and Jeffes, 1949; Saxena, 1973; Seck, 1971; Weibke and Schrag, 1941; and Wellman, 1969). In several cases the tabulated equilibrium constants were incorrect
TABLE I-i
Abundances of the Elements from Cameron (1973)
Normalized Abundance (Si=106) Element H He 0 C N Mg Si Fe S Al Ca Na P Cl K F 31.8 x 2.21 x 21.5 x 11.8 x 3.74 x 1.06 x 1.00 x 0.83 x 0.50 x 85 x 72 x 60 x 9600 5700 4200 2450 13.5 Br 10 10 106 106 106 106 106 106 106 103 103 103
20
and had to be recalculated. For example, the tabulated log Kf data for many phosphorus compounds in Robie and
Waldbaum (1968) and Robie et al. (1978) are in error because the AHO values are based upon a white phosphorus
re-f,298
ference state while the log Kf values are calculated using the Gibbs energy functions [(GO-H298)/T] for red phosphorus.
When the log Kf values are recalculated using a consistent red phosphorus reference state the differences in log Kf are found to be on the order of 3-4 (differences in Kf of a
factor of 103 to 10 4). (Two separate printings of Robie et al. (1978) USGS Bulletin 1452 are now available. The first printing is the one used in this work. The second printing, which became available only after this work was completed, contains revised tables for phosphorus-bearing compounds as well as for several aluminosilicates. It is important to note that the hydroxyapatite table in the second printing is still incorrect.)
It was also necessary in several cases to calculate from the literature data the equilibrium constant for formation of an element or compound from the constituent elements in their designated reference states. If at all possible this calcula-tion was done by a third law method and double checked using data from a separate source. In some cases a second law method, which is less accurate, was used.
calculate log Kf values for chlorapatite and bromapatite is also necessary. Both AH, (Gottschal, 1958) and
f,298298
AGO298 (Duff, 1972b) values for chlorapatite are available.
However, the combination of the data yields a SO98 value
for chlorapatite which is too low relative to the S298 values for fluor- and hydroxyapatite. Since the AHf,2 9 8 values
measured by Gottschal (1958) for fluorapatite and hydroxy-apatite agree within 1% with other experimental and tabulated values (Jacques, 1963; Parker et al., 1971), his AHO
f,298 value for chlorapatite has been combined with an estimated
So98 value to calculate log Kf values by the second law method. Only a AGO,298 value (Duff, 1972a) for bromapatite
is available and it was again necessary to estimate a So98 value in order to calculate log Kf values. In both cases the
entropy estimates were made by three separate methods which yielded results that agree within 1%. The subsequent uncer-tainty in the log Kf values is probably less than that due to the experimental error in the AHf,298 and AGO,298 determina-tions. Discussion of entropy estimation methods can be found in Stull and Prophet (1967) and Kubaschewski et al. (1967).
The basic computational method used will only be briefly summarized here because similar methods have been described in detail by Barshay and Lewis (1978), Grossman (1972), and Larimer and Bartholomay (1979). The thermo-dynamic calculations along the nebular adiabat involve the
of all compounds (gases and condensed phases) included in the data set. A mass balance expression, which equates the total abundance (solar abundance) of an element to the sum of the abundances of all compounds containing the element,
is written for each element in the data set. All compounds for which reliable thermodynamic data are-available are in-cluded. The abundance of each compound in the mass balance equation is multiplied by the appropriate stoichiometric coefficient, which is the number of atoms of element in the compound. For example, the mass balance equation for Na is written
ANa(Total) = ANa(g) + ANaCI(g) + 2ANa2SiO3 (ss)
+ ANaAlSiO 4(c +.9 (3)
where the Ai terms are abundances expressed in some consistent
units, the label (g) indicates a gas, the label (ss) indi-cates a solid solution, and the label (c) indiindi-cates a pure crystalline phase. The system of mass balance equations is
then solved by an iterative technique. A solution is obtained when for each element E
(EE - A E)/E < 1 0 - 5 (4)
23
Cameron (1973) and AE is the total elemental abundance from
equation (3).
More than 200 gases and condensates were included in the calculations for this study. Gases were included in Figures I-2 to I-5 if their equilibrium mole fraction along
-15
the nebular adiabat was greater than 10 at any temperature within the range covered by the figure. The abundances and
stability fields of condensates stable at equilibrium are also indicated in the figures. Pure condensed phases, e.g., Fe3P, are stable when their thermodynamic activities equal 1 and are unstable at activities less than 1. Condensed
phases which form solid solutions, such as the alkali feldspars, are stable at activities less than 1. Conden-sates which were found to be either unstable or unimportant within the temperature range of a figure and gases which did not satisfy the above stated criterion are listed in
Appendix I.
THE HOMOGENEOUS ACCRETION MODEL
The homogeneous accretion model assumes intimate contact between the condensed and gaseous phases, thereby allowing complete chemical equilibrium between all gases and condensates. The chemical composition of the system is a thermodynamic state function and is path independent.
Assuming that chemical equilibrium is attained and that the system has solar composition, the results presented in Figures I-1 to I-5 and Table I-2 therefore apply to con-densation from a hot totally vaporized mixture, volatiliza-tion of a homogeneous cold gas and dust mixture, or any
intermediate case.
Figure I-1 shows the condensation and formation curves for condensates of the elements Na, K, F, C1, Br
and P, the condensation and reaction curves from Barshay and Lewis (1976) for some compounds of the major elements, the adiabatic pressure-temperature profile for the primitive solar nebula, and a qualitative representation of the formation zones for the terrestrial planets.
Several important points are demonstrated by Figure I-1. First, the sequence of reactions and the composition of condensed phases present at equilibrium are generally pressure independent. Second, the volatile contents (Na, K, F, Cl, Br, and P) of the terrestrial planets and
asteroids are in principle predictable by use of this
simplified chemical equilibrium model. Third, the corres-pondence between the phases present at equilibrium and the observed mineralogy of ordinary chondrites reinforces the plausibility of a close approach to chemical equilibrium in the primitive solar nebula.
25
FIGURE I-1: Stability limits of condensates at chemical eauilibrium in a solar composition system from 0
-7
to 21000K and 10 to 10 bars total pressure. The CaTiO3 condensation
curve, which represents the conden-sation limits of several refractory oxides, the Fe condensation curve, the MgSiO3 condensation curve, and the
tremolite [Ca2Mg5[Si802 2] (OH)2]
con-densation curve are from Barshay and Lewis (1976). An adiabatic pressure-temperature profile in the solar nebula and qualitative formation zones for the terrestrial planets are also shown. The astrological symbols from top to bottom along the adiabat represent Mercury, Venus, Earth, and Mars, respectively.
2000
1500
0.
1000
500
Or I I I-7
-6
-5
-4
log
0Toto I
-3
-2
Pressure (bars)
0 +1Table I-2 and Figures I-2 to I-5 provide informa-tion on the equilibrium chemistry of Na, K, F, Cl, Br and P along the nebular adiabat. The results of the calcula-tions are discussed element by element in order of decreas-ing abundance. Compounds which do not appear in the
figures due to extremely low abundances or activities less than 1 are listed in Appendix I.
Sodium
Figure I-2 illustrates the equilibrium abundances and stability fields of sodium-bearing compounds along the nebular adiabat. The abundances at equilibrium of both gaseous and condensed sodium-bearing compounds are shown in the figure. Half of all sodium is condensed in plagioclase
feldspar (NaAlSi308 - CaAl2Si208) by 948 0K, and condensa-tion is quantitative at about 8580K. Thermodynamic data for analbite (Robie et al., 1978) and activity coefficient data for plagioclase feldspar (Orville, 1972: Saxena, 19731 were used in the calculations. The 50% condensation curve for
NaAlSi308 in plagioclase feldspar is shown in Figure I-1. Sodium silicate (Na2SiO3) dissolved in enstatite (MgSiO3)
as an ideal solution never exceeds 1% of total sodium. The albite abundance is reduced by the formation of sodalite
(Na4Al3Si301 2C11 at about 8950K and later by nepheline
FIGURE 1-2: Equilibrium abundances and stability fields of sodium-bearing gases and condensates along the nebular adiabat.
The temperature scale is linear in l/T. The mole fraction X, of a species i is defined as its partial pressure Pi divided
by the total pressure P. The heavy lines
indicate the stability fields of the four condensates whose abundances are also shown graphically. The abbreviations (c) and (ss) following the condensate
for-mulas indicate a pure crystalline solid and a solid solution, respectively. The fraction of total sodium in each compound is also
29 I04 / Temperature
-8
-12
-14
500
600
800
0 o 0--O3 0 -c° 31000 1200/I 1500
2000
1000 1200 1500 2000
Temperature (OK)
(oK)
c o -_ 0 o 2 O 0TABLE I-2
The Homogeneous Accretion Model:
Chemical Reactions Along the Nebular Adiabat
T(OK) Reaction
1520 Condensation of Fe-Ni alloy (Taenite) 1455 Condensation of MgSi03 (Enstatite) 1225 Condensation of Fe3P (Schreibersite) 950-1050 50% condensation of (Na,K)AlSi308 in Plagioclase Feldspar 895 Formation of Na4 (A1SiO4) 3C1 (Sodalite) 766 Formation of Ca (PO4)3 F (FluorapatiteT 714 Formation of Ca3 (PO4)2 (Whitlockite)
687 Fe-Ni alloy + H2S (g) = (Fe,Ni)S (Troilite)
480 Calcium silicates + H20 (g) =
Tremolite
-460 Whitlockite reacts to form Ca5 (PO 4)30H
(Hydroxyapatite)
,350 Formation of Ca5 (P O 4 )3Br
and nepheline stability fields all extend below 5000K. The high temperature limits of the sodium silicate and albite stability fields correspond to the appearances of enstatite and anorthite (CaAl2Si208), respectively. The
low temperature limit to the Na2SiO3 stability field
coin-cides with the disappearance of enstatite at about 5110K. The present NaA1Si308 condensation results can
be compared with other results from the cosmochemical -3
literature. Grossman (1972) reports that at 10 atmos-pheres plagioclase contains 2 mole % NaAlSi308 (high albite)
by 12000K and he estimates that pure alkali feldspars are
stable by 10000K. Later work by Lattimer and Grossman (1978) refines this estimate and indicates that NaAlSi308
(pre-sumably high albite) becomes stable at 10280K at 10-3
atmospheres pressure. In comparison, the present work in-dicates that analbite becomes stable at 9920K along the
primitive solar nebula (PSN) adiabat if analbite solid solu-tion in anorthite is neglected. The small difference
between the two sets of results is probably due to the
pressure difference (at -10000K the PSN adiabat pressure is about 6 x 10- 4
barsl and to differences in the NaAlSi308 thermodynamic data used in the two investigations.
A comparison of NaAlSi308 50% condensation tem-peratures from Wai and Wasson (1977) and from the present
work also shows only small differences between the results. Wai and Wasson (19771 report NaAlSi308 (presumably high
albite) 50% condensation temperatures of 8740K and 982 0K at
10-6 atmospheres and 10- 4 atmospheres pressure, respectively.
The analbite 50% condensation temperatures from Figure I-1 are 8610K and 970 0K at 10- 6 bars and 10- 4 bars pressure, respectively. Again the small differences between the two
sets of results are probably due to the differences in the NaASi308 and CaAl2Si208 thermodynamic data used in the two
investigations. The possible neglect of NaCl(g), which is the second most abundant sodium-bearing gas, by Wai and Wasson (1977) may also be a factor contributing to the
observed differences between results. It is therefore con-cluded that the present NaAlSi308 condensation results are
in good agreement with results from previous investigations. No previous nepheline and sodalite condensation results have been reported and thus no comparison is possible.
As previously noted, NaAlSi308 condenses at 9920K along the PSN adiabat if solid solution in anorthite is neglected. Furthermore, NaAlSiO4 condenses at 9800K,
neglecting the prior effect of NaAlSi30 condensation. These calculations were done using analbite and nepheline thermodynamic data from Robie et al. (1978). What is the
effect (if any) of the tabulated uncertainties in the analbite and nepheline thermodynamic data upon the con-densation temperatures of the two phases?
Using the least positive analbite log Kf values
permitted by the uncertainty in the data yields an analbite condensation temperature of 9760K along the PSN adiabat. Using the most positive nepheline log Kf values permitted by the uncertainty in the data yields a nepheline
conden-sation temperature of 9870K along the PSN adiabat. The analbite-nepheline condensation order is now reversed, and once nepheline forms, pure analbite is not stable.
The uncertainties in the alkali aluminosilicate thermo-dynamic data which are responsible for the changes in the analbite and nepheline condensation temperatures are
extremely small on both an absolute and a relative basis.
The uncertainties (+} in the analbite and nepheline AGo values -1
are <1 kcal mole for AGO values which are on the order of
3 -f
103 kcal mole- I (approximately a 0.1% uncertaintyY. On a
percentage basis, the uncertainty in the AGO data for H20 Cliquid), which are some of the most accurate
thermo-dynamic data available, is barely a factor of 5 better (an uncertainty of -0.02%1!
Factors such as the physical state of the sample and experimental difficulties in the measurement of enthalpy and
heat capacity values, which are responsible for the un-certainty in the analbite and nepheline thermodynamic data, are reviewed in detail elsewhere (Helgeson et al., 1978; Kubaschewski et al., 1967) and will not be discussed here. Suffice it to say that it will be difficult to
reduce the small uncertainty in the present data. Thus, on the basis of available thermodynamic data alone it is
impossible to unambiguously identify the first sodium-bear-ing condensate. In fact the nature of this condensate may be critically dependent upon local nebular conditions such as slight departures from strict chemical equilibrium. This point will be discussed further in the section on chondrite mineralogy.
The sodalite condensation temperature, however, is relatively insensitive to large uncertainties in the
sodalite thermodynamic data. Sodalite condenses at 9530K along the PSN adiabat (neglecting prior condensation of other
alkali-bearing phases). This calculation is based on sodalite thermodynamic data calculated from the vapor
pressure measurements of Wellman (1969). The uncertainties in Wellman's NaCl(g) vapor pressure measurements produce an insignificant + 20K change in the sodalite condensation temperature. Furthermore, a thousand-fold increase or
35
a + 450K change in the sodalite condensation temperature. Therefore, the present sodalite condensation temperature is regarded as a reasonably certain value that will not be
significantly changed when more accurate sodalite thermo-dynamic data become available.
Phosphorus
The abundances and stability fields of phosphorus-bearing compounds under equilibrium conditions along the nebular adiabat are shown in Figure 1-3. The first
phosphorus-bearing condensate is schreibersite (Fe3P) which
appears at about 12250 K. Phosphorus is 50% condensed at about 11690K and is completely condensed by 10530K. Fluor-apatite JCa5(PO4)3F] is formed from Fe3P at 7660K and the
remaining schreibersite reacts to form whitlockite
[Ca3 (PO4)2] at 7140K. The whitlockite and fluorapatite stability fields extend below 5000K. Hydroxyapatite forma-tion as a pure phase and as an ideal solid soluforma-tion in
fluroaoatite has also been considered. In the former case hydroxyapatite formation depletes the remaining whitlockite at about 4600K, while in the latter case all whitlockite is converted to hydroxyapatite at about 507 0K.
Figures I-1 illustrates the schreibersite,
fluor-apatite, whitlockite, and hydroxyapatite condensation curves from 10- 7 to 10 bars pressure. The whitlockite condensation
FIGURE I-3: Abundances and stability fields of phosphorus-bearing compounds along the nebular adiabat under equi-librium conditions. The scale across the top shows the radial distance in astronomical units (AU) from the center of the primitive solar nebula. The heavy lines indicate the stability
fields of the four condensates whose abundances are also shown graphically.
Phosphorus is 50% condensed at about 11690 K and is completely condensed
by about 10530K. The high temperature limit of the phosphorus-iron solution corresponds to the iron condensation point.
Radial
Distance (AU)
I.I
1.05 1.0
0.5
0.4
I I
I
W I
I
I
I
C P04)2(C- Fe3 P(C)-1 Ca5(PO4)3F (C)- 1 P (SS) o Co 5(PO4)3F (C) N- 0-
- ca 3(P 4)(C) -" -2 _ 0 *- H2 P2 0 a -- 4U-I
0 00
M
P(SS)
_ -4P
CPI 0-8
P2 -.-N500
600
800
1000 1200 1500 2000
Temperature (OK)
curve is pressure-independent in the regions of P-T space where CO and CH4 are the dominant carbon-bearing gases, and
has an inflection at the CO/CH4 watershed where the
abun-dances of these two gases are equal. The hydroxyapatite condensation curve in Figure I-1 is for condensation of pure hydroxyapatite.
Several other authors (Grossman and Olsen, 1974; Wai and Wasson, 1977; and Sears, 1978) have calculated
schreibersite condensation temperatures, and the present results can be compared with theirs. The Fe3P condensa-tion temperatures from Figure I-1 are 1000-3000 lower than the literature values, and the largest discrepancies are
-3
with the values of Sears (1978). For example, at 10 bars pressure the Fe3P condensation temperatures calculated by Sears (1978), Grossman and Olsen (1974), and Wai and Wasson
(1977) are 14790K, 14160K and 14160K, respectively, while
the value from the present work is 12100 K.
Although Grossman and Olsen (1974), Wai and Wasson (1977), and Sears (1978) cite different sources for their
Fe3P thermodynamic data, all the sources cited ultimately
derived the same (estimated) data from an evaluation by Richardson and Jeffes (1949) of the Fe3P enthalpy deter-minations of Weibke and Schrag (1941). However, the data
Fe3P are out of date and disagree with currently re-commended values. For example, for the change in state
P4Cg) = 2P 2 (g) 298.150K
Richardson and Jeffes use the enthalpy value of +32,076 cal mole while the JANAF value is +54,590 cal mole- . The
CODATA enthalpy value for this change in state is +54,756 cal mole- , in good agreement with the JANAF value (CODATA Task Group, 1977).
Therefore, the Fe3P enthalpy data have been
re-evaluated by the same method used by Richardson and Jeffes (1949) but using revised values for the auxiliary thermo-dynamic data required. This recalculation of Fe3P log Kf values insures consistency since the same auxiliary data
are used to calculate log Kf values for all phosphorus com-pounds in the data set. It is gratifying to note that an independent estimate of the thermodynamic properties of
Fe3P by Spencer and Kubaschewski (1978) yields log Kf values
in excellent agreement with the values calculated in this way.
In addition, Sears (19781 reports that P2 (g) is the
dominant phosphorus gas in the temperature range where Fe3P condensation is occuring and that the alloying effect
of Ni3P raises the Fe3P condensation temperature
assertion and show instead that the P2(g) abundance never
exceeds 5% of the total phosphorus abundance over the range -7
3000-2000 0K and 10-7-10 bars and that consideration of (Fe,Ni)3P solid solution only increases the phosphide con-densation temperature by "20K. This AT is comparable to the 30 - 50K increase in the Fe condensation temperature due to Ni solid solution (Grossman, 1972; Wai and Wasson, 1977).
It is also important to note that the phosphide con-densation temperatures of the previous investigators can be reproduced by using the appropriate log Kf values and phosphorus fugacities. For example, the results of Grossman
and Olsen (1974) and Wai and Wasson (1977) can be dupli-cated by using the Richardson and Jeffes log Kf data for Fe3P and calculated phosphorus fugacities from the
present work. Also the results of Sears (1978) can be re-produced by assuming P2 (g) to be the dominant phosphorus
gas and by using the Richardson and Jeffes log Kf values without considering Ni3P solid solution.
Although ideal solution of phosphorus in iron has been assumed in the results in Figure 1-3, the effect of nonideality in the P-Fe alloy upon the Fe3P condensation temperature has also been considered. Assuming that all
phosphorus is originally dissolved in the iron metal, and
-5
taking an activity coefficient of 10-5 for the P-Fe alloy, then Fe3P condensation along the nebular adiabat is lowered by only 700. It is therefore justifiable to ignore the effects of nonideality in the P-Fe alloy which are probably
less than the effects of the uncertainty in the Fe3P thermo-dynamic data.
Finally, the present whitlockite condensation tem-peratures have been compared with some literature values
(Wai and Wasson, 1977; Sears, 1978). Wai and Wasson (1977) state that whitlockite is a stable phase below 9000K at 10-4 atmospheres pressure and Sears (1978) reports a whitlockite condensation temperature of 7700 K. The present value is 7140 K. The minor discrepancies appear to be due to
differences in the thermodynamic data. Wai and Wasson (1977). and Sears (1978) used the whitlockite thermodynamic data from Robie and Waldbaum (19681 which are incorrect due to
incon-sistent phosphorus reference states used in compiling the tables. Data for several phosphorus-bearing compounds in the recent compilation of Robie et al. (1978) are also in-correct for the same reason. Where necessary the log Kf values for phosphorus-bearing compounds which are included
42
Halogens
The equilibrium behavior of chlorine-, fluorine-, and bromine-bearing compounds along the nebular adiabat is shown in Figure I-4 and the stability fields for the pure phases sodalite, fluorapatite, and bromapatite are illus-trated in Figure I-1. Sodalite (Na4Al3Si301 2Cl)
conden-sation starts at about 8950K and fluorapatite [Ca5 (PO4)3F]
condensation begins at 7660K. Chlorine is 50% condensed at 8730 and completely condensed at 8230K. Fluorine con-densation is complete by 7410K. No bromine-bearing con-densate is stable above 5000K. Bromapatite [Ca5 (PO4)3Br]
condensation as a pure phase occurs around 3500K, and con-densation as an ideal solid solution in fluorapatite is
complete at about 4340 K. However, the bromapatite con-densation calculations are based on low-quality thermo-dynamic data and may involve a considerable uncertainty.
Thermodynamic data are lacking for the fluorine and bromine analogs of sodalite and it is conceivable that these phases could condense at higher temperatures than fluorapatite and bromapatite. The thermodynamic activity
-6
of chlorapatite [Ca5 (PO4)3C1] does not exceed 10 over the
temperature range considered and chlorapatite solid solution in fluorapatite is of negligible importance for chlorine
FIGURE I-4: Abundances and stability fields of chlorine-, fluorine-, and bromine-bearing compounds along the nebular adiabat under equilibrium conditions. The scale across the top shows the approximate total pressure in millibars along the adiabat. The heavy lines indicate the stability fields of the condensates. The abundances of the condensates are also illustrated.
Chlorine is 50% condensed at about 8730K and is completely condensed at 8230K. Fluorine is completely condensed at about 7410 K. Bromine condensation as Ca5(P04)3Br does not begin until
Total Pressure
0.1
(Millibars)
05
I
2
5
C 0 U IL.5
Q 0 0 -181 / L, / 1 I IV i500
600
800
Temperature (*K)
0-7
-2I a-- O
c-
cOc, - - ,
-I1000 1200
1500
2000
0.06
retention. For example, at 7000K ideal solid solution of -5
chlorapatite in fluorapatite accounts for only 10 % of all chlorine.
Wai and Wasson (1977) have calculated 50% conden-sation temperatures at 10- 4 bars pressure for fluorapatite and the present results can be compared with theirs. Wai and Wasson report that pure fluorapatite is 50% condensed at 8000K and that fluorapatite with an activity of 0.2 and
assumed to be in solution with chlorapatite or other minerals is 50% condensed at 8551K. The present results
indicate that along the nebular adiabat fluorapatite conden-sation starts at 7660K and is complete by 7410K. The
differences between the present results and the results of Wai and Wasson (19771 are possibly due to the assumptions made by Wai and Wasson in their calculations and the
thermo-dynamic data they used. For example, Wai and Wasson assumed the presence of whitlockite in their condensation calcula-tions for fluorapatite. However, the present results show that whitlockite does not condense until 7140K, 520 below the onset of fluorapatite condensation. Also, the assump-tion of fluorapatite soluassump-tion in chlorapatite is suspect because the present work indicates that chlorapatite conden-sation does not take place after sodalite condenses. Further-more, Wai and Wasson used the fluorapatite thermodynamic data
of Robie and Waldbaum (1968), which are incorrect.
Recent determinations of fluorine abundances in chon-dritic meteorites and in the Sun yield fluorine solar abun-dances approximately 2-3 times lower than the Cameron (1973)
fluorine abundance (Dreibus et al., 1979; Goldberg et al., 1974; Mason, 1979; Pagel, 1979; Suess, 19801. Therefore, the effect of a lower fluorine abundance upon the fluorine condensation results has been briefly investigated. Dreibus et al. (1979) list a fluorine abundance of F=780 on the Si= 106 scale. Use of their fluorine abundance yields a fluor-apatite condensation temperature only 80K lower than the fluorapatite condensation temperature calculated previously. However, due to the lower fluorine abundance, fluorapatite is now less abundant than whitlockite with the fluorapatite accounting for 124% of all phosphorus and the whitlockite accounting for A76% of all phosphorus. Recent determinations of the chlorine and bromine solar abundances (Dreibus et al., 1979; Mason, 1979-; Suess, 19801 are in good agreement with the Cameron (1973) chlorine and bromine abundances and no calculations based on more recent abundances were done.
(A more comprehensive discussion of halogen abundances is given in the section on volatile element retention by the terrestrial planets.1
chlorapatite is never stable once sodalite condenses, are based on chlorapatite log Kf values calculated from an estimat-ed SO 8 value. Thus, the sensitivity of the results to
variations in the chlorapatite log Kf values has been in-vestigated. The uncertainty in the chlorapatite S0 98
-1 -1 estimate is taken as approximately + 1 cal deg .mole on-the basis of (11 entropy estimates for fluorapatite, hydroxy-apatite, and other compounds for which S98 values are
available and (21 1% agreement between entropy estimates made by three separate methods. This entropy uncertainty
-i translates to an uncertainty of about + (0.3-1) kcal mole
3 -1
for AGO values which are on the order of 103 kcal mole- . However, this small uncertainty is insufficient to make chlorapatite condense before sodalite condenses or to make chlorapatite stable after sodalite condenses. In fact, the chlorapatite AGO value at 9000K must be increased by about
-l
50 kcal mole-1 (about 5% of the AGO value) to allow chlor-apatite condensation.
Although an uncertainty of several tens of kcal mole-is clearly not due to uncertainties in the chlorapatite
So estimate, it could conceivably be due to two factors:
298
(1) experimental errors in the H,298 determinations by
fGottschal (1958) and (2uncertaintiesintroduc298ed by the Gottschal (1958) and (2) uncertainties introduced by the
second law treatment of the data. It is difficult to quantify the effect of these two factors and no attempt to do so will be made. However, it should be noted that
the AH298 values measured by Gottschal (1958) for
fluor-f,298
apatite and hydroxyapatite agree within 1% with other experimental and tabulated values (Jacques, 1963; Parker et al., 1971). Furthermore, exoerience indicates that log Kf values calculated from second law and third law treatments generally are in good agreement.
Finally, the question of chlorapatite stability in the absence of sodalite condensation has been briefly considered. Assuming that all chlorine is present in the gas phase as HC1(g) and NaCl(g), chlorapatite condensation is predicted to occur in the 656-6780K range along the PSN adiabat. However, halite (NaCl condensation occurs at 6580K along the PSN adiabat. Thus, even in the
absence of sodalite condensation it is not possible to un-ambiguously decide if chlorapatite is stable. Further dis-cussion of chlorapatite and possible mechanisms for its
formation in chondrites will be presented in the section dealing with chondrite mineralogy.
Potassium
Figure I-5 illustrates the chemical equilibrium behavior of potassium-bearing compounds along the nebular
adiabat. The results in Figure I-5 model high sanidine (KAlSi308) condensation as an ideal solution in feldspar.
Potassium is 50% condensed at about 10200K and completely condensed at 9520 K. Condensation of high sanidine as a
pure phase starts at 943 0K and is essentially complete within 1000. Data from Seck (1971) and Saxena (1973) show that KAlSi308 in NaAlSi308-KAlSi3O -CaAl2Si208 exhibits positive
deviations from ideality (activity coefficients greater than 1). Thus, the present calculations modeling high sanidine condensation as an ideal solute and as a pure
phase bracket the actual KAlSi308 condensation temperature. Figure I-1 shows the KAlSi308 50% condensation
curve over a wide pressure range. This curve was calculated assuming a high sanidine ideal solution in anorthite
(CaAl2Si20 ). Actually, at all pressures shown the KAlSi308 50% condensation curve is 200-401 higher than the NaAlSi308 condensation curve. The two curves are drawn as one merely to simplify the graphical representation.
Also, potassium may behave similarly to sodium and partition into nepheline and sodalite phases at lower temperatures. Accurate chemical equilibrium calculations cannot be made because thermodynamic data for the potassium analog of sodalite are unavailable and activity data for the
50
FIGURE 1-5: The chemical equilibrium behavior of potassium-bearing com-pounds along the nebular adiabat. The heavy lines indicate the stability fields of the condensates. The abundances of KAlSi308 and K2SiO3 ideal solid
solu-tions in feldspar and enstatite,
re-spectively, are also illustrated. Results are shown for high sanidine ideal solu-tion in feldspar. Potassium is 50% con-densed at about 10200K and is completely condensed by 9520 K. Pure KAlSi308
con-densation starts at 943 0K and is essen-tially complete within 1000.
10
4/Temperot ure
0 ,2 C) 0 I 00 0500
600
800
1000 1200
Temperature (OK)
0 O 0 0 0 0 cnC
1500 2000
(0OK)relevant solid solutions are either unavailable or highly uncertain. However, assuming ideal solution in nepheline and neglecting potassium in sodalite phases, approximately 40% of the potassium will be in kaliophillite (KAlSiO4) at 7000K. Also, pure KAlSiO4 becomes stable at 5090 K.
The effect of variations in the KAlSi308 (high
sanidine) and KAlSiO4 (kaliophillite) thermodynamic data
(Robie et al., 1978) upon the high sanidine-kaliophillite condensation sequence have also been explored. The con-densation temperatures along the PSN adiabat for high
sanidine and kaliophillite calculated by neglecting (1) solid solution with other phases and (2) the prior condensation of other potassium-bearing phases differ by only 110K with KAlSi3 08 condensing at the higher temperature. However,
the tabulated uncertainties in the thermodynamic data for high sanidine and kaliophillite are sufficient to reverse the condensation sequence with kalioohillite condensing 80K
above high sanidine (neglecting the prior condensation of kaliophillite). Furthermore, once kaliophillite forms, high sanidine is never stable. Thus, the situation is analogous to that discussed previously for sodium, and on the basis of the available thermodynamic data alone it is impossible to unambiquously identify the initial potassium-bearing con-densate. More will be said about this situation in the
section on chondrite mineralogy.
THE HETEROGENEOUS ACCRETION MODEL
The strict heterogeneous accretion model, which is the extreme opposite of the strict homogeneous accretion model, assumes the rapid accretion of small particles into
larger bodies, thus preventing the material within these bodies from reacting further with the gas phase. The con-sequences of this process have been modeled by assuming complete isolation of newly formed condensates from all gases and all previous condensates. Thus, as soon as an element condenses it is removed from further reactions. This chemical disequilibrium model is essentially a
generalized and quantifiable, albeit extreme, version of the heterogeneous accretion model for the Earth proposed by Turekian and Clark (1969).
The condensation behavior of the elements Na, K, F,
Cl, Br and P in the heterogeneous accretion model has been
calculated and the results are presented in Table 1-3. The calculations apply to a solar composition gas cooled along the nebular adiabat of Figure I-1 and include newly re-calculated condensation temperatures for some compounds considered in Barshay and Lewis (1976). The results in
54
Table I-3
The Heterogeneous Accretion Model: Chemical Reactions Along the Nebular Adiabat
T( 0K) Reaction
1520 Condensation of Fe-Ni alloy 1455 Condensation of MgSiO 3 (Enstatite) 751 2Na(g) + H2S(g) = H2 (g) + Na 2S(s) 747 Na(g) + HF(g) = 1/2H2 (g) + NaF(s) 695 2K(g) + H2S(g) = H2(g) + K2S(s) 261 NH3 (g) + HBr(g) = NH4Br(s) 259 NH3 (g) + HC1(g) = NH 4Cl(s) 244 1/4P406 (g) + NH3 (g) + 5/2H20(g) = NH4H2PO4 (s) + H2(g) NH3 (g) + H2S(g) = NHAHS(s) 134
55
Table I-3 plus the results in Barshay and Lewis (1976) describe the major features of the heterogeneous accretion model reaction sequence over the temperature range 20000 -50K. Finally, it is important to note that the reaction sequence in the heterogeneous accretion model is not path-independent, and that the same results will not be obtained upon the volatilization of a homogeneous cold gas and dust mixture.
The predictions of the homogeneous and heterogeneous accretion models about volatile element chemistry along an
adiabat in the primitive solar nebula are summarized in
Tables I-2 and 1-3. The two extreme models are seen to make very different predictions about the chemistry of the
volatile elements Na, K, F, Cl, Br, P and S in the primitive solar nebula. Some features of the heterogeneous accretion model reaction sequence such as the chalcophile behavior
of the alkali metals, the failure of S and P to behave as siderophiles, and the failure of P, F, Cl, and Br to
behave as lithophiles are especially noteworthy. How do these predictions compare to the limited data on abundances of these volatiles in the terrestrial planets and to the observed mineralogy of the ordinary chondrites?
VOLATILE ELEMENT RETENTION BY THE TERRESTRIAL PLANETS
First, although no observational data about volatile element abundances in the planet Mercury are available, a qualitative comparison of the planet's formation zone and the condensation curves displayed in Figure I-1 suggests that Mercury should be depleted in all the volatile
elements considered in this study. The strict heterogeneous accretion model also predicts that Mercury will be depleted in all the volatiles considered. However, the (Fe,Ni)3P
condensation results of Sears (1978) imply that Mercury will retain phosphorus with approximately the solar P/Fe ratio. Second, the measured potassium abundances in very
small samples of the surface of Venus (Vinogradov et al., 1973; Surkov et al., 1976) and the observations of HC1 and HF in the upper troposphere (Connes et al., 1967) are con-sistent with the formation of Venus within the stability fields of feldspar, sodalite, and fluorapatite. However, the observations of Cl and K are inconsistent with the pre-dictions of the heterogeneous accretion model that Cl
retention at 2590K and K retention at 6950K do not take place in the formation zone at Venus. It is important to note that chemical equilibrium calculations by Lewis et al.
57
(1979) on the stability of various carbon-bearing species yield abundances of carbon compounds similar to the observed inventories on Venus and Earth. Furthermore Barshay and Lewis (1979) find that a 104-fold depletion of H20 on Venus is entirely compatible with a 10-fold depletion of FeS and a 10- to 100-fold depletion of FeO relative to the Earth. Thus, the need for covering Venus with a veneer of volatile-rich carbonaceous material and then removing all the excess water appears far from obvious.
Third, the (incomplete)data on abundances of Na, K, F, C1, Br, P, and S in the Farth can be compared with the qualitative predictions of the homogeneous and heterogeneous
accretion models. The homogeneous accretion model predicts that the bulk composition of the Earth is similar to that of the H group ordinary chondrites, but is not identical to nor derived from the H chondrites or any other meteorite
class (Lewis, 1972). For the volatile elements considered in this study (and sulfur) the homogeneous accretion
model predicts (terrestrial/chondritic) abundance ratios 1.0 for Na, K, F, Cl, P and S and a ratio < 1.0 for Br. Using the three composition models for the Earth presented by Smith (1977) and H chondrite and Cl chondrite analytical data from Mason (1979), abundance ratios for the volatile elements under consideration have been calculated and the results are presented in Table 1-4. The abundance ratio
presented is the quantity [(E/10 6Si)Earth/(E/10 6Si)chondrite], where (E/106Si) is shorthand for the elemental abundance
relative to 106 Si atoms. How accurate are these ratios and what do their values tell us?
First, it is necessary to realize that many assump-tions about the radial and lateral distribution of elements within the Earth and about the composition of the core are
necessary in the construction of any compositional models for the Earth. Smith (1977) has given a detailed discussion of the assumptions made in the construction of his models and the present discussion will not attempt to repeat all of them or to evaluate their validity. It is possible, however, to illustrate the effect of two sets of assump-tions on the abundance ratios calculated above. Thus, if it is assumed that Na, K, Cl, Br, and S occur throughout the entire mantle instead of only in the upper 10%, the terrestrial/H chondrite abundance ratios become Na(0.3),
K(1.1), Cl(2.4), Br(3.3), and S(2.71. Similarly, if iron
meteorites are not used to model the composition of the core and the crustal and mantle composition alone is used for the composition of the Earth, the P and S terrestrial/ H chondrite ratios become P(0.2) and S(0.005).
Second, it is also important to consider the quality of the analytical data for terrestrial samples and
meteorites. Smith (1977) discusses the quality of the analytical data for terrestrial samples and the quality of the chondrite analytical data will be briefly discussed here. The analytical data for Na, K, P, and S in C1 and H chondrites, which are presented in Mason (1979), show maximum variations less than a factor of 2 and are
reasonably consistent. However, the F, Cl, and Br analy-tical results for chondrites show considerably greater variations. Dreibus et al. (1979) compare their halogen
analytical results with previous results for carbonaceous, ordinary (L group), and enstatite chondrites. The observed variations for halogen analyses in different meteorites range from 1.1 (Ivuna Cl) - 14.5 (Mocs L6), 1.0 (Bruderheim L6) - 3.7 (Orgueil Cl), and 1.2 (Bruderheim L6) - 9
(Mocs L6) for F, C1 and Br, respectively. Allen and Clark (1977) and Mason (19791 also present comparisons of multiple fluorine analyses by different investigators on a single meteorite. Results tabulated by Mason (1979) for fluorine analyses of the Orgueil Cl and Allegan H5 chondrites display maximum variations of 5.5 and 5.3 times, respectively, and the data presented in Allen and Clark (1977) for the
average fluorine content of H-chondrites show a factor of 4 maximum variation. More comprehensive comparisons of halogen analytical data for the chondrites and other types