HAL Id: hal-01545399
https://hal.archives-ouvertes.fr/hal-01545399
Submitted on 1 Jun 2021
HAL is a multi-disciplinary open access
archive for the deposit and dissemination of
sci-entific research documents, whether they are
pub-lished or not. The documents may come from
teaching and research institutions in France or
abroad, or from public or private research centers.
L’archive ouverte pluridisciplinaire HAL, est
destinée au dépôt et à la diffusion de documents
scientifiques de niveau recherche, publiés ou non,
émanant des établissements d’enseignement et de
recherche français ou étrangers, des laboratoires
publics ou privés.
Distributed under a Creative Commons Attribution| 4.0 International License
Neurons Require Phosphatase Inhibition by DARPP-32
M. Polito, E. Guiot, Giuseppe Gangarossa, S. Longueville, M. Doulazmi,
Emmanuel Valjent, D. Herve, J.-A. Girault, D. Paupardin-Tritsch, L. R. V.
Castro, et al.
To cite this version:
M. Polito, E. Guiot, Giuseppe Gangarossa, S. Longueville, M. Doulazmi, et al.. Selective Effects
of PDE10A Inhibitors on Striatopallidal Neurons Require Phosphatase Inhibition by DARPP-32.
eNeuro, Society for Neuroscience, 2015, 2 (4), pp.ENEURO.0060-15.2015.
�10.1523/ENEURO.0060-15.2015�. �hal-01545399�
Disorders of the Nervous System
Selective Effects of PDE10A Inhibitors on
Striatopallidal Neurons Require Phosphatase
Inhibition by DARPP-32
1,2,3
Marina Polito,1,2Elvire Guiot,1,2Giuseppe Gangarossa,3,4,5Sophie Longueville,2,6,7Mohamed Doulazmi,1,2Emmanuel Valjent,3,4Denis Hervé,2,6,7Jean-Antoine Girault,2,6,7 Danièle Paupardin-Tritsch,1,2 Liliana R. V. Castro,1,2and Pierre Vincent1,2
DOI:http://dx.doi.org/10.1523/ENEURO.0060-15.2015
1CNRS, UMR8256 “Biological Adaptation and Ageing”, Institut de Biologie Paris-Seine (IBPS), F-75005 Paris, France, 2Université Pierre et Marie Curie (UPMC, Paris 6), Sorbonne Universités, Paris, F-75005, France,3CNRS, UMR-5203, Institut de Génomique Fonctionnelle, Montpellier, F-34094, France,4Institut National de la Santé et de la Recherche Médicale, U661, Montpellier, F-34094, France,5Universités de Montpellier 1 & 2, UMR-5203, Montpellier, F-34094, France,6Institut National de la Santé et de la Recherche Médicale UMR-S 839, Paris, France, and7Institut du Fer a` Moulin, Paris, France
Abstract
Type 10A phosphodiesterase (PDE10A) is highly expressed in the striatum, in striatonigral and striatopallidal medium-sized spiny neurons (MSNs), which express D1 and D2 dopamine receptors, respectively. PDE10A inhibitors have
pharmacological and behavioral effects suggesting an antipsychotic profile, but the cellular bases of these effects are unclear. We analyzed the effects of PDE10A inhibition in vivo by immunohistochemistry, and imaged cAMP, cAMP-dependent protein kinase A (PKA), and cGMP signals with biosensors in mouse brain slices. PDE10A inhibition in mouse striatal slices produced a steady-state increase in intracellular cAMP concentration in D1 and D2 MSNs,
demonstrating that PDE10A regulates basal cAMP levels. Surprisingly, the PKA-dependent AKAR3 phosphorylation signal was strong in D2MSNs, whereas D1MSNs remained unresponsive. This effect was also observed in adult mice
in vivo since PDE10A inhibition increased phospho-histone H3 immunoreactivity selectively in D2 MSNs in the
dorsomedial striatum. The PKA-dependent effects in D2MSNs were prevented in brain slices and in vivo by mutation
of the PKA-regulated phosphorylation site of 32 kDa dopamine- and cAMP-regulated phosphoprotein (DARPP-32), which is required for protein phosphatase-1 inhibition. These data highlight differences in the integration of the cAMP signal in D1and D2MSNs, resulting from stronger inhibition of protein phosphatase-1 by DARPP-32 in D2MSNs than
in D1MSNs. This study shows that PDE10A inhibitors share with antipsychotic medications the property of activating
preferentially PKA-dependent signaling in D2MSNs.
Key words: biosensor imaging; cAMP; phosphodiesterase; protein kinase; schizophrenia; striatum
Significance Statement
The striatum is mainly composed of medium-sized spiny neurons that express either dopamine D1receptors or
dopamine D2receptors. Their activity is associated with either the initiation of movement or action suppression,
respectively. Biosensor imaging revealed that pharmacological inhibition of type 10A phosphodiesterase in-creased cAMP levels in D1and D2neurons in the same manner, but only D2neurons exhibited an increase in the
protein kinase A-mediated phosphorylation level. This effect resulted from an asymmetrical regulation of phosphatases by DARPP-32. D2 neurons are thus more prone to respond to a tonic cAMP signal than D1
neurons, a property that may explain how phosphodiesterase 10A inhibitors produced antipsychotic-like behavioral effects. This D1/D2imbalance may also be critical for reward-mediated learning and action selection.
Introduction
Schizophrenia is a devastating psychiatric disease, which results in persistent cognitive and emotional impair-ments. Type 10A phosphodiesterase (PDE10A) inhibitors were recently proposed as a treatment for schizophrenia (Kehler and Nielsen, 2011;Chappie et al., 2012); however, their cellular mechanisms of action remain unclear with respect to their putative therapeutic effects. PDE10A is highly and almost exclusively expressed in medium-sized spiny neurons (MSNs) of the striatum (Seeger et al., 2003;
Coskran et al., 2006; Heiman et al., 2008; Lakics et al., 2010;Kelly et al., 2014). MSNs are divided into two cat-egories based on their expression of dopamine receptors and their sites of projection, as follows: MSNs projecting to the substantia nigra highly express dopamine D1 re-ceptors (hereafter termed D1MSNs); whereas, MSNs pro-jecting to the external globus pallidus highly express adenosine A2A and dopamine D2 receptors (hereafter termed D2MSNs;Gerfen et al., 1990;Le Moine and Bloch,
1995; Bertran-Gonzalez et al., 2008; Matamales et al., 2009). The high expression of PDE10A in MSNs, and its interaction with the scaffold protein AKAP150 (A-kinase anchoring protein 150), protein kinase A (PKA), PSD-95, and NMDA receptor suggests an important role in mod-ulating the spread of the synaptic cAMP signals into the cell body (Russwurm et al., 2015).
Besides PDE10A, striatal neurons express a number of specific signaling proteins that markedly differ from those in other brain regions (Girault, 2012), and that determine the characteristics of the cAMP/PKA signaling pathway (Castro et al., 2013). Among these specific proteins, DARPP-32 (32-kDa dopamine and cAMP-regulated phosphoprotein) is a multifunctional protein regulating phosphatase and kinase activities: for example, when DARPP-32 is phosphorylated at threonine 34 residue (Thr34) by PKA, it becomes a potent inhibitor of serine/threonine protein phosphatase-1 (PP-1;
Hemmings et al., 1984;Svenningsson et al., 2004), increas-ing the duration of PKA-dependent signals (Castro et al., 2013).
Classical and atypical antipsychotic agents share the property of inhibiting D2receptors and thus, in the stria-tum, increase PKA-dependent phosphorylation selec-tively in D2MSNs (Bateup et al., 2008;Bertran-Gonzalez
et al., 2008, 2009). In contrast, psychostimulants, which are psychotomimetic, activate many signaling responses in D1MSNs (Bateup et al., 2008;Bertran-Gonzalez et al.,
2008, 2009). PDE10A inhibitors were shown to increase cAMP levels in the striatum (Schmidt et al., 2008) and could be expected to mimic the effects of both antipsy-chotic and psychotomimetic compounds. We used bio-sensor imaging to precisely analyze the effects of PDE10A inhibitors on cAMP/PKA signaling at the level of individual D1 and D2 MSNs. Our work revealed that although PDE10A inhibition increased intracellular cAMP levels in both D1and D2MSNs, the downstream consequences at the level of PKA targets were profoundly different: the cAMP signal resulting from PDE10A inhibition strongly increased PKA-dependent phosphorylation in D2MSNs, whereas D1 MSNs remained mostly unaffected. Further analyses showed that the difference required DARPP-32-dependent regulation of phosphatase activity in D1and D2 MSNs.
Materials and Methods
Animals
Animals were housed under standardized conditions with a 12 h light/dark cycle, stable temperature (22 ⫾ 1ºC), controlled humidity (55⫾ 10%), and food and water available ad libitum. Homozygous mice expressing DARPP-32 with the T34A or T75A mutation ( Svenning-sson et al., 2003) were obtained by crossing heterozygous mice, on a mixed C57BL6/J-Sv129 background (a gift of Dr. P. Greengard, The Rockefeller University, New York). Male Drd2-EGFP heterozygous mice (C57Bl6/J) were generated as described previously (Gong et al., 2003). Experiments were performed in accordance with the reg-ulations under the control of the local ethic committee Charles Darwin C2EA - 05.
Live brain slice preparation
Brain slices were prepared from male mice that were 8 –12 days of age. Coronal brain slices were cut with a VT1200S microtome. Slices were prepared in an ice-cold solution of the following composition (in mM): 125 NaCl, 0.4 CaCl2, 1 MgCl2, 1.25 NaH2PO4, 26 NaHCO3, 25 glucose, and 1 kynurenic acid, saturated with 5% CO2and 95% O2. The slices were incubated in this solution for 30 min and then placed on a Millicell-CM membrane (Millipore) in culture medium (50% Minimum Essential Medium, 50% HBSS, 6.5 g/L glucose, penicillin-streptomycin; Invitrogen). We used the Sindbis virus as a vector to induce expression of the various biosensors after overnight incubation (Ehrengruber et al., 1999). The coding sequences of Epac-SH150 (Polito
et al., 2013), AKAR2-NLS (Zhang et al., 2005), AKAR3 (Allen and Zhang, 2006), and cygnet2 (Honda et al., 2001) were inserted into the viral vector pSinRep5 (Invitrogen). The viral vector (⬃5 ⫻ 105particles per slice) was added, and slices were incubated overnight at 35°C under an atmosphere containing 5% CO2. Before the experiment, slices were Received June 1, 2015; accepted August 10, 2015; First published August 25,
2015.
1
The authors declare no competing financial interests.
2Author contributions: M.P., E.V., D.H., D.P.-T., L.R.V.C., and P.V. designed
research. M.P., E.G., G.G., S.L., and L.R.V.C. performed research. M.P., E.G., G.G., S.L., M.D., L.R.V.C., and P.V. analyzed data. E.V., D.H., J.A.-G., D.P.-T., L.R.V.C., and P.V. wrote the paper.
3This work was supported by grants from ATIP-Avenir (Inserm) and from the
Agence Nationale de la Recherche, ANR-2010-JCJC-1412) to EV and ANR09-MNPS-014 to DH, and ERC to JAG. The groups of PV, and JAG and DH are part of the Bio-Psy Laboratory of Excellence.
Acknowledgments: Confocal microscopy and image analysis were per-formed at the Institut du Fer a` Moulin Imaging Facilities and at the Institute of Biology Paris-Seine Imaging Facility (supported by the “Conseil Regional Ile-de France”, the French National Research Council, and Sorbonne University, UPMC, Paris 6).
Correspondence should be addressed to Pierre Vincent, UMR8256, 9, quai St. Bernard, F-75005 PARIS, France. E-mail:pierre.vincent@upmc.fr.
DOI:http://dx.doi.org/10.1523/ENEURO.0060-15.2015
Copyright © 2015 Polito et al.
This is an open-access article distributed under the terms of theCreative Commons Attribution 4.0 International, which permits unrestricted use, distri-bution and reproduction in any medium provided that the original work is properly attributed.
incubated for 30 min in the recording solution (125 mMNaCl,
2 mM CaCl2, 1 mM MgCl2, 1.25 mM NaH2PO4, 26 mM NaHCO3, and 25 mMglucose, saturated with 5% CO2and 95% O2). Recordings were performed with a continuous perfusion of the same solution at 32°C. MSNs constitute 95% of neurons in the striatum. Large neurons (smallest soma diameter,⬎14m), presumably cholinergic interneu-rons, were excluded.
Live brain slice imaging
For two-photon imaging, excitation was obtained using a Ti:sapphire laser (MaiTai HP; Spectra Physics) tuned at 850 nm for CFP excitation. Galvanometric scanners (model 6210; Cambridge Technology) were used for ras-ter scanning, and a piezo-driven objective scanner (P-721 PIFOC; Physik Instrumente GmbH) was used for z-stack image acquisition. The system was controlled by MP-scope software (Nguyen et al., 2006). The microscope was based on an Olympus BX51WI upright microscope with a 40⫻ 0.8 numerical aperture (NA) or 60⫻ 0.9 NA water-immersion objective. A two-photon emission filter was used to reject residual excitation light (E700 SP; Chroma Technology). A fluorescence cube containing 479/40 and 542/50 emission filters and a 506 nm dichroic beamsplitter (FF01-479/40, FF01-542/50 and FF506-Di02-25x36 Brightline Filters; Semrock) was used for the orthogonal separation of the two fluorescence sig-nals. Two imaging channels (H9305 photomultipliers; Hamamatsu) were used for simultaneous detection of the two types of fluorescence emission. For each data point, an image stack of 30 – 40 images with a 0.5m interval was acquired.
Wide-field images were obtained with an Olympus BX50WI or BX51WI upright microscope with a 40⫻ 0.8 NA water-immersion objective and an ORCA-AG Camera (Hamamatsu). Images were acquired with iVision (Biovi-sion). The excitation and dichroic filters were D436/20 and 455dcxt. Signals were acquired by alternating the emis-sion filters, HQ480/40 for CFP, and D535/40 for yellow fluorescent protein, with a filter wheel (Sutter Instru-ments). These filters were obtained from Chroma Tech-nology.
No correction for bleed-through or direct excitation of the acceptor was applied, since this correction, while increasing the absolute amplitude of ratio changes, also increases the noise in the measurement (Ducros et al., 2009).
The biosensor chromophores are sensitive to nonspe-cific environmental disturbances. We used a mutated ver-sion of AKAR3 in which the threonine residue of the PKA phosphorylation site was replaced with an alanine residue (T391A) as a control. This AKAR3 (T391A) control sensor reported no ratio change in response to PDE10A inhibition in MSNs.
Data analysis
Images were analyzed with custom routines written in the IGOR Pro environment (Wavemetrics). The emission ratio was calculated for each pixel, as follows: F535/F480 for AKAR2-NLS and AKAR3, and F480/F535 for cygnet2 and Epac-SH150sensors. The pseudocolor images display
the ratio value coded in hue and the fluorescence of the preparation coded in intensity.
Two-photon imaging was used to separate individual neurons for a precise quantification of the amplitude of the response (Figs. 1, 2). Ratio measurements were per-formed on a series of 5–10 consecutive image from the image stack, centered on the cell body. With cytosolic biosensors, when visible, the nucleus was excluded from the measurement. Wide-field imaging (Figs. 3A–E) also allowed the unambiguous identification of D1 and D2 MSNs, provided that the infection level was kept low and no fluorescence overlap between neighboring neurons was observed. The optical cross-contamination resulting from out-of-focus light was evaluated by the final re-sponse to CGS 21680 and SKF-38393, applied sequen-tially: cells were rejected from analysis if the cross-contamination was⬎30%. For cGMP imaging (Fig. 3F,G), the data were quantified as relative ratio change. Quantifications of cAMP signals
The amplitudes of responses were quantified for each neuron as the fractional change in ratio from its own baseline and maximal final ratio response. Responses obtained from MSNs of the same type were averaged for each experiment (i.e., brain slice).
The free cAMP concentrations were estimated with the Epac-SH150biosensor from the ratio measurement using the Hill equation, with a Kdof 4.4Mand a Hill coefficient of 0.77, as determined from Polito et al. (2013). The maximal response corresponding to biosensor saturation (Rmax) was determined for each neuron at the end of the recording. This level was obtained by applying 13 M
forskolin (FSK), a dose known to be sufficient to maximally phosphorylate the highly sensitive probe AKAR3 in MSNs. For cAMP biosensors, this Rmaxvalue was obtained with 200MIBMX and 13Mforskolin.
The baseline cAMP level in control conditions was eval-uated by inhibiting adenylyl cyclases with 200 M
SQ22536, which resulted in a ratio decrease, measured in wide-field microscopy, of ⫺4.0% of the maximal ratio change. This decrease in baseline ratio was⫺4.9 ⫾ 0.7 and⫺3.3 ⫾ 0.7 (n ⫽ 6, p ⬍ 0.05 with paired Student’s t test), respectively, in D1 and D2 MSNs. Assuming that adenylyl cyclase inhibition effectively decreased cAMP levels down to a level sufficient to reach the minimal ratio level (Rmin), these values suggest a baseline cAMP con-centration in a range of⬃100 nM.
Tissue preparation and immunofluorescence
Mice, 8-10 weeks old, were treated with the drug for 60 min and then rapidly anesthetized with pentobarbital (500 mg/kg, i.p.; Sanofi-Aventis) and were transcardially per-fused with 4% (w/v) paraformaldehyde in 0.1MPBS, pH
7.5. Brains were post-fixed overnight in the same solution and stored at 4°C. The 30-m-thick sections were cut with a vibratome and stored at⫺20°C in a solution con-taining 30% (v/v) ethylene glycol, 30% (v/v) glycerol and 0.1Msodium phosphate buffer, until they were processed for immunofluorescence. Sections were processed as de-scribed inBertran-Gonzalez et al. (2009). Sodium fluoride 0.1 mM was included in all buffers and incubation
solu-tions. Histone H3 phosphorylation was revealed with a rabbit polyclonal antibody against phospho-Ser10-H3 (1: 1000; catalog #06570; Millipore) the specificity of which was confirmed in a previous study (Jordi et al., 2013). GFP was detected using chicken antibody against GFP (1:500;
catalog #A10262; Life Technologies). Following incuba-tion with primary antibodies, secincuba-tions were rinsed three times for 10 min in TBS and incubated for 45– 60 min with goat Cy3-coupled (1:500; Jackson ImmunoResearch;Fig. 5) and goat A488 (1:500; Life Technologies;Fig. 6).
Sec-A
B
C
D
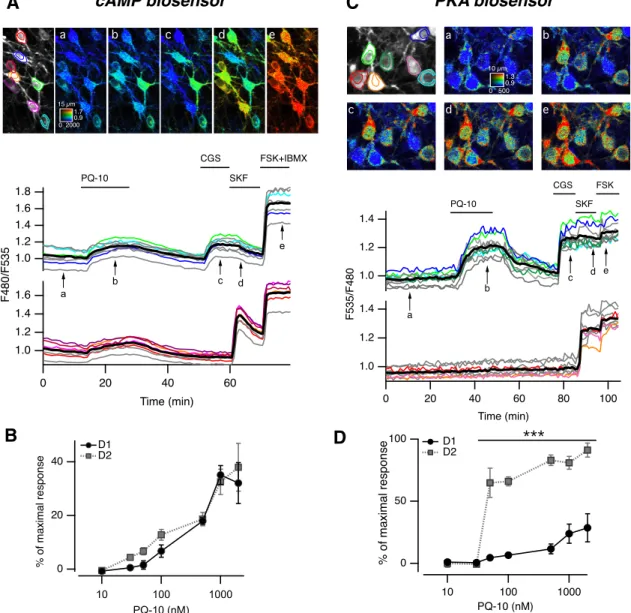
Figure 1. PDE10A inhibition increases cAMP levels in both in D1and D2MSNs, and PKA-dependent phosphorylation only in D2MSNs. A, MSNs in a neostriatal mouse brain slice expressing the cAMP biosensor Epac-SH150were imaged with two-photon microscopy
during the application of PQ-10 (100 nM). Images (vertical projection of the image stack) show the raw fluorescence at 535 nm (left,
in grayscale) and the ratio (in pseudocolor) indicating intracellular cAMP concentrations, at the times indicated by the arrows on the graph below. The calibration square in A indicates the spatial scale (the size of the square is indicated in micrometers), and shows the ranges of intensity (horizontally) and ratio (vertically). Each trace on the graph indicates the F480/F535 emission ratio measured in regions indicated by the color contour drawn on the raw image. Traces in gray correspond to regions that are not visible on these images. Traces are plotted in two groups according to their response to either CGS 21680, an adenosine A2Areceptor agonist (CGS,
1M), or SKF-38393, a D1-like receptor agonist (SKF, 1M). The thick black line represents the average of all the traces in a group.
FSK (13M) and IBMX (200M) were applied at the end of the recording to determine the maximal response. B, The same experiment
was repeated for every PQ-10 concentration tested. No significant difference was found between D1and D2MSNs (two-way ANOVA:
dose effect, F(6,54)⫽ 40.91, p ⬍ 10ⴚ4; D1/D2effect, F(1,54)⫽ 2.56, p ⫽ 0.115; dose ⫻ D1/D2interaction, F(6,54)⫽ 0.625, p ⫽ 0.709).
Error bars indicate the SEM. C, Same as A, except that the AKAR3 biosensor was used to monitor PKA-dependent phosphorylation, and the ratio was calculated as F535/F480. D, Same as B for AKAR3 measurements. Data were analyzed with two-way ANOVA: dose effect, F(6,38) ⫽ 28.31, p ⬍ 10ⴚ4; D1/D2 effect, F(1,38) ⫽ 143.73, p ⬍ 10ⴚ4; dose ⫻ D1/D2 interaction, F(6,38) ⫽ 9.23, p ⬍ 10ⴚ4
tions were rinsed for 10 min twice in Tris-buffered saline and twice in Tris buffer (0.25M Tris) before mounting in
1,4-diazabicyclo-[2. 2. 2]-octane (Sigma-Aldrich). Single-labeled images (Fig. 6) were obtained with a Zeiss LSM780 Confocal Microscope. Double-labeled im-ages (Fig. 5) were obtained with a Leica TCS SPE Con-focal Microscope with laser lines at 496 and 561 nm, acquiring in the 501–539 nm and 570 – 660 nm bands. All parameters were held constant for all sections from the same experiment.
Statistics
Data were analyzed with SPSS statistical software version 22.0. Normality in variable distributions and homogeneity of variances across groups were assessed with the Sha-piro–Wilk and Levene tests, respectively. Variables that failed any of these tests were analyzed with nonparamet-ric statistics using the Kruskal–Wallis ANOVA on ranks followed by Mann–Whitney rank sum test with a Dunn– Sidak adjustment test for pairwise multiple comparisons. Variables that passed the normality test were analyzed with ANOVA followed by Bonferroni post hoc test for multiple comparisons or by Student’s t test for comparing two groups. Paired data were analyzed with a Student’s t test. A p value of⬍0.05 was used as a cutoff for statistical significance. All error bars represent the SEM; n indicates the number of experiments (i.e., the number of brain slices tested), with at least four neurons of each type in each experiment. All experiments were performed on at least three different brain slices from at least two animals. Drugs
SKF-38393 hydrobromide, CGS 21680 hydrochloride, 1-methyl-3-isobutylxanthine (IBMX), rolipram, papaver-ine, roscovitpapaver-ine, okadaic acid, cantharidin, gabazpapaver-ine, CNQX, APV, and forskolin were obtained from Tocris Cookson. TTX was from Latoxan. PQ-10, MP-10, and roflumilast were a gift from Janssen Pharmaceuticals. TP-10 was provided by Pfizer through the Compound Transfer Program.
Results
PDE10A inhibition reveals a tonic cAMP production in both D1and D2MSNs
Since both D1 and D2 MSNs express high levels of PDE10A protein (Nishi et al., 2008), we used biosensor-imaging approaches to compare the effects of PDE10A inhibition on the cAMP/PKA signaling cascade in D1and D2 MSNs. First, we monitored changes in intracellular cAMP concentrations with two-photon microscopy in stri-atal brain slices expressing Epac-SH150. At the end of every experiment, an agonist of adenosine A2Areceptors (CGS 21680, 1M) and an agonist of dopamine D1 recep-tors (SKF-38393, 1M) were applied sequentially,
trigger-ing a positive cAMP response in D2 and D1 MSNs, respectively, thereby functionally identifying MSN sub-types. The final application of the general adenylyl cyclase activator FSK (13 M) together with the nonselective
phosphodiesterase inhibitor IBMX (200M) produced the maximal ratio response used for normalization.
PDE10A inhibition with PQ-10 (100 nM) increased cAMP
levels in all MSNs (Fig. 1A) in a dose-dependent manner. This dose dependency was not statistically different be-tween D1and D2MSNs (Fig. 1B). At the highest doses (1 and 2M), cAMP responses reached⬃35% of the max-imal response to FSK plus IBMX, which corresponds to a concentration of free cAMP of⬃2M(see Materials and
Methods for details on the estimation of cAMP concen-trations). These experiments showed that, in the basal condition, cAMP is tonically produced in striatal slices and that PDE10A contributes significantly to its degradation. PDE10A inhibition increases the phosphorylation of a PKA target exclusively in D2MSNs
We then analyzed the effects of PQ-10 on PKA-dependent phosphorylation levels using the PKA biosen-sor AKAR3. As for cAMP imaging, MSNs were identified at the end of each experiment by their response to either A2Aor D1receptor agonist. The maximal AKAR3 response was elicited by FSK. Although the increase in free cAMP concentration was similar in D1and D2MSNs (Fig. 1A,B), the resulting PKA-dependent phosphorylation levels were completely different (Fig. 1C): PQ-10 (100 nM) strongly
increased the emission ratio of AKAR3 in the D2MSNs (66 ⫾ 4% of the maximal response to FSK, n ⫽ 4); whereas, in D1MSNs, the ratio remained at a much lower level (6⫾ 2%). These results indicated a significantly higher phos-phorylation of AKAR3 in D2than in D1MSNs in response to PQ-10. The effect of PQ-10 on AKAR3 ratio in D2MSNs was steeply dose dependent with a maximal effect reached at ⬍100 nM (Fig. 1D). In stark contrast to D2 MSNs, even high doses of PQ-10, which increased cAMP to the same levels in D1 and D2 MSNs (Fig. 1B), only produced a very small effect on AKAR3 phosphorylation in D1MSNs (Fig. 1D). These experiments thus revealed a much stronger effect of cAMP on PKA-dependent phos-phorylation in D2than in D1MSNs.
PDE10A may be addressed differentially in the cyto-plasm and membranes (Kotera et al., 2004;Charych et al., 2010), and cAMP dynamics could differ in subcellular domains of different geometry, like dendrites (Castro et al., 2010). An increase in AKAR3 ratio was observed exclusively in the dendritic branches that responded to the A2Aagonist, whereas dendrites, which responded to the D1 agonist, showed no response to 100 nM PQ-10 (Fig. 2A). This is consistent with other biosensor record-ings in which dendrites of D1 MSNs also exhibited no baseline response to PDE10A inhibition (Yagishita et al., 2014).
Once activated, PKA can translocate to the nucleus and phosphorylate a number of nuclear proteins. We exam-ined whether the differential response to PQ-10 also ex-isted in the nucleus. Using the nuclear AKAR2-NLS biosensor, we found that PDE10A inhibition induced a strong ratio increase in D2 MSNs, while D1 MSNs re-mained unresponsive (Fig. 2B). These results showed that PQ-10 efficiently increased AKAR3 phosphorylation in the cytoplasm and nucleus of D2but not D1MSNs, whereas they had a similar and selective effect on cAMP produc-tion in the two cell types.
PDE10A inhibition effects are antagonized by D2 receptors and independent of A2Areceptors
One feature of striatopallidal MSNs is the coexpression of D2 dopamine and A2A adenosine receptors, negatively and positively coupled to adenylyl cyclase, respectively (Schiffmann et al., 1991;Schiffmann and Vanderhaeghen, 1993; Ferré et al., 1997; Svenningsson et al., 1999; Ba-teup et al., 2008;Bertran-Gonzalez et al., 2009). Applica-tion of the D2 receptor agonist quinpirole (1 M) completely reversed the PQ-10-induced AKAR3 response in D2 MSNs, monitored with wide-field microscopy (Fig.
3A). Application of quinpirole alone had no effect on the basal AKAR3 ratio but prevented positive responses to PQ-10 in D2MSNs with 11⫾ 3% (n ⫽ 5) of the maximal FSK response in D2MSNs compared with 9⫾ 2% in D1 MSNs (Fig. 3B). These results showed that the activation of D2receptors opposed the effect of PQ-10 in D2MSNs, most likely via Gi-mediated inhibition of the tonic adenylyl cyclase activity. These experiments also further confirmed
that the positive AKAR3 response to PQ-10 was specific to MSNs expressing D2receptors.
We then determined whether the effect selectivity for D2 MSNs was a particular property of PQ-10 or was also observed with other PDE10A inhibitors. The effects of MP-10 (100 nM) and papaverine (1 M) on AKAR3 ratio
were similar (Fig. 3C,D), inducing an AKAR3 ratio increase selectively in D2MSNs. TP-10 also produced the same response profile (see below). In contrast, PDE4 inhibitors (rolipram, 100 nM, n⫽ 4; and roflumilast, 1M, n⫽ 4) had
no effect on basal AKAR3 ratio (data not shown). As D2MSNs express adenosine A2Areceptors, we ex-amined whether the tonic presence of extracellular aden-osine in our brain slice preparation activated adenylyl cyclase and might be responsible for the positive re-sponse to PQ-10 recorded specifically in these MSNs. When A2Areceptors were blocked with SCH 58261 (100 nM), PQ-10 still elicited positive responses in D2 MSNs (Fig. 3E). In contrast, SCH 58261 blocked the responses
A
B
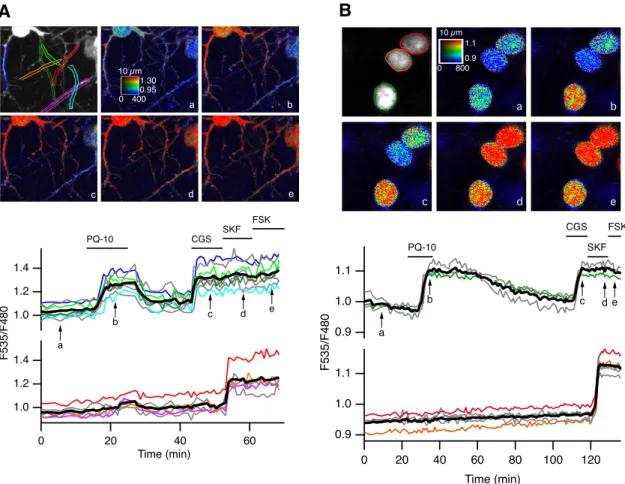
Figure 2. PDE10A inhibition triggers positive PKA responses in dendrites and nuclei preferentially in D2MSNs. A, B, Brain slices
expressed the PKA sensor AKAR3 (A) or AKAR2-NLS (B) and were imaged by two-photon microscopy during the application of PQ-10 (100 nM). Images show the raw fluorescence at 535 nm (left in grayscale) and the ratio (in pseudocolor) indicating the PKA-dependent phosphorylation level of the biosensor, at the times indicated by the arrows on the graph below. The calibration square in A indicates the spatial scale (above, in micrometers), and shows the ranges of intensity (horizontally) and ratio (vertically). Each trace on the graph indicates the F535/F480 emission ratio measured on regions indicated by the color contour drawn on the raw image. Traces are plotted in two groups according to their response to either CGS 21680 (CGS, 1M) or SKF-38393 (SKF, 1M). The thick black line represents the average of all the traces in a group. FSK (13M) was applied at the end of the recording to determine the maximal response.
A
B
C
D
E
F
G
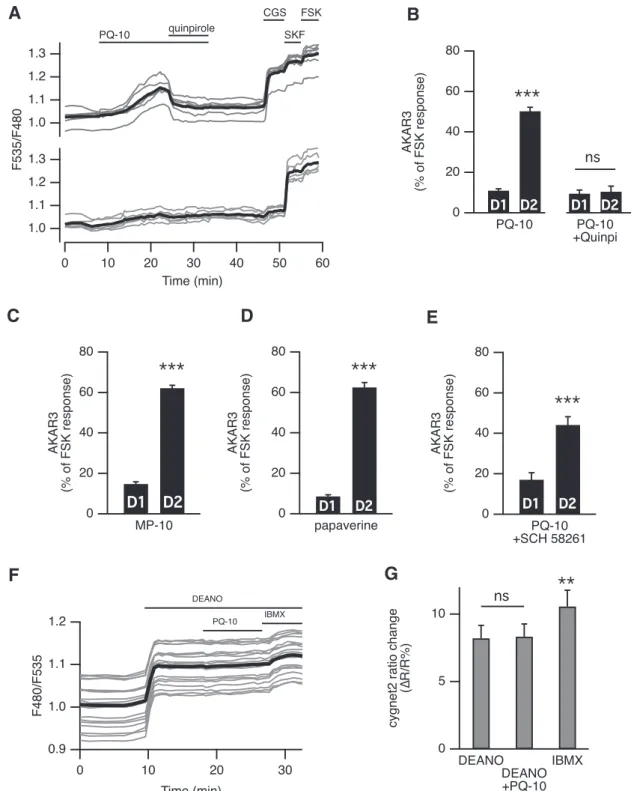
Figure 3. A, Activation of D2dopamine receptors suppressed the effect of PDE10A inhibition on AKAR3 ratio. Each trace on the graph
indicates the ratio measurement on MSNs expressing AKAR3 and identified as D1 or D2 according to their response to either
SKF-38393 (SKF, 1M) or CGS 21680 (CGS, 1M), respectively. The thick black line represents the average of all the traces in a group. Bath application of the agonist of dopamine D2receptors quinpirole (1M) reversed the response to PQ-10 (100 nM). B, D2
receptor activation prevented the response to PDE10A inhibition: the effect of PQ-10 was measured in the presence of the D2agonist
quinpirole (1M). No statistically significant difference (p⬎ 0.05) was found between D1and D2MSNs (n⫽ 5). The effect of PQ-10
is displayed for comparison on the left (same data as inFig. 4E). C, D, Other PDE10A inhibitors also increased the AKAR3 ratio preferentially in D2MSNs: MP-10 (C; 100 nM, n⫽ 9) and papaverine (D; 1M, n⫽ 5) both increased the AKAR3 ratio selectively in
D2MSNs. E, PQ-10 increased AKAR3 ratio selectively in D2MSNS even when adenosine A2Areceptors were inhibited with 100M
SCH 58261 (n⫽ 4). B–E, Statistical differences were tested with paired Student’s t test. ⴱⴱⴱp ⬍ 0.001. F, PDE10A inhibition had no effect on cGMP levels measured with the cGMP sensor cygnet2. The NO donor DEANO (100M) increased the ratio; after reaching a steady-state level, PQ-10 (1M) was added; at the end of the recording, the maximal ratio response was elicited by DEANO plus
to the A2A agonist CGS 21680 (data not shown). These results showed that tonic activation of A2Areceptors was not required for the phosphorylation response to PQ-10 in D2MSNs. We then examined whether the phosphoryla-tion signal involved endogenous neuronal activity, or re-quired the glutamate and GABA which may be present in the brain slice. This was not the case since, in the pres-ence of blockers of voltage-gated sodium channels (TTX, 100 nM), calcium channels (CdCl2, 200M), non-NMDA receptors (CNQX, 10M), NMDA receptors (APV, 10M), and GABAA receptors (SR 95531, 1 M), the selective effect of PQ-10 on D2MSNs was still present (25⫾ 3 vs 71⫾ 10 of the maximal FSK response in D1and D2MSNs, respectively; n ⫽ 3, paired Student’s t test; data not shown).
Since PDE10A also degrades cGMP and PDE10A inhi-bition was shown to increase cGMP levels and affect synaptic transmission in vivo (Siuciak et al., 2006;
Schmidt et al., 2008; Grauer et al., 2009;Padovan-Neto et al., 2015), we used wide-field imaging of the cGMP biosensor cygnet2 (Honda et al., 2001) to determine whether PDE10A also regulated cGMP in MSNs. PQ-10 (1 M) had no effect on the baseline cGMP levels (n⫽ 4, p ⫽
0.44, one-sample Student’s t test). In addition, PQ-10 (1 M) had no effect on the cGMP steady-state level
ob-tained with the nitric oxide (NO) donor DEANO (Diethyl-amine nitric oxide, 100 M; n ⫽ 6; Fig. 3F), while the
nonspecific phosphodiesterase inhibitor IBMX produced a significant ratio increase. These results indicated that in our conditions PDE10A inhibition does not significantly affect cGMP levels in MSNs.
Different responsiveness of D1and D2MSNs is abolished by protein phosphatase inhibition
The difference between D1and D2MSNs in the phosphor-ylation level of AKAR3 could result from differences in the rate of phosphorylation by PKA, dephosphorylation by phosphatases, or both. A difference in PKA levels is un-likely because immunostaining of catalytic subunits in the striatum did not reveal major differences between cells (Yang et al., 2014). Since AKAR3 biosensor responses to PKA activation are reversed by the action of endogenous protein phosphatases (Gervasi et al., 2007), we investi-gated the role of protein phosphatases in the different responsiveness of D1and D2MSNs to PDE10A inhibitors. Cantharidin (30 M), a nonselective inhibitor of PP-1 and PP-2A, had no effect by itself on the AKAR3 emission ratio (Fig. 4A). However, when PQ-10 (100 nM) was ap-plied in the bath (Fig. 4A), the AKAR3 ratio increased in virtually all D1 and D2 MSNs (79 ⫾ 10% of the FSK response, n⫽ 5). Since these responses did not return to the baseline after drug washout, it was impossible to distinguish between D1and D2MSNs, and all MSNs were
pooled (Fig. 4F, gray color bar). To identify which phos-phatase subtype was involved in the response, we used fostriecin (200 nM), a selective inhibitor of PP-2A (Swingle
et al., 2009). We observed no effect of this inhibitor alone on basal AKAR3 ratio, and it did not alter the selective response to PQ-10 in D2 MSNs (Fig. 4B). These results showed that PP-2A was not involved in the different responsiveness of D1/D2 and rather suggested the in-volvement of PP-1.
PP-1 regulation by DARPP-32 is necessary for the selective responsiveness of D2MSNs to PDE10A inhibition
DARPP-32 is expressed at high levels in both types of MSNs and constitutes a powerful and specific inhibitor of PP-1 when it is phosphorylated at Thr34 (Hemmings et al., 1984). We used a knock-in mutant mouse line in which Thr34 is replaced by an alanine (T34A; Svenningsson et al., 2003). In T34A mice, the effect of PQ-10 on AKAR3 was strongly reduced in D2 MSNs (14⫾ 2%, n ⫽ 13, 6 mice), whereas, as in wild-type mice, no effect was ob-served in D1MSNs (8⫾ 1%;Fig. 4C,E). Normal responses to D1or A2Astimulations were observed at the end of the recording. The phosphatase inhibitor cantharidin un-masked the response to PQ-10 in all MSNs of the DARPP-32 T34A mice (Fig. 4F), confirming that, upon inhibition of PP-1, PQ-10 was still capable of increasing the AKAR3 response in these mutant mice. Together, these results show that the inhibition of PP-1 by DARPP-32 is necessary for the difference in responsive-ness of D1and D2MSNs.
DARPP-32 also inhibits PKA activity when it is phos-phorylated at Thr75 by Cdk5 (Bibb et al., 1999;Nishi et al., 2000). A higher phosphorylation level of this residue in D1 MSNs could be responsible for a weaker PKA activity in these neurons. However, in a knock-in mutant mouse line with a Thr75-to-alanine mutation (DARPP-32 T75A; Sven-ningsson et al., 2003), the profile of the AKAR3 response to PQ-10 was the same as that in wild-type mice (Fig. 4D,E). Moreover, the Cdk5 inhibitor roscovitine (10 M) had no effect on the D1/D2imbalance in the response to PQ-10 (Fig. 4G), ruling out the involvement of Thr75 of DARPP-32 as a critical determinant for the lack of PQ-10-dependent AKAR3 responses in D1MSNs.
In vivo PDE10A inhibition selectively induces histone
H3 phosphorylation in D2MSNs of the dorsomedial striatum
Our results showed a marked difference in the respon-siveness of D1and D2MSNs to PDE10A inhibitor in slices. We then investigated whether the D1/D2imbalance could also be observed in vivo by monitoring phospho-histone H3 at Ser10 residue (PH3), a substrate for several protein continued
IBMX (200M). G, No difference was measured when comparing the response with DEANO alone and DEANO with PQ-10, while IBMX
produced a significant increase. The data expressed as the mean⫾ SEM were analyzed by repeated-measures one-way ANOVA F(1,5)
⫽ 11,224, p ⬍ 0.001, n ⫽ 6, followed by Bonferroni’s post hoc test: ⴱⴱp ⬍ 0.01). A–G, Brain slices were imaged with wide-field microscopy. All data are expressed as the mean⫾ SEM.
A
B
C
D
E
F
G
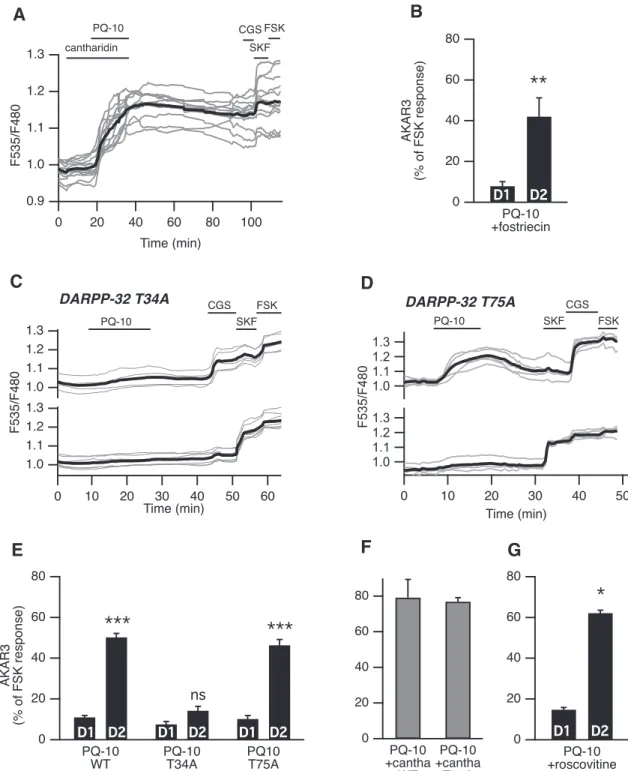
Figure 4. DARPP-32-mediated phosphatase inhibition favors PKA signaling in D2MSNs. A, PP-1 and PP-2A were inhibited with
cantharidin. Cantharidin (30M) alone did not change the basal ratio but strongly increased the AKAR3 response to PQ-10 (100 nM) in all MSNs. These responses were not reversible, making the final identification of D1and D2MSNs impossible (gray bars in F, which
represent the responses of all MSNs). B, D2MSNs responded selectively to PQ-10 (100 nM) even when the PP-2A inhibitor fostriecin
(200 nM) was applied (n⫽ 4, paired Student’s t test; ⴱⴱp ⬍ 0.01). C–E, Mutation of the Thr34 to Ala in DARPP-32 (DARPP-32 T34A) strongly reduced the effect of PQ-10 (100 nM) in D2MSNs, whereas the selective effect of PQ-10 on D2MSNs remained in brain slices
from animals bearing the Thr75 to Ala mutation in DARPP-32 (DARPP-32 T75A). C, D, Representative experiments performed with DARPP-32 T34A (C) and DARPP-32 T75A (D) knock-in mice. Each trace on the graph indicates the ratio measurement on MSNs expressing AKAR3 and is identified as D1or D2according to their response to either SKF-38393 (SKF, 1M) or CGS 21680 (CGS,
1M), respectively. The thick black line represents the average of all the traces in each group. E, The data expressed as the mean ⫾ SEM were analyzed by two-way ANOVA: genotype effect, F(2,72)⫽ 71.12, p ⬍ 10ⴚ4; D1/D2effect, F(1,72)⫽ 333.07, p ⬍ 10ⴚ4;
genotypeⴛ D1/D2interaction, F(2, 72)⫽ 49.53, p ⬍ 10ⴚ4. Bonferroni’s post hoc test:ⴱⴱⴱp ⬍ 0.001. F, In wild-type (WT) mice and
DARPP-32 T34A mutants, and in the presence of cantharidin (30M), all MSNs responded to PQ-10 (100 nM) with an increase in AKAR3 ratio such that D1and D2MSNs could not be distinguished (n⫽ 5 for both). No significant difference was obtained between
kinases including PKA (Nowak and Corces, 2004). We used transgenic mice in which D2MSNs are identified by GFP fluorescence (drd2-EGFP mice; Gong et al., 2003;
Bertran-Gonzalez et al., 2008) and monitored PH3 by immunofluorescence. In these in vivo experiments, we studied the effects of TP-10 (3 mg/kg, i.p.), a PDE10A inhibitor known to produce clear behavioral effects (Schmidt et al., 2008). At this dose, TP-10 induced a large increase in the number of PH3-positive neurons in the striatum 60 min after treatment, compared with vehicle treatment. Quantification showed that 93% of the PH3-immunoreactive neurons were GFP positive (D2MSNs) in the dorsomedial striatum, whereas in lateral parts of the striatum both GFP-negative and GFP-positive D2MSNs exhibited PH3 immunoreactivity (Fig. 5A–C). In the
nu-cleus accumbens, a sparse and irregular labeling was
observed in the shell region, and no immunoreactivity was detected in the core. In all striatal regions, no PH3 immu-noreactivity was observed in large neurons expressing low levels of GFP, presumably corresponding to cholin-ergic interneurons.
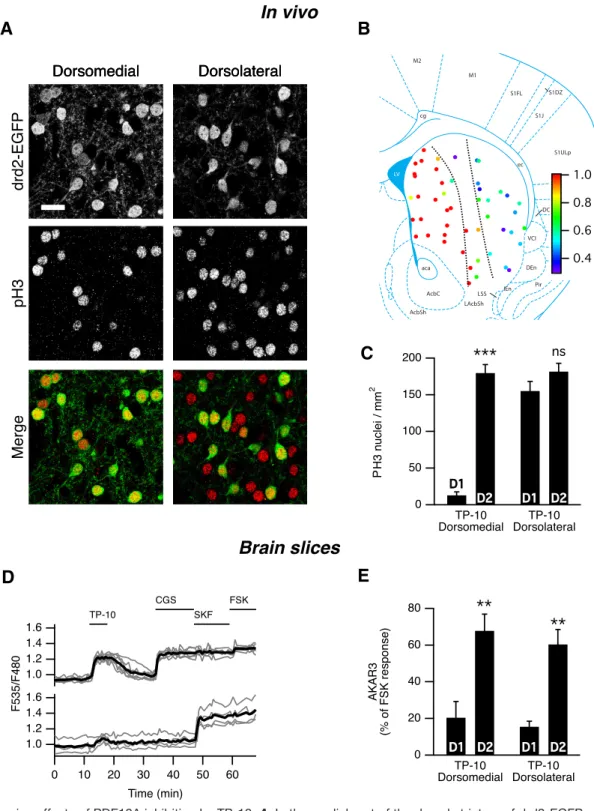
Since in vivo the selective effects of TP-10 on D2MSNs was observed in the dorsomedial, but not the dorsolateral striatum, we performed a set of experiments in brain slices to compare medial and lateral dorsal striatum using the same inhibitor. The AKAR3 responses to TP-10 (100 nM) were similar, with a strong effect of TP-10 in D2MSNs but not in D1MSNs (Fig. 5D,E). Altogether, these experi-ments showed that PDE10A exerts selective effects on D2 MSNs in striatal slices and that this selectivity is main-tained in vivo in the dorsomedial striatum.
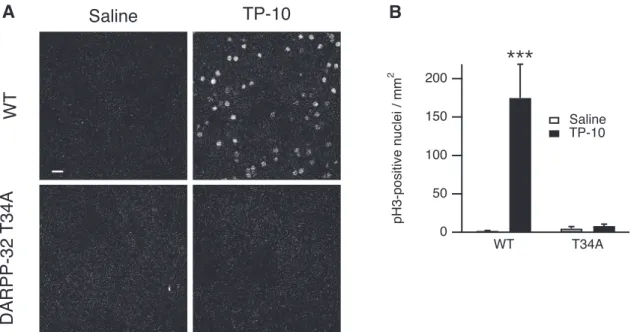
DARPP-32 is required for the in vivo effects of TP-10 Our experiments in striatal slices showed that the inhibi-tion of PP-1 by DARPP-32 phosphorylated on Thr34 was necessary for the selective responsiveness to PDE10A inhibition on AKAR phosphorylation. We then investigated whether the effects of PDE10A inhibition in vivo also depended on the phosphorylation of DARPP-32 at Thr34. T34A knock-in and wild-type littermates were treated with TP-10 (3 mg/kg, i.p.) or vehicle (four animals for each condition) and brain sections analyzed by immunofluores-cence for PH3 60 min after injection. Whereas wild-type littermates strongly responded to TP-10, the effect of TP-10 was completely abolished in the DARPP-32 T34A mutant mice in all regions of the striatum (Fig. 6A,B). These experiments clearly showed that Thr34 in DARPP-32 was required for the effects of PDE10A inhib-itor on D1 and D2 MSNs in both the dorsomedial and dorsolateral striatum in vivo.
Discussion
Our study shows that although PDE10A is expressed and functional in all types of MSNs, its inhibition in striatal slices produces a higher PKA-dependent protein
phos-phorylation response in D2 MSNs than in D1MSNs. We provide evidence that this difference is present in all striatal regions in brain slices and in the dorsomedial striatum of adult mice in vivo. Moreover, we show that the regulation of PP-1 activity by DARPP-32 is required for these specific effects of PDE10A inhibitors. These obser-vations provide novel insights into the regulation of the cAMP/PKA pathway in the two populations of MSNs and the possible antipsychotic action of PDE10A inhibitors.
PDE10A is one of the enzymes specifically enriched in the striatum (Seeger et al., 2003; Coskran et al., 2006;
Heiman et al., 2008;Lakics et al., 2010;Kelly et al., 2014), and the data reported here show that PDE10A plays an important role in degrading basally produced cAMP in both D1and D2MSNs. MSNs thus contrast with pyramidal neurons of the prefrontal cortex in which basal cAMP is predominantly controlled by PDE4 (Castro et al., 2010). Although PDE4B is also expressed in D2 MSNs (Nishi
et al., 2008), biosensor imaging of the somatic cytoplasm did not reveal significant effects of its inhibition in MSNs in our conditions.
PDE10A inhibition showed no effect on basal or stimu-lated cGMP production. A similar lack of effect of PDE10A inhibitors on cGMP has already been reported in brain slice preparations (Nishi et al., 2008). PDE10A thus differs from PDE1 and PDE2, other dual-specificity PDEs ex-pressed in MSNs, which were shown in striatal homoge-nates to be the major PDEs involved in the control of cGMP levels (Russwurm et al., 2015). Using biosensor-imaging techniques, PDE2 was also shown to be the main PDE that regulated stimulated cGMP, while also regulat-ing cAMP in a cGMP-dependent manner (Polito et al., 2013). In vivo, PDE10A inhibition was shown to increase cGMP levels and to affect synaptic transmission (Siuciak et al., 2006; Schmidt et al., 2008; Grauer et al., 2009;
Padovan-Neto et al., 2015), and why this effect was not observed in brain slices remains to be determined. One hypothesis to explain this discrepancy might be that, in
vivo, PDE10A inhibitors recruit nitric oxide
synthase-positive striatal interneurons through a global increase in network activity.
While D1 and D2 MSNs share a number of cellular features, more detailed studies revealed subtle differ-ences (Valjent et al., 2009), such as different excitability profiles (Gertler et al., 2008;Threlfell et al., 2009). Differ-ences were also reported at the level of PKA-dependent phosphorylation of GABAA receptors and DARPP-32, which were higher in D2MSNs than in D1MSNs (Janssen
et al., 2009;Nishi et al., 2008). Our work reveals a possible basis for these D1/D2differences, which lies at the level of DARPP-32-mediated PP-1 regulation. In D1 MSNs, the Thr34 of DARPP-32 is in a lower phosphorylation state than in D2MSNs and, thus, the PP-1 activity reverts PKA target sites to the dephophorylated state (Fig. 7). This continued
wild-type and DARPP-32 T34A mutant (unpaired Student’s t test, p⬎ 0.05). G, D2MSNs responded selectively to PQ-10 (100 nM)
A
B
C
D
E
P
Figure 5. In vivo effects of PDE10A inhibition by TP-10. A, In the medial part of the dorsal striatum of drd2-EGFP adult mice treated
with TP-10 (3 mg/kg), PH3 was selectively observed in D2MSNs. In the lateral part of the dorsal striatum, PH3 immunoreactivity was
observed in both EGFP-positive and EGFP-negative MSNs. EGFP and PH3 are shown in grayscale, and are overlaid with EGFP in green and PH3 in red (Merge). Scale bar, 20m. B, Each color spot represents a position where the relative distribution of D2/(D1⫹
D2) PH3-positive MSNs is indicated in pseudocolor, over a schematic of coronal mouse brain (Franklin and Paxinos, 2007). C,
PH3-positive nuclei were quantified in medial and lateral parts of the dorsal striatum as defined by the dotted line in B. The effect of localization was significant (Kruskal–Wallis test followed by a Mann–Whitney test with a Dunn–Sidak adjustment test for pairwise multiple comparisons tests, p⬍ 10⫺4), with PH3-positive nuclei being preferentially D2MSNs in the medial striatum.ⴱⴱⴱindicates a
difference between EGFP-positive (D2) and EGFP-negative (D1) MSNs with p⬍ 10ⴚ4. D, The preferential AKAR3 response is also
observed in the lateral striatum in brain slices from neonate mice. MSNs were transduced for the expression of the AKAR3 biosensor and imaged with wide-field microscope in the lateral striatum. Each trace on the graph indicates the ratio measurement on MSNs expressing AKAR3 and was identified as D1or D2according to their response to either SKF-38393 (SKF, 1M) or CGS 21680 (CGS,
hypothesis implies that a powerful mechanism prevents DARPP-32 from remaining phosphorylated on the Thr34 position selectively in D1 MSNs. Thr34 residue is effi-ciently dephosphorylated by both PP-2A and PP-2B (but not by PP-1;Nishi et al., 1999), and further work is needed to analyze the possible differences in PP2A and PP2B activities between D1and D2MSNs. In contrast to tonic cAMP levels induced by PDE10A inhibition, cAMP signals elicited by D1receptor stimulation lead to a phosphoryla-tion of T34 and inhibiphosphoryla-tion of PP-1 (Bateup et al., 2008), an effect that is also clearly visible on transient responses to dopamine stimulations (Castro et al., 2013). This is con-sistent with the observation that, in D1 MSNs, PDE10A inhibition only affects PKA-dependent modulation of syn-aptic transmission when cAMP production is stimulated (Mango et al., 2014). This nonlinearity in D1MSNs may improve the detection of powerful but brief events such as the phasic dopamine signal associated with reward and novelty (Schultz, 2010), while filtering out smaller fluctua-tions in basal cAMP level.
In contrast, in D2MSNs DARPP-32 is phosphorylated on the Thr34 residue, as previously demonstrated (Nishi et al., 2008). In this situation, a moderate cAMP signal,
such as that produced by PDE10A inhibition, activates PKA, and, because PP-1 is inhibited, PKA targets remain phosphorylated. Indeed, when DARPP-32 bears the T34A mutation and can no longer inhibit PP-1, D2MSNs fail to respond to PDE10A inhibition (Fig. 7).
Further work is needed to analyze the possible differ-ences in PP-2A and PP-2B activities between D1and D2 MSNs that may contribute to the higher level of DARPP-32 phosphorylation on Thr34.
Another potential player in the D1/D2differences is the phosphorylation of DARPP-32 on Thr75, which is cata-lyzed by Cdk5 and is responsible for PKA inhibition (Bibb et al., 1999). Since Thr75 is dephosphorylated by a PKA-activated form of PP-2A containing the B56 subunit (Ahn et al., 2007), it could contribute to a hypersensitive feed-forward loop. However, this mechanism did not appear to be critical for PDE10A responses in D2MSNs, since we found no alteration of these responses in DARPP-32 T75A knock-in mutant mice.
The increased responsiveness of D2MSNs at the level of PKA signaling is opposed in vivo by the activity of D2 receptors: the simple blockade of these receptors by D2 antagonists strongly activates cAMP-dependent phos-continued
1M), respectively. The thick black line represents the average of all the traces in each group. TP-10 (100 nM) increased AKAR3 ratio
selectively in D2MSNs. E, The same experiment was repeated: there was no effect of localization, and TP-10 increased the AKAR3
ratio selectively in D2MSNs in both the dorsolateral and dorsomedial striatum (two-way ANOVA: localization effect, F(1,12)⫽ 0.374,
p⫽ 0.374; D1/D2effect, F(1,12)⫽ 44.01, p ⬍ 10ⴚ4; localization⫻ D1/D2interaction, F(1,12)⫽ 0.042, p ⫽ 0.804. Bonferroni’s post hoc
test:ⴱⴱp ⬍ 0.01.). C, E, Error bars indicate the SEM.
A
B
Figure 6. The DARPP-32 T34 residue is required for a TP-10-induced increase of histone H3 phosphorylation in the striatum in adult
mice in vivo. Wild type (WT) and DARPP-32 T34A mutant mice were treated with TP-10 (3 mg/kg) or vehicle. A, Examples of PH3 immunofluorescence, showing the dramatic reduction of TP-10 effects in the DARPP-32 T34A mutant mice. Scale bar, 20m. B, Quantification of the number of PH3-positive neurons in striatal coronal sections. Error bars indicate the SEM. Data were analyzed by a two-way ANOVA: genotype effect, F(1,12)⫽ 13.7, p ⬍ 0.01; TP-10 effect, F(1,12)⫽ 16.1, p ⬍ 0.01; genotype ⫻ TP-10 interaction,
phorylation (Håkansson et al., 2006; Bertran-Gonzalez et al., 2008, 2009;Bonito-Oliva et al., 2011;Valjent et al., 2011). Accordingly, haloperidol or clozapine selectively increases phospho-Thr34-DARPP-32 in D2 MSNs, and not in D1 MSNs (Bateup et al., 2008). This role of DARPP-32 in D2MSNs is functionally important for some effects of antipsychotic drugs since conditional knockout of DARPP-32 in D2MSNs leads to an increased locomo-tor activity and a strongly reduced catalepsy upon admin-istration of D2receptor inhibitors (Bateup et al., 2010). Our data show that the inhibition of PDE10A has functional effects that are similar to the blockade of D2 receptors since both potentiate the PKA pathway selectively in D2 MSNs. The particular sensitivity of D2 MSNs includes DARPP-32 Thr34 phosphorylation, which is more in-creased by PDE10A inhibitors in this population than in D1 MSNs (Nishi et al., 2008). Thus, hypersensitivity of DARPP-32 Thr34 phosphorylation could be a critical fac-tor to account for the responsiveness of D2MSNs to the blockade of either D2receptors or PDE10A activity.
The cellular effects of PDE10A inhibition affect MSNs neuronal properties, which are integrated through the basal ganglia network. For example, PDE10A inhibition was shown to potentiate D-amphetamine-dependent do-paminergic neuromodulation in vivo (Sotty et al., 2009). In addition, PDE10A inhibition was shown to massively in-crease cGMP levels in vivo (Siuciak et al., 2006;Schmidt et al., 2008;Grauer et al., 2009), whereas, no effect was observed in brain slice preparations (Nishi et al., 2008; this study). This discrepancy possibly results from the recruit-ment of striatal NOergic interneurons through network activity resulting indirectly from PDE10A inhibition.
In vivo, the inhibition of PDE10A also selectively
acti-vates D2MSNs in the medial striatum. Interestingly, this
striatal subregion is innervated by prefrontal and cingulate cortices, which are involved in the limbic system, and dopamine neurons originating from the ventral tegmental area. D1and D2receptors exert contrasting roles selec-tively in the dorsomedial striatum during behavioral inhi-bition in the stop-signal task in rats (Eagle et al., 2011), and lesions of the dorsomedial striatum disrupt prepulse inhibition (Baldan Ramsey et al., 2011). This region is also involved in early motor learning and is required for the cataleptic effects of haloperidol and for amphetamine motor response sensitization (Durieux et al., 2012). Medial striatum thus appears as a limbic system-related region that could be affected in schizophrenia.
The differences observed between medial and lateral striatum likely involve network effects and differences in synaptic plasticity reported between these two striatal subregions (Lovinger, 2010), and further work should pre-cisely show how these spatial differences are related to behavior. Our work nonetheless shows that the D1/D2 difference is present in brain slices in both medial and lateral striatum, and remains when network activity is blocked, showing that the D1/D2difference is an intrinsic property of D1 and D2 MSNs. The in vivo effects of PDE10A inhibitors were totally abolished in T34-DARPP-32 mutant mice, confirming the role of the DARPP-32/PP-1 loop as the initial determinant of the positive PKA response obtained during PDE10A inhibi-tion.
Further work is needed to determine whether the im-balance in PKA signal integration between D1 and D2 MSNs might be of interest to understand the pathophys-iology of other diseases that affect neuromodulatory pro-cesses in basal ganglia such as Parkinson’s disease or Huntington’s disease (Threlfell and West, 2013).
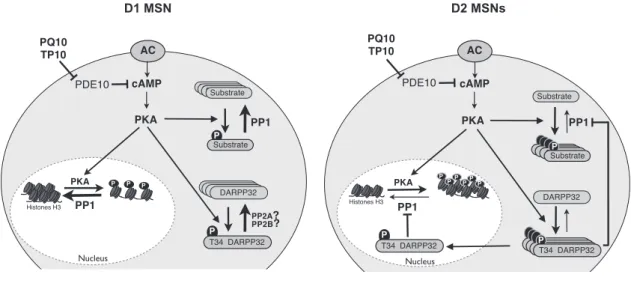
Figure 7. Diagram depicting the D1/D2differential response to PDE10A inhibition. PDE10A inhibition increases cAMP and activates
PKA to similar levels in D1and D2MSNs. In D2MSNs, DARPP-32 is phosphorylated and inhibits PP-1: PKA substrates thus remain
in the phosphorylated state, both in the cytosol and in the nucleus. In D1MSNs, DARPP-32 is in a dephosphorylated state: PP-1 is
fully active and dephosphorylates PKA substrates. Differences in PP2A/B activities between D1 and D2 MSNs may explain this
References
Ahn JH, Sung JY, McAvoy T, Nishi A, Janssens V, Goris J, Greengard P, Nairn AC (2007) The B’’/PR72 subunit mediates Ca2 ⫹-dependent dephosphorylation of DARPP-32 by protein phospha-tase 2A. Proc Natl Acad Sci U S A 104:9876 –9881. CrossRef Medline[Mismatch]
Allen MD, Zhang J (2006) Subcellular dynamics of protein kinase A activity visualized by FRET-based reporters. Biochem Biophys Res Commun 348:716 –721.CrossRef Medline
Baldan Ramsey LC, Xu M, Wood N, Pittenger C (2011) Lesions of the dorsomedial striatum disrupt prepulse inhibition. Neuroscience 180:222–228.CrossRef Medline
Bateup HS, Santini E, Shen W, Birnbaum S, Valjent E, Surmeier DJ, Fisone G, Nestler EJ, Greengard P (2010) Distinct subclasses of medium spiny neurons differentially regulate striatal motor behav-iors. Proc Natl Acad Sci U S A 107:14845–14850.CrossRef Med-line
Bateup HS, Svenningsson P, Kuroiwa M, Gong S, Nishi A, Heintz N, Greengard P (2008) Cell type-specific regulation of DARPP-32 phosphorylation by psychostimulant and antipsychotic drugs. Nat Neurosci 11:932–939.CrossRef Medline
Bertran-Gonzalez J, Bosch C, Maroteaux M, Matamales M, Hervé D, Valjent E, Girault JA (2008) Opposing patterns of signaling activa-tion in dopamine D1and D2receptor-expressing striatal neurons in
response to cocaine and haloperidol. J Neurosci 28:5671–5685.
CrossRef Medline
Bertran-Gonzalez J, Håkansson K, Borgkvist A, Irinopoulou T, Brami-Cherrier K, Usiello A, Greengard P, Hervé D, Girault JA, Valjent E, Fisone G (2009) Histone H3 phosphorylation is under the opposite tonic control of dopamine D2 and adenosine A2A receptors in striatopallidal neurons. Neuropsychopharmacology 34:1710 – 1720.CrossRef Medline
Bibb JA, Snyder GL, Nishi A, Yan Z, Meijer L, Fienberg AA, Tsai LH, Kwon YT, Girault JA, Czernik AJ, Huganir RL, Hemmings HCJ, Nairn AC, Greengard P (1999) Phosphorylation of DARPP-32 by Cdk5 modulates dopamine signalling in neurons. Nature 402:669 – 671.CrossRef Medline
Bonito-Oliva A, Feyder M, Fisone G (2011) Deciphering the Actions of Antiparkinsonian and Antipsychotic Drugs on cAMP/DARPP-32 Signaling. Front Neuroanat 5:38.CrossRef Medline
Castro LR, Brito M, Guiot E, Polito M, Korn CW, Hervé D, Girault JA, Paupardin-Tritsch D, Vincent P (2013) Striatal neurones have a specific ability to respond to phasic dopamine release. J Physiol 591:3197–3214.CrossRef Medline
Castro LR, Gervasi N, Guiot E, Cavellini L, Nikolaev VO, Paupardin-Tritsch D, Vincent P (2010) Type 4 phosphodiesterase plays dif-ferent integrating roles in difdif-ferent cellular domains in pyramidal cortical neurons. J Neurosci 30:6143–6151.CrossRef Medline
Chappie TA, Helal CJ, Hou X (2012) Current landscape of phospho-diesterase 10A (PDE10A) inhibition. J Med Chem 55:7299 –7331.
CrossRef Medline
Charych EI, Jiang LX, Lo F, Sullivan K, Brandon NJ (2010) Interplay of palmitoylation and phosphorylation in the trafficking and local-ization of phosphodiesterase 10A: implications for the treatment of schizophrenia. J Neurosci 30:9027–9037.CrossRef Medline
Coskran TM, Morton D, Menniti FS, Adamowicz WO, Kleiman RJ, Ryan AM, Strick CA, Schmidt CJ, Stephenson DT (2006) Immu-nohistochemical localization of phosphodiesterase 10A in multiple mammalian species. J Histochem Cytochem 54:1205–1213.
CrossRef Medline
Ducros M, Moreaux L, Bradley J, Tiret P, Griesbeck O, Charpak S (2009) Spectral unmixing: analysis of performance in the olfactory bulb in vivo. PLoS One 4:e4418.CrossRef Medline
Durieux PF, Schiffmann SN, de Kerchove d’Exaerde A (2012) Differ-ential regulation of motor control and response to dopaminergic drugs by D1R and D2R neurons in distinct dorsal striatum subre-gions. EMBO J 31:640 –653.CrossRef Medline
Eagle DM, Wong JC, Allan ME, Mar AC, Theobald DE, Robbins TW (2011) Contrasting roles for dopamine D1 and D2 receptor
sub-types in the dorsomedial striatum but not the nucleus accumbens core during behavioral inhibition in the stop-signal task in rats. J Neurosci 31:7349 –7356.CrossRef Medline
Ehrengruber MU, Lundstrom K, Schweitzer C, Heuss C, Schlesinger S, Gahwiler BH (1999) Recombinant Semliki Forest virus and Sindbis virus efficiently infect neurons in hippocampal slice cul-tures. Proc. Natl. Acad. Sci. U S A 96:7041–7046.Medline [Mis-match]
Ferré S, Fredholm BB, Morelli M, Popoli P, Fuxe K (1997) Adenosine-dopamine receptor-receptor interactions as an integrative mech-anism in the basal ganglia. Trends Neurosci 20:482–487.Medline
Franklin KBJ, Paxinos G (2007) The mouse brain in stereotaxic coordinates, Ed 3. New York: Elsevier.
Gerfen CR, Engber TM, Mahan LC, Susel Z, Chase TN, Monsma FJJ, Sibley DR (1990) D1 and D2 dopamine receptor-regulated gene expression of striatonigral and striatopallidal neurons. Science 250:1429 –1432.Medline
Gertler TS, Chan CS, Surmeier DJ (2008) Dichotomous anatomical properties of adult striatal medium spiny neurons. J Neurosci 28:10814 –10824.CrossRef Medline
Gervasi N, Hepp R, Tricoire L, Zhang J, Lambolez B, Paupardin-Tritsch D, Vincent P (2007) Dynamics of protein kinase A signaling at the membrane, in the cytosol, and in the nucleus of neurons in mouse brain slices. J Neurosci 27:2744 –2750.CrossRef Medline
Girault JA (2012) Integrating neurotransmission in striatal medium spiny neurons. Adv Exp Med Biol 970:407–429.CrossRef Medline
Gong S, Zheng C, Doughty ML, Losos K, Didkovsky N, Schambra UB, Nowak NJ, Joyner A, Leblanc G, Hatten ME, Heintz N (2003) A gene expression atlas of the central nervous system based on bacterial artificial chromosomes. Nature 425:917–925. CrossRef Medline
Grauer SM, Pulito VL, Navarra RL, Kelly M, Kelley C, Graf R, Langen B, Logue S, Brennan J, Jiang L, Charych E, Egerland U, Liu F, Marquis KL, Malamas M, Hage T, Comery TA, Brandon NJ (2009) Phosphodiesterase 10A inhibitor activity in preclinical models of the positive, cognitive and negative symptoms of schizophrenia. J Pharmacol Exp Ther 331:574 –590.CrossRef Medline
Håkansson K, Galdi S, Hendrick J, Snyder G, Greengard P, Fisone G (2006) Regulation of phosphorylation of the GluR1 AMPA receptor by dopamine D2 receptors. J Neurochem 96:482–488.CrossRef Medline
Heiman M, Schaefer A, Gong S, Peterson JD, Day M, Ramsey KE, Suárez-Fariñas M, Schwarz C, Stephan DA, Surmeier DJ, Green-gard P, Heintz N (2008) A translational profiling approach for the molecular characterization of CNS cell types. Cell 135:738 –748.
CrossRef Medline
Hemmings HC Jr, Greengard P, Tung HY, Cohen P (1984) DARPP-32, a dopamine-regulated neuronal phosphoprotein, is a potent inhibitor of protein phosphatase-1. Nature 310:503–505.Medline
Honda A, Adams SR, Sawyer CL, Lev-Ram V, Tsien RY, Dostmann WRG (2001) Spatiotemporal dynamics of guanosine 3’,5’-cyclic monophosphate revealed by a genetically encoded, fluorescent indicator. Proc Natl Acad Sci U S A 98:2437–2442. CrossRef Medline
Janssen MJ, Ade KK, Fu Z, Vicini S (2009) Dopamine modulation of GABA tonic conductance in striatal output neurons. J Neurosci 29:5116 –5126.CrossRef Medline
Jordi E, Heiman M, Marion-Poll L, Guermonprez P, Cheng SK, Nairn AC, Greengard P, Girault JA (2013) Differential effects of cocaine on histone posttranslational modifications in identified populations of striatal neurons. Proc Natl Acad Sci U S A 110:9511–9516.
CrossRef Medline
Kehler J, Nielsen J (2011) PDE10A inhibitors: novel therapeutic drugs for schizophrenia. Curr Pharm Des 17:137–150.Medline
Kelly MP, Adamowicz W, Bove S, Hartman AJ, Mariga A, Pathak G, Reinhart V, Romegialli A, Kleiman RJ (2014) Select 3’,5’-cyclic nucleotide phosphodiesterases exhibit altered expression in the aged rodent brain. Cell Signal 26:383–397.CrossRef Medline
Kotera J, Sasaki T, Kobayashi T, Fujishige K, Yamashita Y, Omori K (2004) Subcellular localization of cyclic nucleotide
phosphodies-terase type 10A variants, and alteration of the localization by cAMP-dependent protein kinase-dependent phosphorylation. J Biol Chem 279:4366 –4375.CrossRef Medline
Lakics V, Karran EH, Boess FG (2010) Quantitative comparison of phosphodiesterase mRNA distribution in human brain and periph-eral tissues. Neuropharmacology 59:367–374.CrossRef Medline
Le Moine C, Bloch B (1995) D1 and D2 dopamine receptor gene expression in the rat striatum: sensitive cRNA probes demonstrate prominent segregation of D1 and D2 mRNAs in distinct neuronal populations of the dorsal and ventral striatum. J Comp Neurol 355:418 –426.CrossRef Medline
Lovinger DM (2010) Neurotransmitter roles in synaptic modulation, plasticity and learning in the dorsal striatum. Neuropharmacology 58:951–961.CrossRef Medline
Mango D, Bonito-Oliva A, Ledonne A, Nistico R, Castelli V, Giorgi M, Sancesario G, Fisone G, Berretta N, Mercuri NB (2014) Phospho-diesterase 10A controls D1-mediated facilitation of GABA release from striato-nigral projections under normal and dopamine-depleted conditions. Neuropharmacology 76:127–136.CrossRef Medline
Matamales M, Bertran-Gonzalez J, Salomon L, Degos B, Deniau JM, Valjent E, Hervé D, Girault JA (2009) Striatal medium-sized spiny neurons: identification by nuclear staining and study of neuronal subpopulations in BAC transgenic mice. PLoS One 4:e4770.
CrossRef Medline
Nguyen QT, Tsai PS, Kleinfeld D (2006) MPScope: a versatile soft-ware suite for multiphoton microscopy. J Neurosci Methods 156: 351–359.CrossRef Medline
Nishi A, Bibb JA, Snyder GL, Higashi H, Nairn AC, Greengard P (2000) Amplification of dopaminergic signaling by a positive feed-back loop. Proc Natl Acad Sci U S A 97:12840 –12845.CrossRef Medline
Nishi A, Kuroiwa M, Miller DB, O’Callaghan JP, Bateup HS, Shuto T, Sotogaku N, Fukuda T, Heintz N, Greengard P, Snyder GL (2008) Distinct roles of PDE4 and PDE10A in the regulation of cAMP/PKA signaling in the striatum. J Neurosci 28:10460 –10471.CrossRef Medline
Nishi A, Snyder GL, Nairn AC, Greengard P (1999) Role of calcineurin and protein phosphatase-2A in the regulation of DARPP-32 de-phosphorylation in neostriatal neurons. J Neurochem 72:2015– 2021.Medline
Nowak SJ, Corces VG (2004) Phosphorylation of histone H3: a balancing act between chromosome condensation and transcrip-tional activation. Trends Genet 20:214 –220.CrossRef Medline
Padovan-Neto FE, Sammut S, Chakroborty S, Dec AM, Threlfell S, Campbell PW, Mudrakola V, Harms JF, Schmidt CJ, West AR (2015) Facilitation of corticostriatal transmission following pharma-cological inhibition of striatal phosphodiesterase 10A: role of nitric oxide-soluble guanylyl cyclase-cGMP signaling pathways. J Neu-rosci 35:5781–5791.CrossRef Medline
Polito M, Klarenbeek J, Jalink K, Paupardin-Tritsch D, Vincent P, Castro LR (2013) The NO/cGMP pathway inhibits transient cAMP signals through the activation of PDE2 in striatal neurons. Front Cell Neurosci 7:211.CrossRef Medline
Russwurm C, Koesling D, Russwurm M (2015) Phosphodiesterase 10A is tethered to a synaptic signaling complex in striatum. J Biol Chem 290:11936 –11947.CrossRef Medline
Schiffmann SN, Jacobs O, Vanderhaeghen JJ (1991) Striatal re-stricted adenosine A2 receptor (RDC8) is expressed by enkephalin but not by substance P neurons: an in situ hybridization histo-chemistry study. J Neurochem 57:1062–1067.Medline
Schiffmann SN, Vanderhaeghen JJ (1993) Adenosine A2 receptors regulate the gene expression of striatopallidal and striatonigral neurons. J Neurosci 13:1080 –1087.Medline
Schmidt CJ, Chapin DS, Cianfrogna J, Corman ML, Hajos M, Harms JF, Hoffman WE, Lebel LA, McCarthy SA, Nelson FR, Proulx-LaFrance C, Majchrzak MJ, Ramirez AD, Schmidt K, Seymour PA,
Siuciak JA, Tingley FD, Williams RD, Verhoest PR, Menniti FS (2008) Preclinical characterization of selective phosphodiesterase 10A inhibitors: a new therapeutic approach to the treatment of schizophrenia. J Pharmacol Exp Ther 325:681–690. CrossRef Medline
Schultz W (2010) Dopamine signals for reward value and risk: basic and recent data. Behav Brain Funct 6:24.CrossRef Medline
Seeger TF, Bartlett B, Coskran TM, Culp JS, James LC, Krull DL, Lanfear J, Ryan AM, Schmidt CJ, Strick CA, Varghese AH, Wil-liams RD, Wylie PG, Menniti FS (2003) Immunohistochemical lo-calization of PDE10A in the rat brain. Brain Res. 985:113–126.
Medline
Siuciak JA, Chapin DS, Harms JF, Lebel LA, McCarthy SA, Cham-bers L, Shrikhande A, Wong S, Menniti FS, Schmidt CJ (2006) Inhibition of the striatum-enriched phosphodiesterase PDE10A: a novel approach to the treatment of psychosis. Neuropharmacol-ogy 51:386 –396.CrossRef Medline
Sotty F, Montezinho LP, Steiniger-Brach B, Nielsen J (2009) Phos-phodiesterase 10A inhibition modulates the sensitivity of the me-solimbic dopaminergic system to D-amphetamine: involvement of the D1-regulated feedback control of midbrain dopamine neurons. J Neurochem 109:766 –775.CrossRef Medline
Svenningsson P, Le Moine C, Fisone G, Fredholm BB (1999) Distri-bution, biochemistry and function of striatal adenosine A2A recep-tors. Prog Neurobiol 59:355–396.Medline
Svenningsson P, Nishi A, Fisone G, Girault JA, Nairn AC, Greengard P (2004) DARPP-32: an integrator of neurotransmission. Annu Rev Pharmacol Toxicol 44:269 –296.CrossRef Medline
Svenningsson P, Tzavara ET, Carruthers R, Rachleff I, Wattler S, Nehls M, McKinzie DL, Fienberg AA, Nomikos GG, Greengard P (2003) Diverse psychotomimetics act through a common signaling pathway. Science 302:1412–1415.CrossRef Medline
Swingle MR, Amable L, Lawhorn BG, Buck SB, Burke CP, Ratti P, Fischer KL, Boger DL, Honkanen RE (2009) Structuactivity re-lationship studies of fostriecin, cytostatin, and key analogs, with PP1, PP2A, PP5, and(beta12-beta13)-chimeras (PP1/PP2A and PP5/PP2A), provide further insight into the inhibitory actions of fostriecin family inhibitors. J Pharmacol Exp Ther 331:45–53.
CrossRef Medline
Threlfell S, Sammut S, Menniti FS, Schmidt CJ, West AR (2009) Inhibition of phosphodiesterase 10A increases the responsiveness of striatal projection neurons to cortical stimulation. J Pharmacol Exp Ther 328:785–795.CrossRef Medline
Threlfell S, West AR (2013) Review: modulation of striatal neuron activity by cyclic nucleotide signaling and phosphodiesterase in-hibition. Basal Ganglia 3:137–146.CrossRef Medline
Valjent E, Bertran-Gonzalez J, Bowling H, Lopez S, Santini E, Mata-males M, Bonito-Oliva A, Hervé D, Hoeffer C, Klann E, Girault JA, Fisone G (2011) Haloperidol regulates the state of phosphorylation of ribosomal protein S6 via activation of PKA and phosphorylation of DARPP-32. Neuropsychopharmacology 36:2561–2570. Cross-Ref Medline
Valjent E, Bertran-Gonzalez J, Hervé D, Fisone G, Girault JA (2009) Looking BAC at striatal signaling: cell-specific analysis in new transgenic mice. Trends Neurosci 32:538 –547.CrossRef Medline
Yagishita S, Hayashi-Takagi A, Ellis-Davies GC, Urakubo H, Ishii S, Kasai H (2014) A critical time window for dopamine actions on the structural plasticity of dendritic spines. Science 345:1616 –1620.
CrossRef Medline
Yang L, Gilbert ML, Zheng R, McKnight GS (2014) Selective expres-sion of a dominant-negative type I␣ PKA regulatory subunit in striatal medium spiny neurons impairs gene expression and leads to reduced feeding and locomotor activity. J Neurosci 34:4896 – 4904.CrossRef Medline
Zhang J, Hupfeld CJ, Taylor SS, Olefsky JM, Tsien RY (2005) Insulin disrupts beta-adrenergic signalling to protein kinase A in adi-pocytes. Nature 437:569 –573.CrossRef Medline